Introduction
This document describes the XR Embedded Packet Tracer. It helps to trace custom packet flows for service validation and troubleshooting.
Prerequisites
Requirements
The XR Embedded Packet Tracer is initially available starting with Cisco IOS® XR version 7.1.2 and is supported on the ASR 9000 series. Additional XR product families are planned to gain support in future updates.
Components Used
The XR Embedded Packet Tracer is independent of specific protocols and is compatible with all types of unicast and multicast packets.
The information in this document was created from the devices in a specific lab environment. All of the devices used in this document started with a cleared (default) configuration. If your network is live, ensure that you understand the potential impact of any command.
Background Information.
The XR Embedded Packet Tracer framework has greatly simplified service flow validation and troubleshooting of packet forwarding issues.
When packet tracing is activated on an interface, the Network Processor (NP) evaluates incoming packets to determine if they meet the defined criteria. If a packet satisfies the specified condition, an identifier is added to its internal header. This identifier facilitates tracking the packet across all components involved in the data-path and punt-path within the router.
The condition refers to a set of criteria or rules that define which packets can be traced as they pass through the router. These conditions help the system identify and monitor specific packet flows for troubleshooting or service validation.
The conditions consist of these components:
-
Physical Interface(s):
- Specifies the network interfaces where packets are expected to arrive.
- Example:
packet-trace condition interface Gi0/0/0/1
-
Offset/Value/Mask Triplets:
-
Defines criteria for matching specific parts of a packets header (or payload).
-
These triplets allow the framework to be protocol-agnostic, as they can represent any part of any protocol header.
Example:
-
Offset: Position within the packet (byte offset).
-
Value: Expected value at that position.
-
Mask: Bits to match for precision.
XR Embedded Packet Tracer Restrictions And Limitations
XR release 7.1.2:
Packet marking is supported on Lightspeed Plus, Lighstpeed, and Tomahawk linecards.
The Packet tracing is supported in the previous mentioned type of linecards.
You can specify a maximum of three 4-octet Offset/Value/Mask sets.
XR release 7.5.2:
Packet tracer automatically resolves bundle members at the time when the condition is set
you can now trace packets on the punt path in SPP, NetIO, UDP, TCP
Packet Tracer Workflow
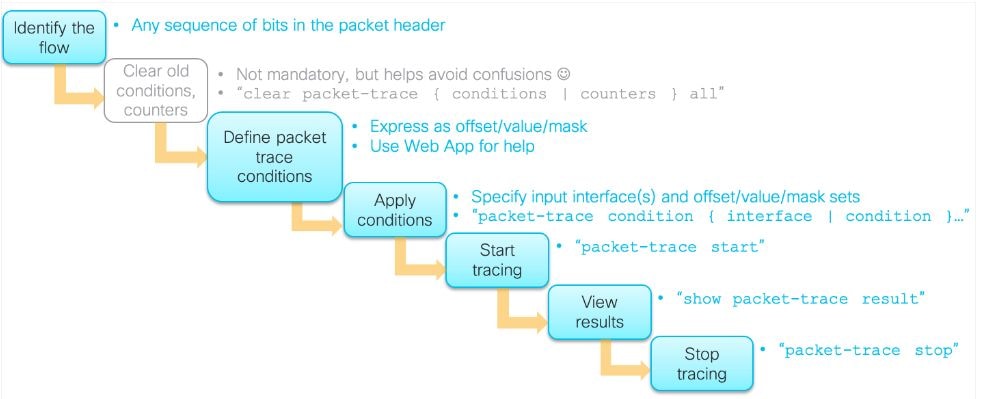
This diagram illustrates how the packet tracer workflow operates.
Configure
Clear Packet Tracer Counters And Conditions
Command to reset the packet tracer counters; The packet tracer counters can be reset whenever needed:
clear packet-trace counters all
Command to remove all packet tracer conditions, use this command:
clear packet-trace conditions all

Caution: By design, packet tracer conditions can be cleared only while packet tracing is inactive.
Start/Stop Packet Tracing
Need to manually specify the beginning and end of the packet trace:
RP/0/RP0/CPU0:Device#  packet-trace start
RP/0/RP0/CPU0:Device#  packet-trace stop
Packet Tracer Conditions
The conditions consist in:
-
Physical Interface(s): Indicate the physical interface(s) where packets are expected to be received.
-
Offset/Value/Mask Triplets. Help to define the flow of interest.
Packet Tracer Conditions - Interfaces
RP/0/RP0/CPU0:Device#packet-trace condition interface GigE0/0/0/0
RP/0/RP0/CPU0:Device#packet-trace condition interface GigE0/0/0/1

Tip: When tracing on sub-interfaces, the Offset/Value/Mask specification must take into account the dot1q or QinQ encapsulation.
Packet Tracer Conditions - Offset/Value/Mask
The "XR Packet Tracer Condition Generator Web App" provides a tool for creating packet tracer conditions.
Its source code and installation guidelines can be accessed on GitHub under the name: XR Embedded Packet Tracer - Condition Generator .
This application enables you to visually construct the protocol stack for your desired packet flow, select the relevant layers for defining conditions, and input the values (with optional masks) that describe the specific flow you want to trace.
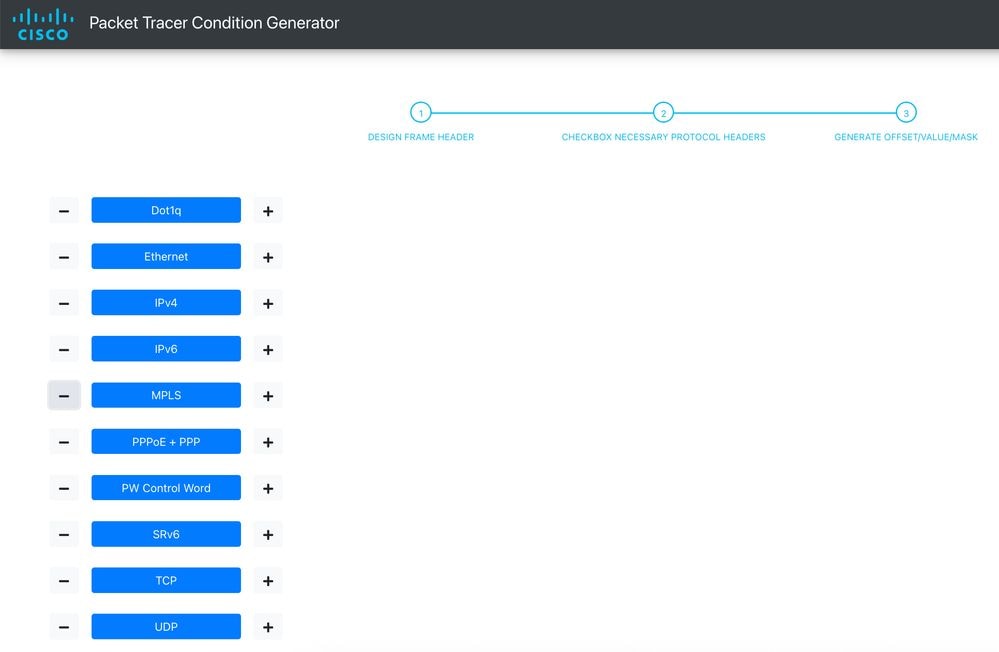 The landing page of the Web App displays a list of protocol headers that are supported for configuration.
Ensure that you include all the necessary headers preceding the one you intend to match traffic against, as the offset calculation relies on the order of the headers.
Tip: Remember to include the PW control word header if it is being utilized.
Configuration Example:
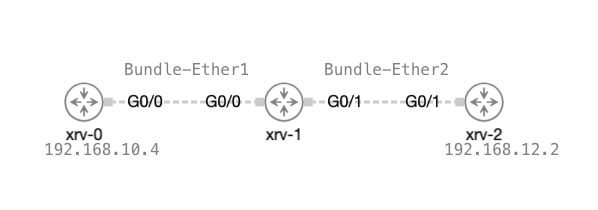
Here is an example of a topology. Our objective is verify whether packets are being properly received and transmitted through the XRV1 device:
1.- Set up the packet-trace condition for the specific interfaces you wish to monitor.
RP/0/RP0/CPU0:xrv-1#packet-trace condition interface Bundle-Ether1
RP/0/RP0/CPU0:xrv-1#packet-trace condition interface Bundle-Ether2
2.- Generate the Offset/Value/Mask, Select the checkboxes next to the headers you wish to match. You can choose multiple headers if necessary. For each selected header, a corresponding frame is displayed on the right side. Enter your desired value and mask into the frame, and then click the Submit button to finalize your configuration.
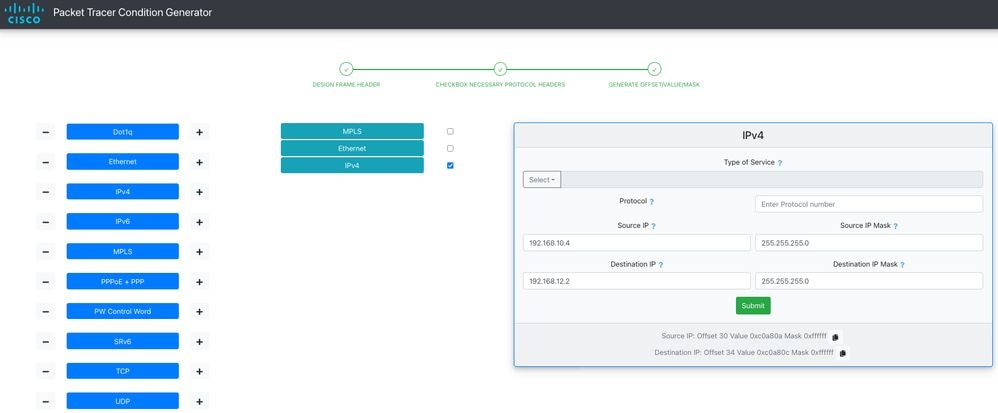
3.- Once the Offset/Value/Mask has been copied to the clipboard, utilize it to define the conditions:
RP/0/RP0/CPU0:xrv-1#packet-trace condition 1 Offset 30 Value 0xc0a80a Mask 0xffffff
RP/0/RP0/CPU0:xrv-1#packet-trace condition 5 Offset 34 Value 0xc0a80c Mask 0xffffff
4.- Check the packet trace status:
RP/0/RP0/CPU0:xrv-1#show packet-trace status
------------------------------------------------------------
Packet Trace Master Process:
  Buffered Conditions:
    Interface Bundle-Ether1
      Member GigE0/0/0/0
    Interface Bundle-Ether2
      Member GigE0/0/0/1
    1 Offset 30 Value 0xc0a80a Mask 0xffffff
    5 Offset 34 Value 0xc0a80c Mask 0xffffff
  Status: Inactive
RP/0/RP0/CPU0:xrv-1#
RP/0/RP0/CPU0:xrv-1#show packet-trace status detail
------------------------------------------------------------
Location: 0/0/CPU0
Available Counting Modules: 4

  #1 SPP
    Last errors:
  #2 npu_server_lsp
   Last errors:
  #3 NETIO
    Last errors:
  #4 UDP
    Last errors:

Available Marking Modules: 1

  #1 npu_server_lsp
    Interfaces: 0
    Conditions: 0
    Last errors:
------------------------------------------------------------
Packet Trace Master Process:

  Buffered Conditions:
    Interface Bundle-Ether1
      Member GigE0/0/0/0
    Interface Bundle-Ether2
      Member GigE0/0/0/1
    1 Offset 30 Value 0xc0a80a Mask 0xffffff
    5 Offset 34 Value 0xc0a80c Mask 0xffffff
  Status: Inactive
------------------------------------------------------------
Location: 0/RP0/CPU0
Available Counting Modules: 3

  #1 SPP
    Last errors:
  #2 NETIO
    Last errors:
  #3 UDP
    Last errors:

Available Marking Modules: 0
RP/0/RP0/CPU0:xrv-1#
5.- Start the packet tracer:
RP/0/RP0/CPU0:xrv-1# packet-trace start
RP/0/RP0/CPU0:xrv-1#
RP/0/RP0/CPU0:xrv-1# show packet-trace status
------------------------------------------------------------
Packet Trace Master Process:
  Buffered Conditions:
    Interface Bundle-Ether1
      Member GigE0/0/0/0
    Interface Bundle-Ether2
      Member GigE0/0/0/1
    1 Offset 30 Value 0xc0a80a Mask 0xffffff
    5 Offset 34 Value 0xc0a80c Mask 0xffffff
  Status: Active
RP/0/RP0/CPU0:xrv-1#
6. - Lets wait for some minutes in order to capture the traffic:
7.- Check the results:
RP/0/RP0/CPU0:xrv-1#show packet-trace result
T: D - Drop counter; P - Pass counter
Location     | Source       | Counter                   | T | Last-Attribute                           | Count
------------   ------------   -------------------------   -   ----------------------------------------   ---------------
0/0/CPU0       NP0            PACKET_MARKED               P      GigE0_0_0_0                             6812
0/0/CPU0       NP0            PACKET_TO_FABRIC            P                                              6812
0/0/CPU0       NP0            PACKET_TO_PUNT              P                                              6543
0/0/CPU0       NP0            PACKET_FROM_FABRIC          P                                              6812
0/0/CPU0       NP0            PACKET_TO_INTERFACE         P      GigE0_0_0_1                             6812
RP/0/RP0/CPU0:xrv-1#
8.- You can check all counters registered with the packet tracer framework along with their descriptions, using the show packet-trace description command:
RP/0/RP0/CPU0:xrv-1#show packet-trace descriptions
NP0               PACKET_MARKED                M   Marked from ingress interface
NP0               PACKET_FROM_INJECT           P   Injected from linecard CPU
NP0               PACKET_FROM_FAB_INJECT       P   Injected from fabric
NP0               PACKET_ING_DROP              D   Dropped on ingress
NP0               PACKET_TO_FABRIC             P   Sent to router fabric
NP0               PACKET_TO_PUNT               P   Punted to linecard for CPU handling
NP0               PACKET_FROM_FABRIC           P   From router fabric
NP0               PACKET_EGR_DROP              D   Dropped on egress
NP0               PACKET_TO_INTERFACE          P   Packet sent to network interface
<SNIP>
RP/0/RP0/CPU0:xrv-1#
9.- Stop the packet trace:
RP/0/RP0/CPU0:xrv-1#packet-trace stop
Related Information
XR Embedded Packet Tracer
Cisco Technical Support & Downloads
Understand ASR 9000 Series Line Card Types
 Feedback