Introduction
This document describes the general methodology to troubleshoot a slow APIC GUI experience.
Quick Start
It is frequently found that slow APIC GUI issues are the result of a high rate of API Requests sourced from a script, integration, or application. The access.log of an APIC logs each processed API request. The access.log of an APIC can be quickly analyzed with the Access Log Analyzer script within the Github Datacenter group aci-tac-scripts project.
Background Information
APIC as a Webserver - NGINX
NGINX is the DME responsible for the API endpoints available on each APIC. If NGINX is down, API requests cannot be handled. If NGINX is congested, the API is congested. Each APIC runs its own NGINX process, so it is possible that only a single APIC can have NGINX problems if only that APIC is targeted by any aggressive queriers.
The APIC UI performs multiple API requests to populate each page. Similarly, all APIC show commands (NXOS Style CLI) are wrappers for python scripts that perform multiple API requests, handle the response, then serve it to the user.
Relevant Logs
|
Log Filename
|
Location
|
Which techsupport is it in
|
Comments
|
|
access.log
|
/var/log/dme/log
|
APIC 3of3
|
ACI agnostic, gives 1 line per API request
|
|
error.log
|
/var/log/dme/log
|
APIC 3of3
|
ACI Agnostic, shows nginx errors (throttling included)
|
|
nginx.bin.log
|
/var/log/dme/log
|
APIC 3of3
|
ACI specific, logs DME transactions
|
|
nginx.bin.warnplus.log
|
/var/log/dme/log
|
APIC 3of3
|
ACI Specific contains logs that are warning+ severity
|
Methodology
Isolate Initial Trigger
What is affected?
- Which APICs are affected; one, many, or all APICs?
- Where is slowness seen; via UI, CLI commands, or both?
- Which specific UI pages or commands are slow?
How is the slowness experienced?
- Is this seen across multiple browsers for a single user?
- Do multiple users report slowness or just a single/subset of users?
- Do the affected users share a similar geographic location or network path from browser to APIC?
When was the slowness first noticed?
- Was an ACI integration or script recently added?
- Was a browser extension recently enabled?
- Was there a recent change in ACI configuration?
Check NGINX Usage and Health
Access.log Entry Format
access.log is a feature of NGINX and is, therefore, APIC agnostic. Each line represents 1 HTTP Request that the APIC received. Reference this log to understand the NGINX usage of an APIC.
The default access.log format on ACI version 5.2+:
log_format proxy_ip '$remote_addr ($http_x_real_ip) - $remote_user [$time_local]'
                    '"$request" $status $body_bytes_sent '
                    '"$http_referer" "$http_user_agent"';
This line represents an access.log entry when a moquery -c fvTenant is performed:
127.0.0.1 (-) - - [07/Apr/2022:20:10:59 +0000]"GET /api/class/fvTenant.xml HTTP/1.1" 200 15863 "-" "Python-urllib"
Map of example access.log entry to log_format:
|
log_format field
|
Content from example
|
Comments
|
|
$remote_addr
|
127.0.0.1
|
IP of host which sent this request
|
|
$http_x_real_ip
|
-
|
IP of last requester if proxies in use
|
|
$remote_user
|
-
|
Not generally used. Check nginx.bin.log to track which user logged in to perform requests
|
|
$time_local
|
07/Apr/2022:20:10:59 +0000
|
When the request was processed
|
|
$request
|
GET /api/class/fvTenant.xml HTTP/1.1
|
Http Method (GET, POST, DELETE) and URI
|
|
$status
|
200
|
HTTP Response Status Code
|
|
$body_bytes_sent
|
1586
|
response payload size
|
|
$http_referer
|
-
|
-
|
|
$http_user_agent
|
Python-urllib
|
What type of client sent the request
|
Access.log Behaviors
High rate request bursts over a large period of time:
- Continual bursts of 40+ requests per second can cause UI slowness
- Identify which host(s) are responsible for the queries
- Reduce or disable the source of queries to see if this improves APIC response time.
Consistent 4xx or 5xx responses:
- If found, identify the error message from nginx.bin.log
The access.log of an APIC can be quickly analyzed with the Access Log Analyzer script within the Github Datacenter group aci-tac-scripts project.
Check NGINX Resource Usage
NGINX CPU and memory usage can be checked with the top command from the APIC:
top - 13:19:47 up 29 days, 2:08, 11 users, load average: 12.24, 11.79, 12.72
Tasks: 785 total, 1 running, 383 sleeping, 0 stopped, 0 zombie
%Cpu(s): 3.5 us, 2.0 sy, 0.0 ni, 94.2 id, 0.1 wa, 0.0 hi, 0.1 si, 0.0 st
KiB Mem : 13141363+total, 50360320 free, 31109680 used, 49943636 buff/cache
KiB Swap: 0 total, 0 free, 0 used. 98279904 avail Mem

PID   USER PR NI VIRT    RES   SHR   S %CPU %MEM TIME+     COMMAND
21495 root 20 0  4393916 3.5g 217624 S 2.6  2.8  759:05.78 nginx.bin
High NGINX resource usage can directly correlate to a high rate of processed requests.
Check for Cores
An NGINX crash is not typical for Slow APIC GUI issues. However, if NGINX cores are found, attach them to a TAC SR for analysis. Refer to the ACI Techsupport guide for steps to check for cores.
Check Client to Server Latency
If rapid requests are not found but a user continues to exhibit UI slowness, the issue can be Client (browser) to Server (APIC) latency.
In these scenarios, validate the data path from the browser to the APIC (Geographic distance, VPN, etc). If possible, deploy and test access from a jump server located in the same geographic region or Data Center as the APICs to isolate. Validate if other users exhibit a similar amount of latency.
Browser Development Tools Network Tab
All Browsers have the ability to validate HTTP requests and responses via its Browser Development toolkit, typically within a Network tab.
This tool can be used to validate the amount of time it takes for each stage of browser-sourced requests as shown in the image.
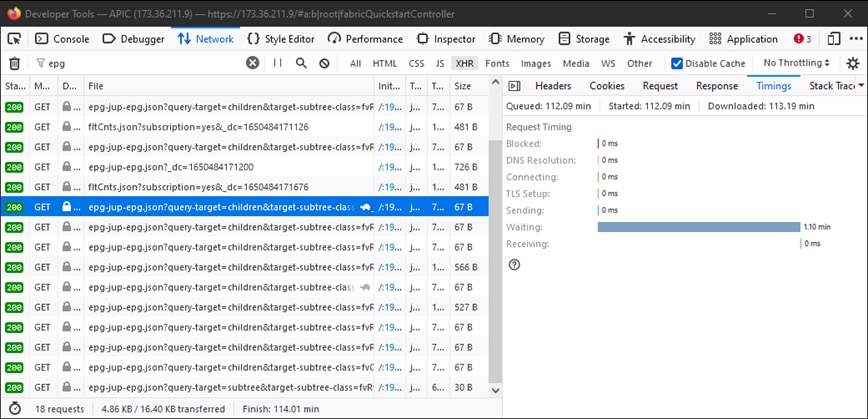 Example of the Browser Waiting 1.1 minutes for the APIC to Respond
Enhancements for Specific UI Pages
Policy Group page:
Cisco bug ID CSCvx14621 - APIC GUI loads slowly on IPG policies in the Fabric tab.
Interface under Inventory page:
Cisco bug ID CSCvx90048 - Initial load of "Layer 1 Physical Interface Configuration" Operational Tab is long/induces 'freeze'.
General Recommendations for Client > Server Latency
Certain browsers, such as Firefox, allow for more web connections per host by default.
- Check if this setting is configurable on the browser version that is used
- This matters more for multi-query pages, such as the Policy Group page
VPN and distance to APIC increase overall UI slowness given client browser requests and APIC response travel time. A jump box geographically local to the APICs significantly reduces the browser to APIC travel times.
Check for Long-Web Requests
If a Webserver (NGINX on APIC) is handles a high volume of Long-Web Requests, this can affect the performance of other requests received in parallel.
This is especially true for systems which have distributed databases, such as APICs. A single API request can require additional requests and lookups sent to other nodes in the fabric which can result in expectedly longer response times. A burst of these Long-Web Requests within a small time frame can compound the amount of resources required and lead to unexpectedly longer response times. Furthermore, received requests can then time out (90 seconds) which results in unexpected system behavior from a user perspective.
System Response Time - Enable Calculation for Server Response Time
In 4.2(1)+, a user can enable "System Performance Calculation" which tracks and highlights API requests that took along time to handle.
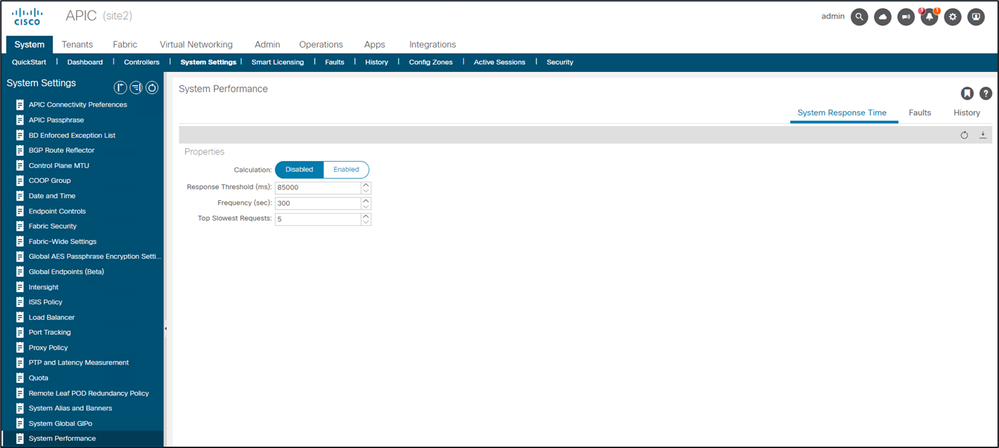 Calculation can be enabled from System - System Settings - System Performance
Once "Calculation" is enabled, a user can navigate to specific APICs under Controllers to view the Slowest API Requests within the last 300 seconds.
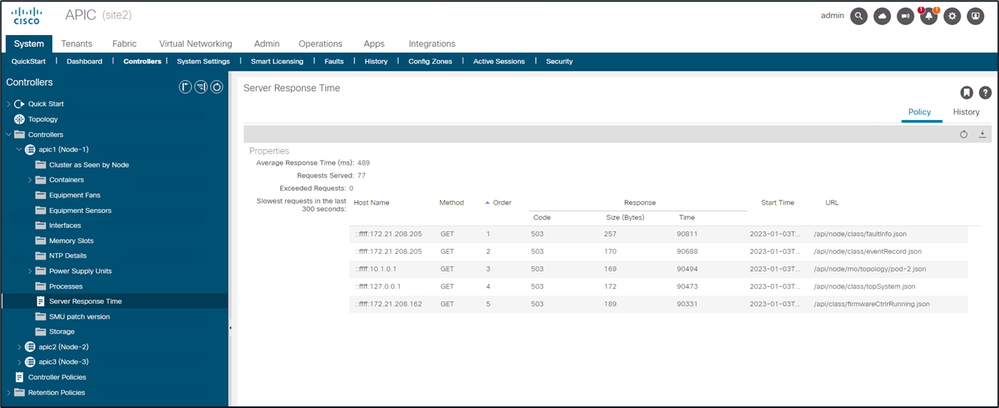 System - Controllers - Controllers Folder - APIC x - Server Response Time
APIC API Usage Considerations
General Pointers to Ensure That a Script Does Not Harm Nginx
- Each APIC runs its own NGINX DME.
- Only APIC 1's NGINX processes requests to APIC 1. APIC 2 and 3's NGINX does not process those requests.
- In general, 40+ API requests per second over a long period of time debilitates NGINX.
- If found, reduce the aggressiveness of requests.
- If the Requests host cannot be modified, consider NGINX Rate Limits on the APIC.
Address Script Inefficiencies
- Do not log in/log out before each API Request.
- If your script queries many DNs that share a parent, instead of collapse the queries into a single logical parent query with Query Filters.
- If you need updates of an object or class of object, consider websocket subscriptions instead of rapid API requests.
NGINX Request Throttle
Available in 4.2(1)+, a user can enable request throttle against HTTP and HTTPS independently.
Note: Starting from ACI version 6.1(2), the supported maximum rate for this feature was reduced to 40 requests per second (r/s) or 2400 requests per minute (r/m) from 10,000 r/m.
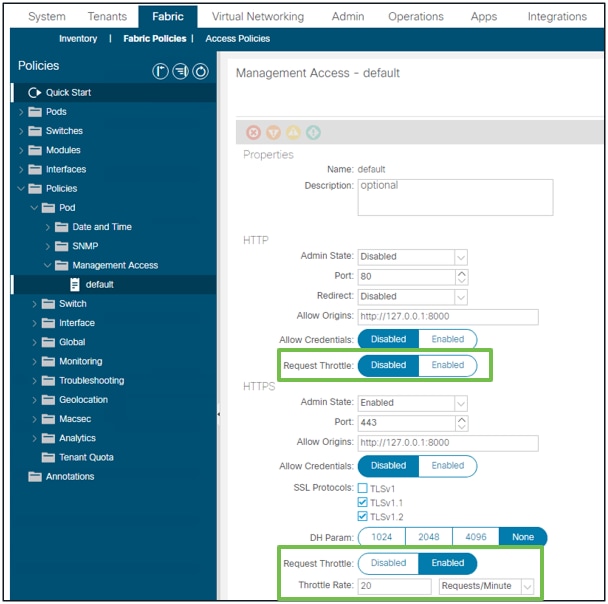 Fabric - Fabric Policies - Policies Folder - Management Access Folder - default
When enabled:
- NGINX is restarted to apply config file changes
- A new zone, httpsClientTagZone, is written to nginx config
- The Throttle rate can be set in Requests per Minute (r/m) or Requests per Second (r/s).
- Request Throttle relies on the Rate Limit Implementation included in NGINX
- API Requests against the /api/ URI use the user-defined Throttle Rate + burst= (Throttle Rate x 2) + nodelay
- There is a non-configurable throttle (zone aaaApiHttps) for /api/aaaLogin and /api/aaaRefresh which rate-limits at 2r/s + burst=4 + nodelay
- Request Throttle is tracked on a per-client-ip-address basis
- API requests sourced from the APIC self-ip (UI + CLI) bypass the throttle
- Any Client IP Address which crosses the user-defined throttle rate + burst threshold receives a 503 response from the APIC
- These 503s can be correlated within the access logs
- error.log has entries indicating when throttling has been activated (zone httpsClientTagZone) and against which Client hosts
apic# less /var/log/dme/log/error.log
...
2023/04/17 20:19:14 [error] ... limiting requests, excess: 40.292 by zone "httpsClientTagZone", client: h.o.s.t, ... request: "GET /api/class/...", host: "a.p.i.c"
2023/04/17 20:19:14 [error] ... limiting requests, excess: 40.292 by zone "httpsClientTagZone", client: h.o.s.t, ... request: "GET /api/node/...", host: "a.p.i.c"
As a general rule, Request Throttle only serves to protect the server (APIC) from DDOS-like symptoms induced by query-aggressive Clients. Understand and isolate the request-aggressive Client for final solutions in the app/script logic.
Recomendations
These recommendations are designed to help reduce the load and operational stress on the APIC, particularly in scenarios where no single source is responsible for a high volume of API calls. By implementing these best practices, you can minimize unnecessary processing, logging, and event generation across your fabric, resulting in improved system stability and performance. These suggestions are especially relevant in environments where aggregate behaviors rather than isolated incidents contribute to APIC strain.
Disable ACL Logging
Ensure that ACL logging is turned OFF during normal operations. Enable it only during scheduled maintenance windows for troubleshooting or debugging. Continuous logging can generate excessive informational messages, especially with high- volume traffic drops across multiple switches, increasing APIC workload.
For more details, refer to the Cisco APIC Security Configuration Guide (link of 5.2.x guide):
https://www.cisco.com/c/en/us/td/docs/dcn/aci/apic/5x/security-configuration/cisco-apic-security-configuration-guide-release-52x/security-policies-52x.html
Limit Syslog Conversion to Critical Events
Configure the system so that only syslog messages of severity ALERT are converted to eventRecords. Avoid converting INFORMATION level (which includes ACL.logging) to prevent noisy events from overwhelming the APIC:
1. Navigate to Fabric → Fabric Policies → Policies → Monitoring → Common Policy → Syslog Message Policies → Default.
2. Adjust the facility filter to set syslog severity to alert.
Squelch Non Essential Event Codes
Suppress (squelch) event codes that are not relevant to your monitoring needs to reduce noise.
To squelch event code E4204939, use this command on any APIC CLI:
bash
icurl -k -sX POST -d '<fabricInst><monCommonPol><eventSevAsnP code="E4204939" sev="squelched"/></monCommonPol></fabricInst>' 'https://localhost/api/node/mo/uni/.xml’
To verify:
bash
icurl -k -sX GET 'https://localhost/api/node/class/eventSevAsnP.xml' | xmllint --format -
Alternatively, check via UI:
Fabric > Fabric Policies > Policies > Monitoring > Common Policy > Event Severity Assignment Policy
Optimize ND Subscription Refreshes
For fabrics managed by ND versions earlier than 3.2.2m or 4.1.1g, upgrade to one of these versions or later to optimize subscription refresh intervals. Earlier versions refresh every 45 seconds per MO, which, at scale, can result in over 300,000 APIC requests per day. Updated versions increase the subscription timeout to 3600 seconds (1 hour), reducing refreshes to around 5,000 per day.
Monitor Intersight Related Queries
Intersight enabled fabrics generate periodic topsystem queries from the DC connector (every 15 seconds), adding to APIC load.
In release 6.1.2 and later, this query has been optimized for reduced overhead.
Tune Retention Policies for Records
Set the retention policy for eventRecord, faultRecord, and healthRecord to 1,000 to prevent excessive accumulation of records. This is especially useful when you are extracting these records on a regular basis for any specific operational activity. Always assess the impact of reducing monitoring granularity against your operational and troubleshooting requirements.
 Feedback