Troubleshoot Packet Drops on ASR 1000 Series Service Routers
Available Languages
Download Options
Bias-Free Language
The documentation set for this product strives to use bias-free language. For the purposes of this documentation set, bias-free is defined as language that does not imply discrimination based on age, disability, gender, racial identity, ethnic identity, sexual orientation, socioeconomic status, and intersectionality. Exceptions may be present in the documentation due to language that is hardcoded in the user interfaces of the product software, language used based on RFP documentation, or language that is used by a referenced third-party product. Learn more about how Cisco is using Inclusive Language.
Contents
Introduction
This document describes how to troubleshoot packet drop problems on the Cisco ASR 1000 Series Aggregation Services Routers.
Prerequisites
Requirements
There are no specific requirements for this document.
Components Used
The information in this document is based on these software and hardware versions:
-
All Cisco ASR 1000 Series Aggregation Services Routers, which include the 1002, 1004, and 1006
-
Cisco IOS® XE Software Release 2.3.x and later that supports the Cisco ASR 1000 Series Aggregation Services Routers
The information in this document was created from the devices in a specific lab environment. All of the devices used in this document started with a cleared (default) configuration. If your network is live, ensure that you understand the potential impact of any command.
Conventions
Refer to Cisco Technical Tips Conventions for more information on document conventions.
Packet Flow of ASR 1000 Series Routers
High Level Packet Flow
A Cisco ASR 1000 Series Router comprises these functional elements in the system:
-
Cisco ASR 1000 Series Route Processor 1 (RP1)
-
Cisco ASR 1000 Series Embedded Services Processor (ESP)
-
Cisco ASR 1000 Series SPA Interface Processor (SIP)
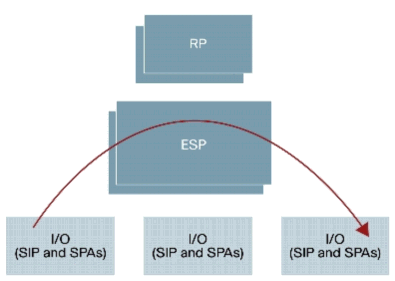
The Cisco ASR 1000 Series Routers introduce the Cisco QuantumFlow Processor (QFP) as their hardware architecture. In the QFP based architecture, all packets are forwarded through ESP, so, if a problem occurs in ESP, the forwarding stops.
Figure 1 Cisco ASR 1006 System with Dual Route Processors, Dual ESPs, and Three SIPs
Refer toCisco ASR 1000 Series Aggregation Services Routers for more information.
Steps to Troubleshoot for Packet Drops on Cisco ASR 1000 Series Service Router
Point of Packet Drops
Cisco ASR 1000 Series Routers is a built on a Route Processor (RP), Embedded Services Processor (ESP), SPA Interface Processor (SIP), and Shared Port Adapter (SPA). All packets are forwarded through ASICs on each module.
Figure 2 Data Path Diagram of Cisco ASR 1000 Series System

There are several points of packet drops shown in Table 1on the Cisco ASR 1000 Series Routers.
Table 1 Points of Packet Drops
|
Module |
Functional Component |
|---|---|
|
SPA |
Dependent on the interface type |
|
SIP |
IO Control Processor (IOCP) SPA Aggregation ASIC Interconnect ASIC |
|
ESP |
Cisco QuantumFlow Processor (QFP) Forwarding Control Processor (FECP) Interconnect ASIC QFP subsystem. QFP subsystem consists of these components:
|
|
RP |
Linux Shared Memory Punt Interface (LSMPI) Interconnect ASIC |
Get Information about the Packet Drop
If you encounter an unexpected packet drop, you must make sure that the console output, difference of the packet counter, and reproduction steps are available for troubleshooting. In order to determine the cause, the first step is to capture as much information about the problem as possible. This information is necessary to determine the cause of the problem:
-
Console logs— Refer to Applying Correct Terminal Emulator Settings for Console Connections for more information.
-
Syslog information— If you have set up the router to send logs to a syslog server, you are able to obtain information about what happened. Refer toHow to Configure Cisco Devices for Syslog for more information.
-
show platform— The show platform command displays the status for RPs, ESPs, SPAs, and the power supplies.
-
show tech-support— The show tech-support command is a compilation of many different commands that include show version and show running-config. When a router runs into problems, the Cisco Technical Assistance Center (TAC) engineer usually asks for this information to troubleshoot the hardware issue. You must collect theshow tech-supportbefore you do a reload or power-cycle because these actions can cause information about the problem to be lost.

Note: The show tech-support command does not include the show platform or show logging commands.
-
Reproduction step(if available) — The steps to reproduce the problem. If unreproducible, check the conditions at the time of the packet drop.
-
SPA counter information— See the SPA Counter section.
-
SIP counter information— See the SIP Counter section.
-
ESP counter information— See the ESP Counter section.
-
RP counter information— See the RP Counter section.
Command List to Collect Counters Information
There are numerous platform-specific commands available to troubleshoot packet forwarding. Collect these commands if you open a TAC Service Request. In order to identify the difference of a counter, collect these commands several times. The command of bold character is particularly useful to begin troubleshooting. The exclude _0_ option is effective to cause the counter to exclude 0.
SPA
show interfaces <interface-name>
show interfaces <interface-name> accounting
show interfaces <interface-name> stats
SIP
show platform hardware port <slot/card/port> plim statistics
show platform hardware subslot {slot/card} plim statistics
show platform hardware slot {slot} plim statistics
show platform hardware slot {0|1|2} plim status internal
show platform hardware slot {0|1|2} serdes statistics
ESP
show platform hardware slot {f0|f1} serdes statistics
show platform hardware slot {f0|f1} serdes statistics internal
show platform hardware qfp active bqs 0 ipm mapping
show platform hardware qfp active bqs 0 ipm statistics channel all
show platform hardware qfp active bqs 0 opm mapping
show platform hardware qfp active bqs 0 opm statistics channel all
show platform hardware qfp active statistics drop | exclude _0_
show platform hardware qfp active interface if-name <Interface-name> statistics

show platform hardware qfp active infrastructure punt statistics type per-cause | exclude _0_
show platform hardware qfp active infrastructure punt statistics type punt-drop | exclude _0_
show platform hardware qfp active infrastructure punt statistics type inject-drop  | exclude _0_
show platform hardware qfp active infrastructure punt statistics type global-drop | exclude _0_
show platform hardware qfp active infrastructure bqs queue output default all
show platform hardware qfp active infrastructure bqs queue output recycle all

!--- The if-name option requires full interface-name
RP
show platform hardware slot {r0|r1} serdes statistics
show platform software infrastructure lsmpi
SPA Counter
Use a generic packet drop troubleshooting for the SPA as well as other platforms. The clear counters command is useful to find the difference of a counter.
In order to display statistics for all interfaces configured on the router, use this command:
Router#show interfaces TenGigabitEthernet 1/0/0
TenGigabitEthernet1/0/0 is up, line protocol is up
  Hardware is SPA-1X10GE-L-V2, address is 0022.5516.2040 (bia 0022.5516.2040)
  Internet address is 192.168.1.1/24
  MTU 1500 bytes, BW 10000000 Kbit, DLY 10 usec,
     reliability 255/255, txload 1/255, rxload 1/255
  Encapsulation ARPA, loopback not set
  Keepalive not supported
  Full Duplex, 10000Mbps, link type is force-up, media type is 10GBase-LR
  output flow-control is on, input flow-control is on
  ARP type: ARPA, ARP Timeout 04:00:00
  Last input 00:00:59, output 00:00:46, output hang never
  Last clearing of "show interface" counters never
  Input queue: 0/375/415441/0 (size/max/drops/flushes); Total output drops: 0
  Queueing strategy: fifo
  Output queue: 0/40 (size/max)
  5 minute input rate 0 bits/sec, 0 packets/sec
  5 minute output rate 0 bits/sec, 0 packets/sec
     510252 packets input, 763315452 bytes, 0 no buffer
     Received 3 broadcasts (0 IP multicasts)
     0 runts, 0 giants, 0 throttles
     0 input errors, 0 CRC, 0 frame, 0 overrun, 0 ignored
     0 watchdog, 0 multicast, 0 pause input
     55055 packets output, 62118229 bytes, 0 underruns
     0 output errors, 0 collisions, 2 interface resets
     0 babbles, 0 late collision, 0 deferred
     0 lost carrier, 0 no carrier, 0 pause output
     0 output buffer failures, 0 output buffers swapped out
In order to display statistics of packets that are according to protocol, use this command:
Router#show interfaces TenGigabitEthernet 1/0/0 accounting
TenGigabitEthernet1/0/0
                Protocol    Pkts In   Chars In   Pkts Out  Chars Out
                   Other         15        900      17979    6652533
                      IP     510237  763314552      37076   55465696
                 DEC MOP          0          0       1633     125741
                     ARP         15        900         20       1200
                     CDP          0          0      16326    6525592
In order to display statistics of packets that were process switched, fast switched, or distributed switched, use this command:
Router#show interfaces TenGigabitEthernet 1/0/0 stats
TenGigabitEthernet1/0/0
          Switching path    Pkts In   Chars In   Pkts Out  Chars Out
               Processor         15        900      17979    6652533
             Route cache          0          0          0          0
       Distributed cache     510252  763315452      55055   62118229
                   Total     510267  763316352      73034   68770762
SIP Counter
The Cisco ASR 1000 Series SIP does not participate in packet forwarding. It houses the SPAs in the system. The SIP provides packet prioritization for ingress packets from the SPAs and a large ingress burst absorption buffer for ingress packets that await transfer to the ESP to be processed. The egress buffering is centralized on the traffic manager and also provided in the form of egress queues on the SIP. The Cisco ASR 1000 Series Routers can prioritize traffic, not only at the ESP level, but also throughout the system by configuring ingress and egress classification. Buffering (ingress and egress) coupled with back pressure to and from the ESP is provided in the system to deal with oversubscription.
Figure 3 Cisco ASR 1000 Series Router Ingress Queues
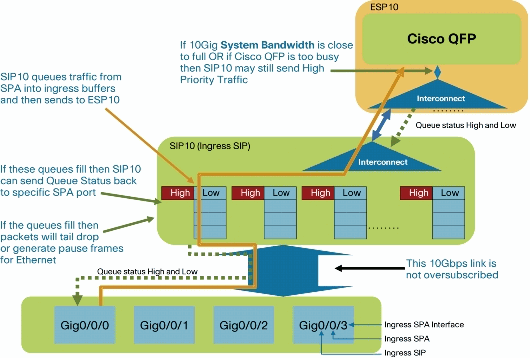
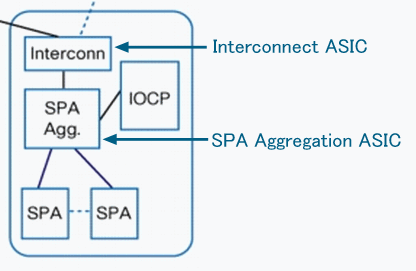
Figure 4 Block Diagram of the SIP
In order to display per port queue drop counters on SPA Aggregation ASIC, use this command:
Router#show platform hardware port 1/0/0 plim statistics
Interface 1/0/0
  RX Low Priority
    RX Drop Pkts 0           Bytes 0
    RX Err  Pkts 0           Bytes 0
  TX Low Priority
    TX Drop Pkts 0           Bytes 0
  RX High Priority
    RX Drop Pkts 0           Bytes 0
    RX Err  Pkts 0           Bytes 0
  TX High Priority
    TX Drop Pkts 0           Bytes 0
In order to display per SPA counters on SPA Aggregation ASIC, use this command:
Router#show platform hardware subslot 1/0 plim statistics
1/0, SPA-1XTENGE-XFP-V2, Online
  RX Pkts 510252      Bytes 763315452
  TX Pkts 55078       Bytes 62126783
  RX IPC Pkts 0           Bytes 0
  TX IPC Pkts 0           Bytes 0
In order to display all SPA counters on SPA Aggregation ASIC, use this command:
Router#show platform hardware slot 1 plim statistics
1/0, SPA-1XTENGE-XFP-V2, Online
  RX Pkts 510252      Bytes 763315452
  TX Pkts 55078       Bytes 62126783
  RX IPC Pkts 0           Bytes 0
  TX IPC Pkts 0           Bytes 0

1/1, SPA-5X1GE-V2, Online
  RX Pkts 42          Bytes 2520
  TX Pkts 65352       Bytes 31454689
  RX IPC Pkts 0           Bytes 0
  TX IPC Pkts 0           Bytes 0

1/2, Empty

1/3, Empty
In order to display aggregated rx/tx counters to/from Interconnect ASIC on SPA Aggregation ASIC, use this command. Rx counter means the input packet from SPA; the Tx counter means output packet to SPA.
Router#show platform hardware slot 1 plim status internal
FCM Status
  XON/XOFF 0x0000000F00000000
ECC Status
Data Path Config
  MaxBurst1 256, MaxBurst2 128, DataMaxT 32768
  Cal Length RX 0x0002, TX 0x0002
  Repetitions RX 0x0010, TX 0x0010
Data Path Status
  RX in sync, TX in sync
  Spi4 Channel 0, Rx Channel Status Starving, Tx Channel Status Starving
  Spi4 Channel 1, Rx Channel Status Starving, Tx Channel Status Starving
  RX Pkts 510294      Bytes 765359148
  TX Pkts 120430      Bytes 94063192
Hypertransport Status
  RX Pkts 0           Bytes 0
  TX Pkts 0           Bytes 0
In order to display rx counters from ESP Interconnect ASIC on SIP Interconnect ASIC, use this command:
Router#show platform hardware slot 1 serdes statistics
From Slot F0
  Pkts  High: 0          Low: 120435     Bad: 0          Dropped: 0
  Bytes High: 0          Low: 94065235   Bad: 0          Dropped: 0
  Pkts  Looped: 0          Error: 0
  Bytes Looped 0
  Qstat count: 0          Flow ctrl count: 196099
ESP Counter
The ESP provides the centralized forwarding engine responsible for most of the data-plane processing tasks. All network traffic through the Cisco ASR 1000 Series Router flows through the ESP.
Figure 5 Block Diagram of the ESP
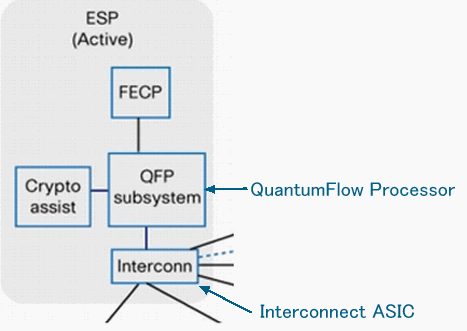
Figure 6 Cisco QuantumFlow Processor Basic Architecture
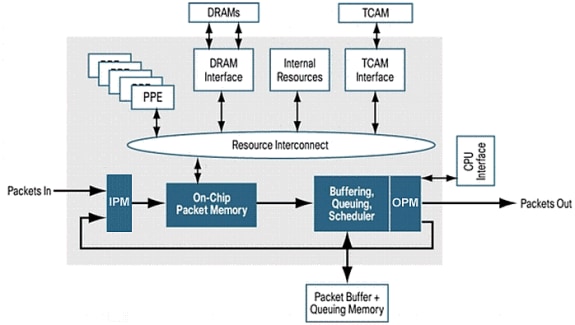
Refer to Cisco 1000 Series Aggregation Services Routers for more information.
In order to display rx counters from RP, SIP Interconnect ASIC on ESP Interconnect ASIC, use this command:
Router#show platform hardware slot F0 serdes statistics
From Slot R0
  Pkts  High: 70328      Low: 13223      Bad: 0          Dropped: 0
  Bytes High: 31049950   Low: 10062155   Bad: 0          Dropped: 0
  Pkts  Looped: 0          Error: 0
  Bytes Looped 0
  Qstat count: 0          Flow ctrl count: 311097
From Slot 2

<snip>
In order to display internal link packet counters and error counters, use this command:
Router#show platform hardware slot F0 serdes statistics internal
Network-Processor Link:
  Local TX in sync, Local RX in sync
  From Network-Processor    Packets:      421655  Bytes:   645807536
  To Network-Processor      Packets:       83551  Bytes:    41112105

RP/ESP Link:
  Local TX in sync, Local RX in sync
  Remote TX in sync, Remote RX in sync
  To RP/ESP                 Packets:      421650  Bytes:   645807296
    Drops                   Packets:           0  Bytes:           0
  From RP/ESP               Packets:       83551  Bytes:    41112105
    Drops                   Packets:           0  Bytes:           0

<snip>
In order to check mapping for the Input Packet Module (IPM) channel and other components, use this command:
Router#show platform hardware qfp active bqs 0 ipm mapping
BQS IPM Channel Mapping

Chan   Name                Interface      Port     CFIFO

 1     CC3 Low             SPI1           0        1
 2     CC3 Hi              SPI1           1        0
 3     CC2 Low             SPI1           2        1

<snip>
In order to display statistical information for each channel in Input Packet Module (IPM), use this command:
Router#show platform hardware qfp active bqs 0 ipm statistics channel all
BQS IPM Channel Statistics

Chan   GoodPkts  GoodBytes    BadPkts   BadBytes

 1 - 0000000000 0000000000 0000000000 0000000000
 2 - 0000000000 0000000000 0000000000 0000000000
 3 - 0000000000 0000000000 0000000000 0000000000

<snip>
In order to check mapping for the Output Packet Module (OPM) channel and other components, use this command:
Router#show platform hardware qfp active bqs 0 opm mapping
BQS OPM Channel Mapping

Chan     Name                          Interface      LogicalChannel

 0       CC3 Low                       SPI1            0
 1       CC3 Hi                        SPI1            1
 2       CC2 Low                       SPI1            2

<snip>
In order to display statistical information for each channel in Output Packet Module (OPM), use this command:
Router#show platform hardware qfp active bqs 0 opm statistics channel all
BQS OPM Channel Statistics

Chan   GoodPkts  GoodBytes    BadPkts   BadBytes

 0 - 0000000000 0000000000 0000000000 0000000000
 1 - 0000000000 0000000000 0000000000 0000000000
 2 - 0000000000 0000000000 0000000000 0000000000

<snip>
In order to display statistics of drops for all interfaces in Packet Processor Engine (PPE), use this command.
Note: This command is helpful when used to troubleshoot issues.
Router#show platform hardware qfp active statistics drop
----------------------------------------------------------------
Global Drop Stats                         Octets         Packets
----------------------------------------------------------------
  AttnInvalidSpid                            0               0
  BadDistFifo                                0               0
  BadIpChecksum                              0               0

<snip>
In order to clear statistics of drops for all interfaces in Packet Processor Engine (PPE), use this command. This command is cleared after it displays a counter.
Router#show platform hardware qfp active statistics drop clear
----------------------------------------------------------------
Global Drop Stats                         Octets         Packets
----------------------------------------------------------------
  AttnInvalidSpid                            0               0
  BadDistFifo                                0               0
  BadIpChecksum                              0               0

<snip>
In order to display statistics of drops for each interface in the Packet Processor Engine (PPE), use this command. This counter is cleared every 10 seconds.
Router#show platform hardware qfp active interface if-name TenGigabitEthernet1/0/0 statistics

Platform Handle 6
----------------------------------------------------------------
Receive Stats                             Octets         Packets
----------------------------------------------------------------
  Ipv4                                       0               0
  Ipv6                                       0               0

<snip>


!--- The if-name option requires full interface-name
In order to check cause of packet punted to RP, use this command:
Router#show platform hardware qfp active infrastructure punt statistics type per-cause
Global Per Cause Statistics

  Number of punt causes =   46

  Per Punt Cause Statistics
                                                Packets       Packets
  Counter ID  Punt Cause Name                   Received      Transmitted
  ------------------------------------------------------------------------
  00          RESERVED                          0             0
  01          MPLS_FRAG_REQUIRE                 0             0
  02          IPV4_OPTIONS                      0             0

<snip>
In order to display the statistics of drops for punt packets (ESP to RP), use this command:
Router#show platform hardware qfp active infrastructure punt statistics type punt-drop
Punt Drop Statistics


  Drop Counter ID   0     Drop Counter Name PUNT_NOT_ENABLED_BY_DATA_PLANE

  Counter ID  Punt Cause Name                   Packets
  ----------------------------------------------------------
  00          RESERVED                          0
  01          MPLS_FRAG_REQUIRE                 0
  02          IPV4_OPTIONS                      0

<snip>
In order to display the statistics of drops for inject packets (RP to ESP), use this command. Inject packets are sent from the RP to the ESP. Most of them are generated by IOSD. They are L2 keep alives, routing protocols, management protocols like SNMP, and so on.
Router#show platform hardware qfp active infrastructure punt statistics type inject-drop
Inject Drop Statistics


  Drop Counter ID   0     Drop Counter Name INJECT_NOT_ENABLED_BY_DATA_PLANE

  Counter ID  Inject Cause Name                    Packets
  -------------------------------------------------------------
  00          RESERVED                             0
  01          L2 control/legacy                    0
  02          CPP destination lookup               0

<snip>
In order to display the statistics of global drops packets, use this command:
Router#show platform hardware qfp active infrastructure punt statistics type global-drop
Global Drop Statistics


  Counter ID  Drop Counter Name                         Packets
  ------------------------------------------------------------------
  00          INVALID_COUNTER_SELECTED                  0
  01          INIT_PUNT_INVALID_PUNT_MODE               0
  02          INIT_PUNT_INVALID_PUNT_CAUSE              0

<snip>
In order to display statistics of default queues/schedules of Buffering, Queuing, and Scheduling (BQS) for each interface, use this command:
Router#show platform hardware qfp active infrastructure bqs queue output default all
Interface: internal0/0/rp:0, QFP if_h: 1, Num Queues/Schedules: 2
  Queue specifics:
    Index 0 (Queue ID:0x2f, Name: )
      Software Control Info:
        (cache) queue id: 0x0000002f, wred: 0x88b002d2, qlimit (bytes): 6250048
        parent_sid: 0x232, debug_name:
        sw_flags: 0x00000011, sw_state: 0x00000001
        orig_min  : 0                   ,      min: 0
        orig_max  : 0                   ,      max: 0
        share     : 1
      Statistics:
        tail drops (bytes): 77225016            ,          (packets): 51621
        total enqs (bytes): 630623840           ,          (packets): 421540
        queue_depth (bytes): 0

<snip>
In order to display statistics of Recycle queues/schedules of Buffering, Queuing, and Scheduling (BQS) for each interface, use this command. Recycle queues hold packets that are processed more than once by QFP. For example, fragment packets and multicast packets are placed here.
Router#show platform hardware qfp active infrastructure bqs queue output recycle all
Recycle Queue Object ID:0x3  Name:MulticastLeafHigh   (Parent Object ID: 0x2)
  plevel: 1, bandwidth: 0                   , rate_type: 0
  queue_mode: 0, queue_limit: 0, num_queues: 36
  Queue specifics:
    Index 0 (Queue ID:0x2, Name: MulticastLeafHigh)
      Software Control Info:
        (cache) queue id: 0x00000002, wred: 0x88b00000, qlimit (packets): 2048
        parent_sid: 0x208, debug_name: MulticastLeafHigh
        sw_flags: 0x00010001, sw_state: 0x00000001
        orig_min  : 0                   ,      min: 0
        orig_max  : 0                   ,      max: 0
        share     : 0
      Statistics:
        tail drops (bytes): 0                   ,          (packets): 0
        total enqs (bytes): 0                   ,          (packets): 0
        queue_depth (packets): 0

<snip>
RP Counter
The RP processes these types of traffic:
-
Management traffic that comes through the gigabit Ethernet management port on the route processor.
-
Punt traffic in the system (through the ESP), which includes all control-plane traffic received on any SPA.
-
Older protocol traffic, DECnet, Internet Packet Exchange (IPX), and so on.
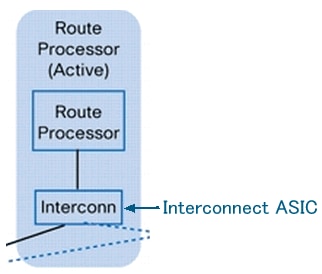
Figure 7 Block Diagram of the RP
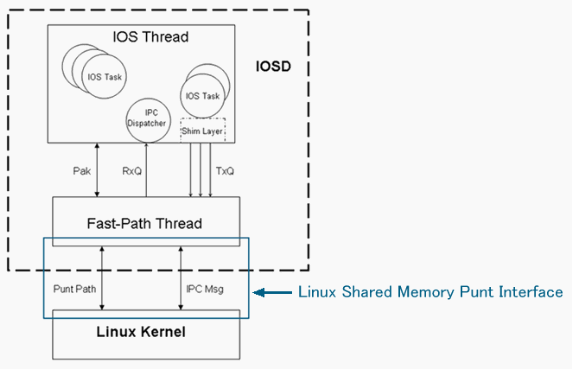
This is the Punt/Inject path of the Cisco ASR 1000 Series Router:
QFP<==>RP Kernel<==>LSMPI<==>Fast-Path Thread<==>Cisco IOS Thread
Figure 8 Location of Linux Shared Memory Punt Interface (LSMPI)
In order to display rx counters from ESP Interconnect ASIC on RP Interconnect ASIC, use this command:
Router#show platform hardware slot r0 serdes statistics
From Slot F0
  Pkts  High: 57         Low: 421540     Bad: 0          Dropped: 0
  Bytes High: 5472       Low: 645799280  Bad: 0          Dropped: 0
  Pkts  Looped: 0          Error: 0
  Bytes Looped 0
  Qstat count: 0          Flow ctrl count: 196207
In order to display the statistics for the Linux Shared Memory Punt Interface (LSMPI) on the router, use this command. LSMPI offers a way to do zero-copy transfer of packets between the network and IOSd for high performance. In order to achieve this, share (memory map) a region in the Linux kernel virtual memory between the LSMPI module and IOSd.
Router#show platform software infrastructure lsmpi
LSMPI interface internal stats:
enabled=0, disabled=0, throttled=0, unthrottled=0, state is ready
Input Buffers = 8772684
Output Buffers = 206519
rxdone count = 8772684
txdone count = 206515

<snip>

ASR1000-RP Punt packet causes:
      421540 IPV4_OPTIONS packets
     7085686 L2 control/legacy packets
          57 ARP packets
         774 FOR_US packets
Packet histogram(500 bytes/bin), avg size in 172, out 471:
 Pak-Size      In-Count        Out-Count
      0+:       7086514            95568
    500+:             1                0
   1000+:             2                0
   1500+:        421540             6099

Lsmpi0 is up, line protocol is up
  Hardware is LSMPI
  MTU 1500 bytes, BW 1000000 Kbit, DLY 10 usec,
     reliability 255/255, txload 1/255, rxload 1/255
  Encapsulation ARPA, loopback not set
  Keepalive not set
  Unknown, Unknown, media type is unknown media type

<snip>

     7508057 packets input, 0 bytes, 0 no buffer
     Received 0 broadcasts (0 IP multicasts)
     0 runts, 0 giants, 0 throttles
     0 input errors, 0 CRC, 0 frame, 0 overrun, 0 ignored, 0 abort
     0 watchdog, 0 multicast, 0 pause input
     101667 packets output, 47950080 bytes, 0 underruns
     0 output errors, 0 collisions, 0 interface resets
     0 output buffer failures, 0 output buffers swapped out
Case Study
Packet Drops on SPA
Error Packet
If a packet has an error, these packets are dropped on SPA. This is common behavior, not only on Cisco ASR 1000 Series Routers, but on all platforms.
Router#show interfaces TenGigabitEthernet 1/0/0

TenGigabitEthernet1/0/0 is up, line protocol is up
  Hardware is SPA-1X10GE-L-V2, address is 0022.5516.2040 (bia 0022.5516.2040)
  Internet address is 192.168.1.1/24
  MTU 1500 bytes, BW 10000000 Kbit, DLY 10 usec,
     reliability 250/255, txload 1/255, rxload 1/255
  Encapsulation ARPA, loopback not set
  Keepalive not supported
  Full Duplex, 10000Mbps, link type is force-up, media type is 10GBase-LR
  output flow-control is on, input flow-control is on
  ARP type: ARPA, ARP Timeout 04:00:00
  Last input 00:45:13, output 00:00:08, output hang never
  Last clearing of "show interface" counters 00:00:26
  Input queue: 0/375/0/0 (size/max/drops/flushes); Total output drops: 0
  Queueing strategy: fifo
  Output queue: 0/40 (size/max)
  5 minute input rate 0 bits/sec, 0 packets/sec
  5 minute output rate 0 bits/sec, 0 packets/sec
     0 packets input, 0 bytes, 0 no buffer
     Received 0 broadcasts (0 IP multicasts)
     0 runts, 0 giants, 0 throttles
     419050 input errors, 419050 CRC, 0 frame, 0 overrun, 0 ignored
     0 watchdog, 0 multicast, 0 pause input
     1 packets output, 402 bytes, 0 underruns
     0 output errors, 0 collisions, 0 interface resets
     0 babbles, 0 late collision, 0 deferred
     0 lost carrier, 0 no carrier, 0 pause output
     0 output buffer failures, 0 output buffers swapped out
Packet Drops on SIP
High Utilization of QFP
In case of high utilization of QFP, packets are dropped in each interface queue on SIP by backpressure from QFP. In this case, a pause frame is also sent from the interface.
Router#show platform hardware port 1/0/0 plim statistics
Interface 1/0/0
  RX Low Priority
    RX Drop Pkts 21344279    Bytes 1515446578
    RX Err  Pkts 0           Bytes 0
  TX Low Priority
    TX Drop Pkts 0           Bytes 0
  RX High Priority
    RX Drop Pkts 0           Bytes 0
    RX Err  Pkts 0           Bytes 0
  TX High Priority
    TX Drop Pkts 0           Bytes 0
Packet Drops on ESP
Oversubscription
If you send packets that exceed the wire rate of the interface, the packets are dropped at the egress interface.
Router#show interfaces GigabitEthernet 1/1/0

GigabitEthernet1/1/0 is up, line protocol is up
  Hardware is SPA-5X1GE-V2, address is 0021.55dc.3f50 (bia 0021.55dc.3f50)
  Internet address is 192.168.2.1/24
  MTU 1500 bytes, BW 1000000 Kbit, DLY 10 usec,
     reliability 255/255, txload 35/255, rxload 1/255
  Encapsulation ARPA, loopback not set
  Keepalive not supported
  Full Duplex, 1000Mbps, link type is auto, media type is SX
  output flow-control is on, input flow-control is on
  ARP type: ARPA, ARP Timeout 04:00:00
  Last input 02:24:23, output 00:00:55, output hang never
  Last clearing of "show interface" counters 00:01:04
  Input queue: 0/375/0/0 (size/max/drops/flushes); Total output drops: 48783
...
On QFP, these drops can be checked as Taildrop.
Router#show platform hardware qfp active statistics drop | exclude _0_
----------------------------------------------------------------
Global Drop Stats                         Octets         Packets
----------------------------------------------------------------
  TailDrop                            72374984           483790
Overload by Packet Fragment
If packets are fragmented due to the MTU size, even if the ingress interface is less than the wire rate, wire rate can be exceeded at the egress interface. In this case, the packet is dropped at the egress interface.
Router#show interfaces gigabitEthernet 1/1/0

GigabitEthernet1/1/0 is up, line protocol is up
  Hardware is SPA-5X1GE-V2, address is 0022.5516.2050 (bia 0022.5516.2050)
  Internet address is 192.168.2.1/24
  MTU 1500 bytes, BW 1000000 Kbit, DLY 10 usec,
     reliability 255/255, txload 25/255, rxload 1/255
  Encapsulation ARPA, loopback not set
  Keepalive not supported
  Full Duplex, 1000Mbps, link type is auto, media type is SX
  output flow-control is on, input flow-control is on
  ARP type: ARPA, ARP Timeout 04:00:00
  Last input 00:36:52, output 00:00:12, output hang never
  Last clearing of "show interface" counters 00:00:55
  Input queue: 0/375/0/0 (size/max/drops/flushes); Total output drops: 272828
  Queueing strategy: fifo
  Output queue: 0/40 (size/max)
  5 minute input rate 0 bits/sec, 0 packets/sec
  5 minute output rate 99998000 bits/sec, 14290 packets/sec
     0 packets input, 0 bytes, 0 no buffer
     Received 0 broadcasts (0 IP multicasts)
     0 runts, 0 giants, 0 throttles
     0 input errors, 0 CRC, 0 frame, 0 overrun, 0 ignored
     0 watchdog, 0 multicast, 0 pause input
     4531543 packets output, 4009748196 bytes, 0 underruns
On QFP, these drops can be checked as Taildrop.
Router#show platform hardware qfp active statistics drop | exclude _0_
----------------------------------------------------------------
Global Drop Stats                         Octets         Packets
----------------------------------------------------------------
  TailDrop                           109431162          272769
Performance Limit by Fragment Packets
In QFP, Global Packet Memory (GPM) is used for reassembly for the fragmented packet. If GPM runs out in the reassembly of large numbers of fragmentation packets, these counters show the number of packet drops. In many cases, this is a performance limit.
Router#show platform hardware qfp active statistics drop | ex _0_
----------------------------------------------------------------
Global Drop Stats                         Octets         Packets
----------------------------------------------------------------
  ReassNoFragInfo                  39280654854        57344096
  ReassTimeout                          124672             128
Forwarding to Null0 Interface
The packets to Null0 interface are dropped on ESP and not punted to RP. In such a case, possibly you are not unable to check the counter by the traditional command (show interfaces null0). Check the ESP counter, in order to know the number of packet drops. If the clear and exclude _0_ options are used at the same time, you can check only new drop packets.
Router#show platform hardware qfp active statistics drop clear | ex _0_
----------------------------------------------------------------
Global Drop Stats                         Octets         Packets
----------------------------------------------------------------
  Ipv4Null0                              11286              99
RP Switchover with HA Nonsupport Feature
In the case of RP switch over, these packets are dropped until the new active RP reprograms the QFP:
-
All packets are dropped if the new active RP was not synced with the old active RP before the switch over.
-
Packets are processed by High Availability (HA) nonsupport features.
Router#show platform hardware qfp active statistics drop | ex _0_
----------------------------------------------------------------
Global Drop Stats                         Octets         Packets
----------------------------------------------------------------
  Ipv4NoAdj                            6993660          116561
  Ipv4NoRoute                        338660188         5644337
Punt Packets
On the Cisco ASR 1000 Series Routers, packets that cannot be handled by ESP are punted to RP. If there are too many punt packets, the TailDrop of QFP drop statistics increases.
Router#show platform hardware qfp active statistics drop | ex _0_
----------------------------------------------------------------
Global Drop Stats                         Octets         Packets
----------------------------------------------------------------
  TailDrop                            26257792           17552
Check the Buffering, Queuing, and Scheduling (BQS) queue output counter in order to specify the dropped interface. The “internal0/0/rp:0” shows the interface to punt from ESP to RP.
Router#show platform hardware qfp active infrastructure bqs queue output default all
Interface: internal0/0/rp:0, QFP if_h: 1, Num Queues/Schedules: 2
  Queue specifics:
    Index 0 (Queue ID:0x2f, Name: )
      Software Control Info:
        (cache) queue id: 0x0000002f, wred: 0x88b002d2, qlimit (bytes): 6250048
        parent_sid: 0x232, debug_name:
        sw_flags: 0x00000011, sw_state: 0x00000001
        orig_min  : 0                   ,      min: 0
        orig_max  : 0                   ,      max: 0
        share     : 1
      Statistics:
        tail drops (bytes): 26257792            ,          (packets): 17552
        total enqs (bytes): 4433777480          ,          (packets): 2963755
        queue_depth (bytes): 0
  Queue specifics:
...
In such a case, the Input queue drop is counted on the ingress interface.
Router#show interfaces TenGigabitEthernet 1/0/0

TenGigabitEthernet1/0/0 is up, line protocol is up
  Hardware is SPA-1X10GE-L-V2, address is 0022.5516.2040 (bia 0022.5516.2040)
  Internet address is 192.168.1.1/24
  MTU 1500 bytes, BW 10000000 Kbit, DLY 10 usec,
     reliability 255/255, txload 1/255, rxload 1/255
  Encapsulation ARPA, loopback not set
  Keepalive not supported
  Full Duplex, 10000Mbps, link type is force-up, media type is 10GBase-LR
  output flow-control is on, input flow-control is on
  ARP type: ARPA, ARP Timeout 04:00:00
  Last input 00:15:10, output 00:00:30, output hang never
  Last clearing of "show interface" counters 00:14:28
  Input queue: 0/375/2438309/0 (size/max/drops/flushes); Total output drops: 0
  Queueing strategy: fifo
  Output queue: 0/40 (size/max)
  5 minute input rate 70886000 bits/sec, 5915 packets/sec
  5 minute output rate 0 bits/sec, 0 packets/sec
     2981307 packets input, 4460035272 bytes, 0 no buffer
     Received 0 broadcasts (0 IP multicasts)
     0 runts, 0 giants, 0 throttles
     0 input errors, 0 CRC, 0 frame, 0 overrun, 0 ignored
     0 watchdog, 0 multicast, 0 pause input
     15 packets output, 5705 bytes, 0 underruns
     0 output errors, 0 collisions, 0 interface resets
     0 babbles, 0 late collision, 0 deferred
     0 lost carrier, 0 no carrier, 0 pause output
     0 output buffer failures, 0 output buffers swapped out
The reason for the punt can be shown by this command:
Router#show platform hardware qfp active infrastructure punt statistics type per-cause
Global Per Cause Statistics

  Number of punt causes =   46

  Per Punt Cause Statistics
                                                Packets       Packets
  Counter ID  Punt Cause Name                   Received      Transmitted
  ------------------------------------------------------------------------
  00          RESERVED                          0             0
  01          MPLS_FRAG_REQUIRE                 0             0
  02          IPV4_OPTIONS                      2981307       2963755
...
You can also check the show ip traffic command.
Router#show ip traffic
IP statistics:
  Rcvd:  2981307 total, 15 local destination
         0 format errors, 0 checksum errors, 0 bad hop count
         0 unknown protocol, 0 not a gateway
         0 security failures, 0 bad options, 2981307 with options
  Opts:  2981307 end, 0 nop, 0 basic security, 0 loose source route
         0 timestamp, 0 extended security, 0 record route
         0 stream ID, 2981307 strict source route, 0 alert, 0 cipso, 0 ump
         0 other, 0 ignored
  Frags: 0 reassembled, 0 timeouts, 0 couldn't reassemble
         0 fragmented, 0 fragments, 0 couldn't fragment
  Bcast: 0 received, 0 sent
  Mcast: 0 received, 0 sent
  Sent:  23 generated, 525450 forwarded
  Drop:  0 encapsulation failed, 0 unresolved, 0 no adjacency
         0 no route, 0 unicast RPF, 0 forced drop, 0 unsupported-addr
         0 options denied, 0 source IP address zero
...
Punt Limit by Punt Global Policer
In case too many punt packets are destined to the router itself, the Taildrop counts with PuntGlobalPolicerDrops by the QFP drop counter. The Punt Global Policer protects RP from an overload. These drops are seen not by the transit packet but by the FOR_US packet.
Router#show platform hardware qfp active statistics drop | ex _0_
----------------------------------------------------------------
Global Drop Stats                         Octets         Packets
----------------------------------------------------------------
  PuntGlobalPolicerDrops                155856             102
  TailDrop                          4141792688         2768579
...
The reason for the punt can be known by this command:
Router#show platform hardware qfp active infrastructure punt statistics type per-cause
Global Per Cause Statistics

  Number of punt causes =   46

  Per Punt Cause Statistics
                                                Packets       Packets
  Counter ID  Punt Cause Name                   Received      Transmitted
  ------------------------------------------------------------------------
  00          RESERVED                          0             0
  01          MPLS_FRAG_REQUIRE                 0             0
  02          IPV4_OPTIONS                      0             0
  03          L2 control/legacy                 0             0
  04          PPP_CONTROL                       0             0
  05          CLNS_CONTROL                      0             0
  06          HDLC_KEEPALIVE                    0             0
  07          ARP                               3             3
  08          REVERSE_ARP                       0             0
  09          LMI_CONTROL                       0             0
  10          incomplete adjacency punt         0             0
  11          FOR_US                            5197865       2428755
Packet Drops on RP
Packet Errors on LSMPI
On the Cisco ASR 1000 Series Routers, the packet is punted from ESP to RP through the Linux Shared Memory Punt Interface (LSMPI). LSMPI is the virtual interface for the packet transfer between the IOSd and Linux kernel on RP through the Linux shared memory. Packets punted from the ESP to the RP are received by the Linux kernel of the RP. The Linux kernel sends those packets to the IOSD process through LSMPI. If you see error counters up on the LSMPI, this is a software defect. Open a TAC case.
Router#show platform software infrastructure lsmpi

<snip>

  Lsmpi0 is up, line protocol is up
  Hardware is LSMPI
  MTU 1500 bytes, BW 1000000 Kbit, DLY 10 usec,
     reliability 255/255, txload 1/255, rxload 1/255
  Encapsulation ARPA, loopback not set
  Keepalive not set
  Unknown, Unknown, media type is unknown media type
  output flow-control is unsupported, input flow-control is unsupported
  ARP type: ARPA, ARP Timeout 04:00:00
  Last input never, output never, output hang never
  Last clearing of "show interface" counters never
  Input queue: 0/1500/0/0 (size/max/drops/flushes); Total output drops: 0
  Queueing strategy: fifo
  Output queue: 0/40 (size/max)
  5 minute input rate 0 bits/sec, 0 packets/sec
  5 minute output rate 0 bits/sec, 0 packets/sec
     15643 packets input, 0 bytes, 0 no buffer
     Received 0 broadcasts (0 IP multicasts)
     0 runts, 0 giants, 0 throttles
     1 input errors, 0 CRC, 3 frame, 0 overrun, 0 ignored, 0 abort
     0 watchdog, 0 multicast, 0 pause input
     295 packets output, 120491 bytes, 0 underruns
     0 output errors, 0 collisions, 0 interface resets
     0 output buffer failures, 0 output buffers swapped out
Related Information
Revision History
| Revision | Publish Date | Comments |
|---|---|---|
3.0 |
07-Nov-2024
|
Recertification |
1.0 |
06-Jul-2009
|
Initial Release |
Contributed by Cisco Engineers
- tahiranoykanme
 Feedback
Contact Cisco
- Open a Support Case

- (Requires a Cisco Service Contract)