-
Cisco CallManager Serviceability Administration Guide, Release 3.2
-
Index
-
Preface
-
Introduction
-
Alarm Configuration
-
Alarm Definitions
-
Alarm Information
-
Trace Configuration
-
Trace Collection Configuration
-
Trace Analysis Configuration
-
Q.931 Translator
-
Control Center
-
Real-Time Monitoring Configuration
-
CDR Analysis and Reporting
-
CAR System Configuration
-
CAR Report Configuration
-
CAR User Reports Configuration
-
CAR System Reports Configuration
-
CAR Device Reports Configuration
-
CDR Search Configuration
-
Microsoft Performance
-
Bulk Trace Analysis
-
Overview of CiscoWorks2000
-
Path Analysis Configuration
-
System Log Management Configuration
-
Cisco Discovery Protocol Support Configuration
-
Cisco Secure Telnet Configuration
-
Show Command Line Interface
-
Simple Network Management Protocol Configuration
-
Understanding CAR Reports
-
 Feedback
Table Of Contents
Trace Collection Configuration
Configuring SDI Trace Collection
Configuring SDL Trace Collection
Trace Collection Configuration
This chapter provides procedural information on using the Serviceability Trace Collection tool.
This chapter contains the following topics:
•
Configuring SDI Trace Collection
•
Cisco CallManager Serviceability provides a web-based trace tool to assist the system administrator and support personnel in troubleshooting Cisco CallManager problems. Trace provides three main functions:
•
•
•
The Trace and Alarm tools work together. You configure trace and alarm settings for Cisco CallManager services. A Cisco TAC engineer receives the results. You can direct alarms to the Microsoft Windows 2000 Event Viewer, CiscoWorks2000 Syslog, system diagnostic interface (SDI) or signal distribution layer (SDL) trace log files, or to all destinations. You can base traces for Cisco CallManager services on debug levels, specific trace fields, and Cisco CallManager devices such as phones or gateways. You can perform a trace on the alarms that are sent to the SDI or SDL trace log files.
Use the Trace Collection tool to collect trace information for any Cisco CallManager service, the time and date of the trace for that service, and the trace type (SDI or SDL) for that service. Trace Collection takes the information that you chose and writes it into a single file. You can display the collected results or download them to a file, which you use to troubleshoot the system.
Note
After configuring trace parameters and running the trace, you can select trace information to collect for analysis. You can base the collection of information on SDL or SDI trace, type of Cisco CallManager service, and time and date of trace. Trace Collection focuses on traces for a specific period.
Configuring SDI Trace Collection
This section describes how to specify the criteria for an SDI trace collection.
Caution
Procedure
Step 1
The Cisco CallManager Serviceability window displays.
Step 2
Step 3
Step 4
Step 5
The service that you chose appears in the Selected Host:Services box.
Note
Step 6
Step 7
Step 8
Step 9
Step 10
Step 11
Step 12
The Reset Form button reloads the Trace Collection window with all the defaults. This action deletes any selection criteria that was previously chosen.
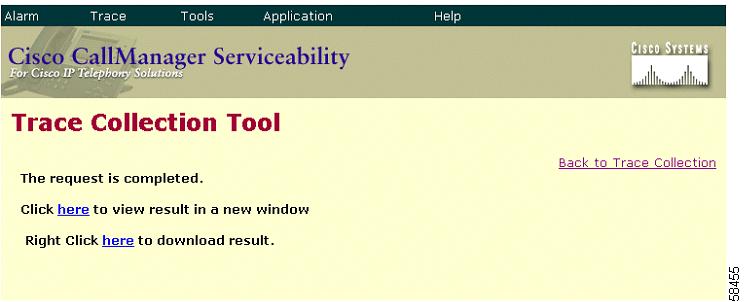
The Trace Collection Request Complete window displays. See Figure 6-1.
Figure 6-1 Trace Collection Results
Step 13
Tip
Step 14
Step 15
Step 16
Note
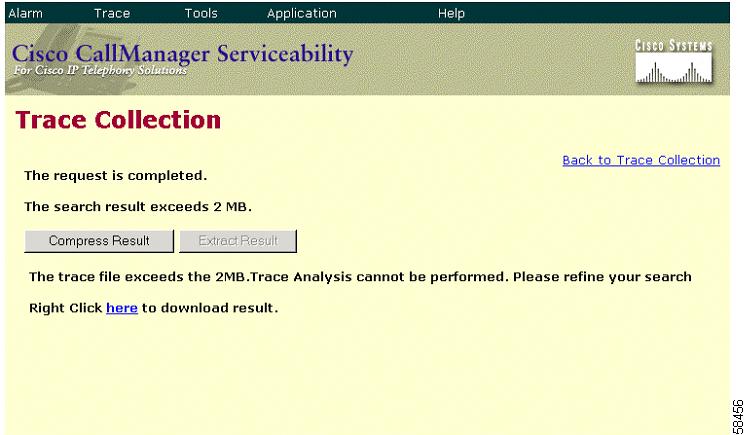
Figure 6-2 Trace Collection Results Exceed 2 MB
Related Topics
•
Configuring SDL Trace Collection
This section describes how to specify criteria for an SDL trace collection.
Caution
Note
Procedure
Step 1
The Cisco CallManager Serviceability window displays.
Step 2
Step 3
Step 4
Step 5
The service that you chose displays in the Selected Host:Services box.
Note
Step 6
Step 7
Step 8
Step 9
Step 10
Step 11
Step 12
The Trace Collection Request Complete window displays. See Figure 6-1.
Step 13
Step 14
Step 15
Step 16
Note
Related Topics
•