-
Cisco CallManager Serviceability Administration Guide, Release 3.2
-
Index
-
Preface
-
Introduction
-
Alarm Configuration
-
Alarm Definitions
-
Alarm Information
-
Trace Configuration
-
Trace Collection Configuration
-
Trace Analysis Configuration
-
Q.931 Translator
-
Control Center
-
Real-Time Monitoring Configuration
-
CDR Analysis and Reporting
-
CAR System Configuration
-
CAR Report Configuration
-
CAR User Reports Configuration
-
CAR System Reports Configuration
-
CAR Device Reports Configuration
-
CDR Search Configuration
-
Microsoft Performance
-
Bulk Trace Analysis
-
Overview of CiscoWorks2000
-
Path Analysis Configuration
-
System Log Management Configuration
-
Cisco Discovery Protocol Support Configuration
-
Cisco Secure Telnet Configuration
-
Show Command Line Interface
-
Simple Network Management Protocol Configuration
-
Understanding CAR Reports
-
 Feedback
Table Of Contents
Real-Time Monitoring Configuration
Viewing Cluster Information in the RTM Window
Viewing Cluster Information Using the CallMgr Info Icon
Changing RTM Configuration Display
Creating Configuration Preferences
Configuring Alert Notification for Heartbeat Monitoring
Configuring Alert Notification for Directory Status
Viewing Alert Icon Information
Configuring Sample Polling Rate
Configuring Performance Counters in Table View/Chart View
Changing Content of Device Monitoring Pane (Re-Select)
Understanding Performance Counters
Configuring Alert Notification for Counter
Removing a Counter From Monitor
Understanding Counter Properties
Displaying a Property Description
Counter Alert Configuration Settings
Understanding Device Monitoring
Viewing Application Information
Viewing Gateway Channel Status
Configuring Alert Notification for Gateway
Configuring Refresh Rate for Gateway
Gateway Configuration Settings
Real-Time Monitoring Configuration
This chapter provides procedural information to configure the Serviceability Real-Time Monitoring (RTM) tool.
The following topics cover the Real-Time Monitoring tool configuration options:
•
Viewing Cluster Information in the RTM Window
•
•
•
•
The following topics cover the Real-Time Monitoring tool performance monitoring configuration information:
•
•
•
•
The following topics cover RTM device status configuration information:
•
•
•
•
•
Loading Real-Time Monitoring
This section describes how to load the Real-Time Monitoring (RTM) tool. The Cisco CallManager Serviceability program lists RTM under the Tools menu item.
Procedure
Step 1
The Cisco CallManager Serviceability window displays.
Step 2
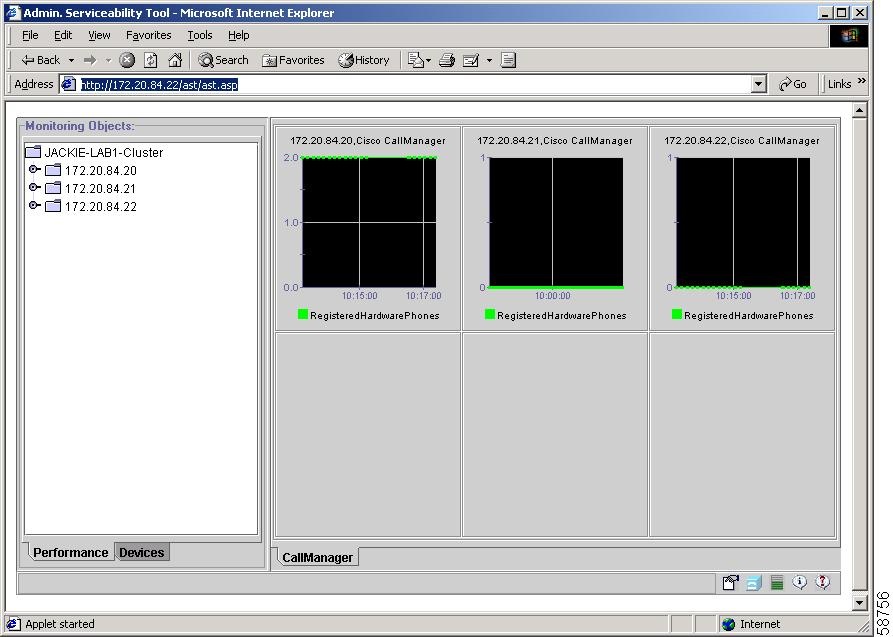
The tool displays. See Figure 10-1.
Step 3
Note
Step 4
Note
The configuration that you chose displays. The cluster information displays in the pane area called Monitoring Objects. Performance and Devices designate the tabs in this pane.
Step 5
Step 6
Related Topics
•
RTM Window Overview
The RTM window comprises the following panes:
•
•
•
Figure 10-1 Real-Time Monitoring Window
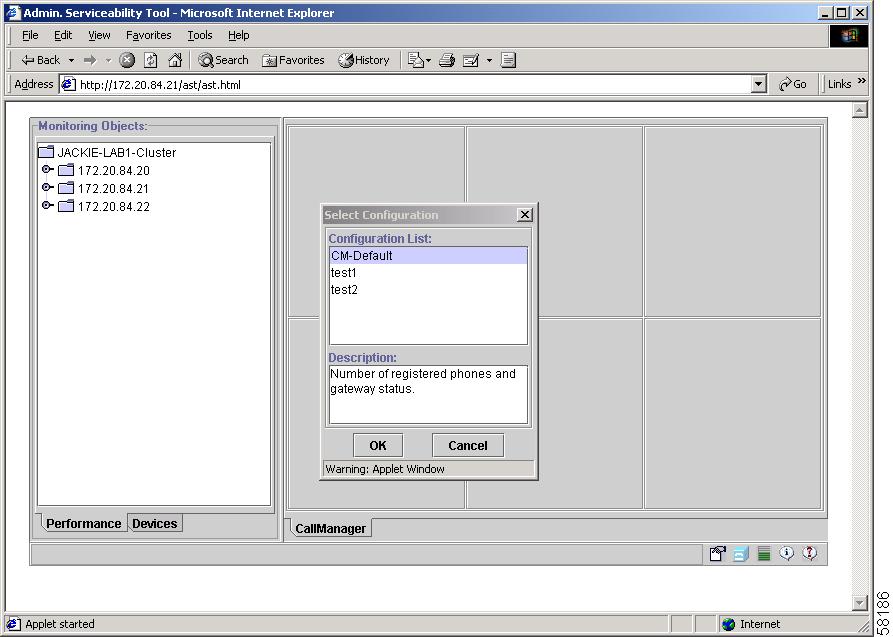
RTM Default Configuration
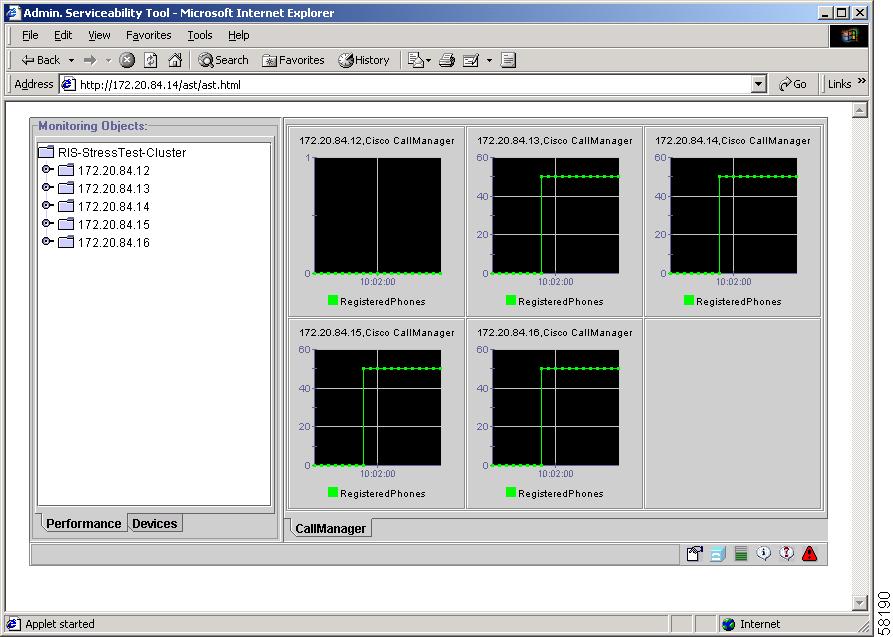
When you initially load RTM, it comes with a default configuration called CM-Default. Dynamically created, CM-Default monitors all registered phones in all the Cisco CallManager nodes. If your cluster has five Cisco CallManager nodes configured, CM-Default displays all the registered phones for each node in the Performance Monitoring pane. See Figure 10-2.
Figure 10-2 RTM Window with CM-Default Configuration
Customizing the RTM Window
You can customize your RTM window to contain any information that you need for troubleshooting purposes. See Using Preferences.
Viewing Cluster Information in the RTM Window
You can easily view server information (such as active calls, registered phones, and memory usage) of the Cisco CallManager cluster. This section describes how to view cluster information from the RTM window.
Procedure
Step 1
A popup menu displays.
Step 2
The CallManager Cluster Information window displays.
Step 3
Step 4
Step 5
Related Topic
•
Viewing Cluster Information Using the CallMgr Info Icon
You can easily view server information (such as active calls, registered phones, and memory usage) of the Cisco CallManager cluster. This section describes how to view cluster information from the CallMgr Info icon on the RTM window status bar.
Procedure
Step 1
The CallManager cluster information window displays.
Step 2
The CallManager cluster information for that server displays.
Step 3
Step 4
Related Topic
•
Using Preferences
The Preferences icon that is located in the Real-Time Monitoring (RTM) window status bar performs the following functions:
•
•
•
The Configuration preference saves the following information:
•
•
•
Viewing Preferences
This section describes how to view the RTM preferences.
Procedure
Step 1
The Preferences window displays.
Step 2
Step 3
Step 4
Related Topics
•
•
•
•
Changing RTM Configuration Display
This section describes how to change the displayed RTM configuration.
Procedure
Step 1
The Preferences window displays.
Step 2
The Configuration List displays the configuration options.
Step 3
Step 4
Related Topics
•
•
•
Creating Configuration Preferences
You can create custom RTM windows to aid you in troubleshooting system problems. The customized window may display device or performance monitoring windows, alert notifications for counters and gateway ports, or multiple categories containing various information. See the following sections to create windows, alerts, or categories:
•
•
•
After you have customized your RTM window to contain the specific information that you need for troubleshooting, you can save it to a configuration preference.
This section describes how to create a RTM configuration preference.
Procedure
Step 1
The Preferences window displays.
Step 2
The Configuration List displays the configuration options.
Step 3
Step 4
Step 5
Step 6
Related Topics
•
•
•
Configuring Alert Notify
Add, edit, and delete Alert preferences using the Preferences button located in the RTM monitoring window status bar. Configure Alert notifications for performance counter value thresholds, schedule for alert checking, and status change of device (for example, port is out of service).
To configure the alert notification for performance counters, see Configuring Alert Notification for Counter. To configure the alert notification for gateways, see Configuring Alert Notification for Gateway.
Enabling Heartbeat Monitoring
Enable heartbeat monitoring using the Preferences icon located in the RTM monitoring window status bar. You can configure heartbeat monitoring for one or more Cisco CallManager servers in a cluster.
This section describes how to enable heartbeat monitoring.
Tip
Procedure
Step 1
The Preferences window displays.
Step 2
The Heartbeat Monitoring window displays.
Step 3
Step 4
Step 5
Step 6
Step 7
Step 8
Step 9
Note
Step 10
Step 11
To close the window without making changes, click the Close button.
Related Topics
•
•
•
Configuring Alert Notification for Heartbeat Monitoring
This section describes how to configure the alert notification parameters for heartbeat monitoring.
Procedure
Step 1
Step 2
Step 3
The Alert Configuration window displays.
Step 4
Step 5
If you want the alert information sent in an e-mail, continue with the following steps.
If you want the alert to pop up a message, go to Step 14.
Step 6
Step 7
The Mail Server Configuration window displays.
Step 8
Step 9
Step 10
The window closes, and the Alert Configuration window displays.
Step 11
Step 12
Step 13
Step 14
Step 15
Step 16
The Preferences window displays. The Alert list box displays the alert that you added.
Related Topics
•
•
•
Enabling Directory Status
Enable directory status using the Preferences icon located in the RTM monitoring window status bar. You can configure directory status for one or more Cisco CallManager servers in a cluster.
This section describes how to enable directory status.
Tip
Procedure
Step 1
The Preferences window displays.
Step 2
The Directory Status Monitoring window displays.
Step 3
Note
Step 4
Step 5
Step 6
Step 7
Step 8
Step 9
Step 10
Note
Step 11
Step 12
Note
Step 13
Step 14
To close the window without making changes, click the Close button.
Related Topics
•
•
•
Configuring Alert Notification for Directory Status
This section describes how to configure the alert notification parameters for directory status.
Procedure
Step 1
Step 2
Step 3
The Alert Configuration window displays.
Step 4
Step 5
If you want the alert information sent in an e-mail, continue with the following steps.
If you want the alert to pop up a message, go to Step 14.
Step 6
Step 7
The Mail Server Configuration window displays.
Step 8
Step 9
Step 10
The window closes, and the Alert Configuration window displays.
Step 11
Step 12
Step 13
Step 14
Step 15
Step 16
The Preferences window displays. The Alert list box displays the alert that you added.
Related Topics
•
•
Using Resource Usage
If the system is running slowly, or calls are not getting through, you can view Cisco CallManager resources.
Viewing Last 24 hr. Calls
Serviceability monitors calls attempted and calls completed every hour for 24 hours (this is an automatic setting). See the following Note.
Note
This section describes how to view the Cisco CallManager resource usage for calls during the last 24 hours.
Procedure
Step 1
The Resource Usage window displays.
Step 2
The window displays the usage information in bar graph form. Two bars display for every hour for the last 24 hours: one for calls attempted, one for calls completed.
Step 3
Step 4
Step 5
Step 6
Related Topics
Viewing Process Activity
This section describes how to view the Cisco CallManager process activity resource usage.
Procedure
Step 1
The Resource Usage window displays.
Step 2
Step 3
Step 4
Step 5
Note
Step 6
Related Topics
Viewing Directory Servers
This section describes how to view the Cisco CallManager directory servers resource usage.
Procedure
Step 1
The Resource Usage window displays.
Step 2
The Directory Servers pane displays. See Table 10-1 for a description of the directory servers information.
Note
Step 3
Note
Step 4
Related Topics
Viewing About RTM
This section describes how to view the RTM About information.
Procedure
Step 1
The About window displays the following information:
•
•
•
•
–
–
–
–
Step 2
The Cisco CallManager Component Versions window displays.
Step 3
Step 4
Viewing Help
This section describes how to view the Serviceability Online Help information.
Procedure
Step 1
The Help window displays.
Step 2
Step 3
Viewing Alert Icon Information
The Real-Time Monitoring tool monitors the Cisco CallManager heartbeat and directory connection status. When the heartbeat is lost or the directory connection status becomes disconnected, a blinking icon appears in the RTM window status bar. To find out about the alert, click the blinking icon. See Figure 10-3.
An e-mail can notify you of a heartbeat loss or the directory connection status.
This section describes how to view the Cisco CallManager Alert information.
Procedure
Step 1
A popup window displays providing the time and node of the lost heartbeat.
Step 2
Figure 10-3 RTM Alert Icon
Related Topics
•
•
•
Using Category Tabs
A category comprises monitored performance counters. A tab in the RTM monitoring pane contains the category name. All performance counters monitored in this tab belong to a category. The system polls the performance counters in the tab at the same rate, with each category configured to have its own polling rate.
To create custom categories, you add a new category tab. When the tab is created, you specify the specific performance counters, devices, and alerts within that tab and then save your custom category using Preferences.
Related Topics
•
•
Creating a Category
This section describes how to create a new category for the RTM performance or device monitoring pane.
Note
Procedure
Step 1
A popup window displays.
Step 2
Step 3
Step 4
Note
Step 5
A new tab with the name that you chose displays.
Step 6
Related Topics
•
•
•
Removing a Category
This section describes how to remove a category from the performance or device monitoring pane.
Procedure
Step 1
A popup window displays.
Step 2
The tab that you removed, along with any counters or devices that displayed in that pane, no longer displays.
Related Topics
•
•
•
Renaming a Category
This section describes how to rename a category in the RTM performance or device monitoring pane.
Step 1
A popup window displays.
Step 2
Step 3
Step 4
The tab that you renamed displays.
Related Topics
•
•
•
Configuring Sample Polling Rate
The Cisco CallManager software polls counters, devices, and gateway ports to gather status information. In the RTM monitoring pane, you configure the polling intervals for the performance counters, devices, and gateway ports for each category tab that you create. For a description of the polling intervals for gateway ports, see Configuring Refresh Rate for Gateway.
Note
This section describes how to configure the polling interval.
Procedure
Step 1
A popup window displays.
Step 2
The Polling Rate window displays. You can configure polling rates from 1 second to 24 hours. The default is 10 minutes.
Step 3
The maximum polling interval equals 24 hours, which the system calculates. An error displays if you configure more than 24 hours in the polling interval field.
Step 4
Step 5
Step 6
Related Topics
•
•
Configuring Performance Counters in Table View/Chart View
The Cisco CallManager software displays performance counters in chart or table format. Chart format looks like a miniature screen of information. Up to six charts display in the RTM performance monitoring pane for each category tab that you create. Because chart view is the default, you configure the performance counters to display in table format when you create a category.
This section describes how to configure table format for the performance monitoring pane.
Procedure
Step 1
A popup window displays.
Step 2
Step 3
Step 4
Step 5
A new tab with the name that you chose displays.
Step 6
Related Topics
•
•
Changing Content of Device Monitoring Pane (Re-Select)
To change the contents of the device monitoring pane without going to the device name in the Monitoring Objects pane, use the Re-Select option. This section describes how to change the contents of the device monitoring pane.
Procedure
Note
Step 1
A popup window displays.
Step 2
The Select Device to Monitor window displays. You can check or uncheck the appropriate check boxes, or you can navigate backward or forward within the window.
Step 3
The RTM device monitoring pane displays the changed information.
Related Topics
•
•
Understanding Performance Counters
You monitor the performance of the Cisco CallManager software by selecting the counters for any object. The counters for each object display when the folder is expanded.
Related Topics
•
•
Adding a Counter to Monitor
To troubleshoot system performance problems, you add the counter associated with the performance object to the RTM performance monitoring pane, which displays a chart for the counter. Category tabs contain up to six performance counter charts.
Before You Begin
See the following sections before adding counters:
This section describes how to add a counter to the RTM performance monitoring pane.
Note
Note
Procedure
Step 1
The file icon opens, and a list of objects displays.
Step 2
The object icon opens, and a list of counters displays.
Step 3
Step 4
Step 5
The counter displays in the RTM performance monitoring pane.
Related Topics
•
•
•
•
•
Configuring Alert Notification for Counter
Cisco CallManager notifies you of system problems using the alert notification feature.
Before You Begin
Consider the following configuration setup to activate alert notifications for a system counter:
•
•
•
•
•
This section describes how to configure the alert notification parameters for a counter.
Procedure
Step 1
Step 2
The Counter Alert Configuration window displays.
Step 3
The Preferences window displays the Alert List and Description information.
Step 4
The Alert Configuration window displays.
Step 5
Step 6
If you want the alert information sent in an e-mail, continue with the following steps.
If you want the alert to pop up a message, go to Step 15.
Step 7
Step 8
The Mail Server Configuration window displays.
Step 9
Step 10
Step 11
The window closes, and the Alert Configuration window displays.
Step 12
Step 13
Step 14
Step 15
Step 16
Step 17
Step 18
The Alert Configuration window displays. In the Alert drop-down box, choose the alert that you added.
Step 19
Step 20
Note
Step 21
Step 22
Note
Step 23
The Frequency and Schedule window of the Counter Alert Configuration displays.
Step 24
For example, if you set the threshold to be Over 100 calls in progress and Under 50 calls in progress, the system sends an alert when the thresholds of either more than 100 calls in progress take place or under 50 calls in progress take place.
Note
If the calls in progress continue to go over or under the threshold, the system does not send another alert notification. When the threshold is normal (between 50 and 100 calls in progress), the system deactivates the alert notification. However, if the threshold should go over or under the threshold value again, the system reactivates alert notification.
Step 25
Note
Step 26
Step 27
Step 28
For example, if you set the threshold to be Over 100 calls in progress and Under 50 calls in progress, the system checks the counter value every 10 minutes to determine whether it is under or over the thresholds of either more than 100 calls in progress take place or under 50 calls in progress take place. If the counter value exceeds the thresholds, the system activates an alert notification.
Step 29
Note
Step 30
Step 31
Step 32
Step 33
Step 34
Step 35
Step 36
Step 37
Step 38
Note
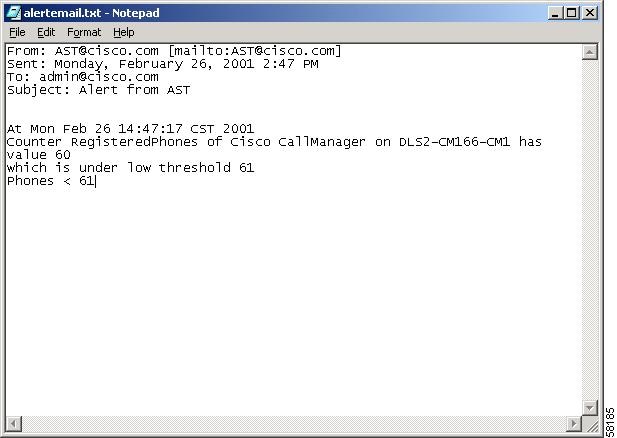
Figure 10-4 provides an example of an alert e-mail sent to the system administrator when the RegisteredPhones was below the low threshold.
Table 10-3 provides a description of the counter alert configuration parameters.
Figure 10-4 Alert Notification E-Mail
Related Topics
•
•
•
•
Zooming a Counter
To get a closer look at performance monitors, zoom the monitor counter in the RTM performance monitoring pane.
This section describes how to zoom the monitoring information for a counter.
Procedure
Step 1
Step 2
The Zoom window displays.
Step 3
Step 4
Related Topics
•
•
•
•
•
Removing a Counter From Monitor
You remove counters from the RTM performance monitoring pane when they are no longer needed.
This section describes how to remove a counter from the window.
Procedure
Step 1
Step 2
The counter no longer displays in the window.
Related Topics
•
•
•
•
Understanding Counter Properties
Counter properties provides two capabilities: display a description of the counter and configure data sampling parameters.
Displaying a Property Description
Use one of two ways to obtain a description of the counter:
•
•
This section describes how to display the counter property description.
Procedure
Step 1
Step 2
The Counter Property window displays the description of the counter. The description includes the host address, the object to which the counter belongs, the counter name, and a brief overview of what the counter does.
Step 3
Related Topics
•
•
•
Configuring a Data Sample
The Counter Property window contains the option to configure data samples for a counter. The performance counters displayed in the RTM performance monitoring pane contain green dots representing samples of data over time. You can configure the number of data samples to collect and the number of data points to show in the chart. After the data sample is configured, view the information by using the View All Data/View Current Data menu selection. See Viewing Counter Data.
This section describes how to configure the number of data samples to collect for a counter.
Procedure
Step 1
Step 2
The Counter Property window displays the description of the counter. The description includes the host address, the object to which the counter belongs, the counter name, and a brief overview of what the counter does.
Step 3
Step 4
Step 5
Step 6
Step 7
Step 8
Step 9
Related Topics
•
•
•
•
Viewing Counter Data
Use this view data for a monitor option to view the data collected for a performance counter. See Understanding Counter Properties, for a description of data sample configuration.
This section describes how to view all and current data for a performance counter.
Procedure
Step 1
Step 2
The counter chart displays all data that has been sampled. The green dots appear very close together, almost forming a solid line.
Step 3
Step 4
The counter chart displays the last configured data samples collected. See the Understanding Counter Properties, procedure for configuring data samples.
Related Topics
•
•
•
•
•
Counter Alert Configuration Settings
Table 10-3 describes the counter alert configuration parameters.
Understanding Device Monitoring
The Cisco CallManager Real-Time Monitoring tool monitors device activity for Cisco CallManager devices such as phones, gateways, and H.323 devices. RTM monitors the device information (such as name of device, directory number, IP address) in real time. Refer to the Cisco CallManager Serviceability System Guide for additional information.
Adding Device to Monitor
This section describes how to add a device to the device monitoring pane.
Note
Procedure
Step 1
The Select Device to Monitor window displays.
Tip
Step 2
•
•
•
•
•
The drop-down box displayed to the right of the radio button highlights.
Step 3
The menu list displays.
Step 4
Note
Step 5
A window with search criteria displays.
Step 6
•
•
•
•
•
•
Step 7
Step 8
A window with the monitoring attributes fields displays.
Step 9
Step 10
The device monitoring pane displays the information that you chose.
Related Topics
•
•
•
•
•
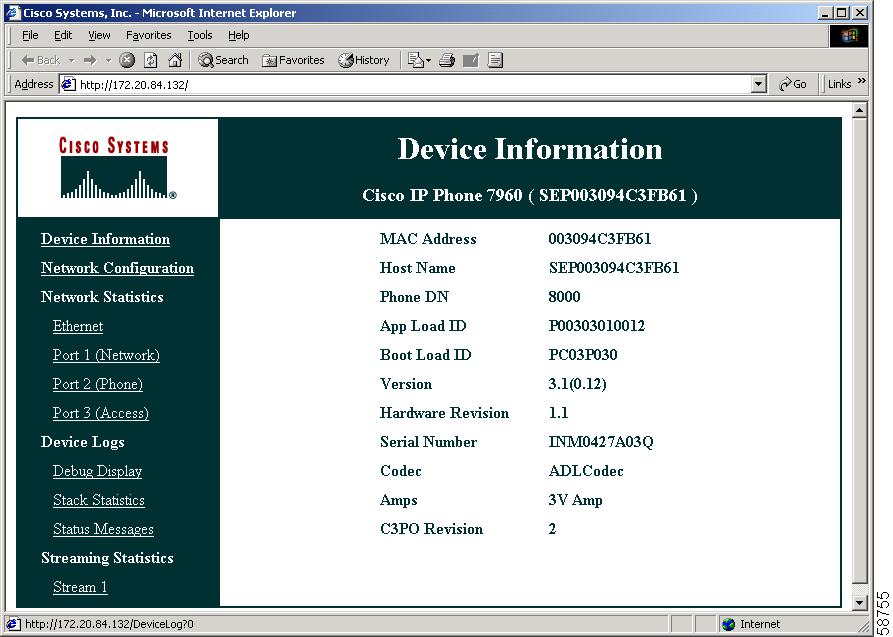
Viewing Phone Information
You can view information about phones displayed in the RTM device monitoring pane. This section describes how to view phone information.
Procedure
Step 1
Step 2
Step 3
A popup menu displays.
Step 4
The Device Information window displays. See Figure 10-5. For more information on the device, choose any field displayed in the left pane of the window.
Figure 10-5 Device Information Window
Related Topics
•
•
•
•
•
Viewing Device Properties
You can view the properties of devices that display in the RTM device monitoring pane. This section describes how to view device properties.
Procedure
Step 1
Step 2
Step 3
A popup menu displays.
Step 4
The Device Property window displays.
Step 5
Step 6
The window displays product id, HTTP support, platform type, and registration attempts.
Related Topics
•
•
•
•
•
Viewing Application Information
You can view the application information for selected devices such as the Cisco IP phone, CTI port, and CTI route point. This section describes how to view application information.
Procedure
Step 1
Step 2
A popup menu displays.
Step 3
The Application Information window displays the CTI manager node name, application ID, user ID, application IP address, application status, app time stamp, device time stamp, device name, and CTI device open status.
Step 4
Related Topics
Viewing Gateway Channel Status
You can view the status of any gateway that displays in the RTM device monitoring pane. This section describes how to view gateway status.
Procedure
Step 1
Step 2
Step 3
A popup menu displays.
Step 4
The Port Status window displays the port number, the port type, and the port status of the gateway.
Table 10-4 Gateway Status
Analog
Busy
Idle
Out of Service
Digital D channel
In Service
Out of Service
Digital B channel
Busy
Idle
Out of Service
Related Topics
•
•
•
•
•
Configuring Alert Notification for Gateway
Cisco CallManager uses the Alert Notification feature to notify you of gateway port problems.
Before You Begin
To activate alert notifications for a gateway and its ports, consider the following configuration setup:
•
•
•
•
This section describes how to configure the alert notification parameters for a gateway.
Procedure
Step 1
Step 2
The Port Status window displays.
Step 3
The Port Status Alert Configuration window displays.
Step 4
The Preferences window displays the Alert Notify and Description information.
Step 5
The Alert Configuration window displays.
Step 6
Step 7
If you want the alert information sent in an e-mail, continue with the following steps.
If you want the alert to pop up a message, go to Step 16.
Step 8
Step 9
The Mail Server Configuration window displays.
Step 10
Step 11
Step 12
The window closes, and the Alert Configuration window displays.
Step 13
Step 14
Step 15
Step 16
Step 17
Step 18
The Port Status Alert Configuration window displays. The alert that you added displays in the Alert selection drop-down box.
Step 19
If you choose All Ports, the system monitors all ports in the gateway for an out-of-service state. If you choose Selected Ports, you must choose the port that you want monitored by clicking on that port field. To choose multiple ports, hold the Shift key while clicking the port fields.
Step 20
The Frequency and Schedule window of the Port Status Alert Configuration displays.
Step 21
Step 22
Step 23
Step 24
Step 25
For example, the system checks the port status every 10 minutes to determine whether it is out of service. If it is, the system activates an alert notification.
Step 26
Note
Step 27
Step 28
Step 29
Step 30
Step 31
Step 32
Step 33
Step 34
Step 35
Note
Related Topics
•
•
•
•
•
Configuring Refresh Rate for Gateway
The Cisco CallManager software polls counters, devices, and gateway ports to gather status information. In the RTM monitoring pane, you configure the polling intervals for the performance counters, devices, and gateway ports for each category tab that you create. For a description of polling intervals for performance counters, see Configuring Sample Polling Rate.
This section describes how to configure the polling interval.
Procedure
Step 1
A popup window displays.
Step 2
The Port Status window displays.
Step 3
The Polling Rate window displays.
Step 4
Step 5
Step 6
Step 7
Related Topics
•
•
•
•
•
Gateway Configuration Settings
Table 10-5 describes the gateway alert configuration parameters.