Getting NDFC Network Sites Ready for Nexus Dashboard Insights
Available Languages
Bias-Free Language
The documentation set for this product strives to use bias-free language. For the purposes of this documentation set, bias-free is defined as language that does not imply discrimination based on age, disability, gender, racial identity, ethnic identity, sexual orientation, socioeconomic status, and intersectionality. Exceptions may be present in the documentation due to language that is hardcoded in the user interfaces of the product software, language used based on RFP documentation, or language that is used by a referenced third-party product. Learn more about how Cisco is using Inclusive Language.
- US/Canada 800-553-2447
- Worldwide Support Phone Numbers
- All Tools
 Feedback
 Feedback
Introduction
Cisco Nexus Dashboard Fabric Controller (NDFC) is an application that runs on the Nexus Dashboard (ND) and enables controlling, automating, monitoring, visualization, and troubleshooting of networks built on the Cisco Nexus Data Center switches.
Nexus Dashboard Insights (NDI) is a unified monitoring and analytics tool that reduces mean time to detect (MTTD) and mean time to resolve (MTTR) network issues by providing comprehensive visibility into the infrastructure, reliable issue analysis, and definitive suggestions for addressing day2 operation challenges of complex data center networks. Nexus Dashboard Insights processes and analyzes telemetry data continuously streamed from all the devices in the infrastructure to provide network operators with real-time monitoring and analytics of the network. It also offers lifecycle management suggestions and foresight into infrastructure change management.
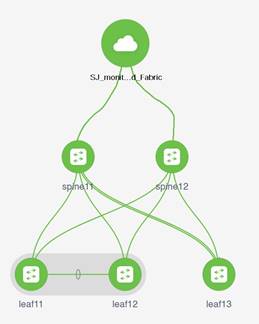
This paper details the best deployment configurations, and settings to implement Nexus Dashboard Insights for your NDFC managed or monitored NX-OS network sites. To enable streaming telemetry data from all the devices on the sites, specific configurations and pre-requisite settings are required on NDFC and devices. We use a typical two-tier (spine and leaf) network fabric as an example in this white paper to illustrate the necessary configuration on the NDFC controller and the switches to prepare the sites for Nexus Dashboard Insights. As a network site can be fully managed or only monitored by NDFC, the white paper discusses the configuration for both the NDFC managed mode and monitored mode.
Software and Hardware Product Versions
The example in this white paper has the following product software versions:
● Nexus Dashboard Fabric Controller version 12.0.2f
● Nexus Dashboard version 6.0.2.1928
● Nexus Dashboard Insights version 2.1(2d)
For more information about supported software versions and compatibilities of related products, refer to the Cisco Nexus Dashboard and Services Compatibility Matrix at the following link: https://www.cisco.com/c/dam/en/us/td/docs/dcn/tools/dcn-apps/index.html.
For support of the required features, we are using all cloud-scale switches.
NDFC and NDI co-hosting on the same ND cluster is not supported for the above versions. Co-hosting both the applications on the same ND cluster will be supported in future releases.
As both NDFC and NDI applications are running on separate ND clusters, ND-NDFC and ND-NDI will be used to context switch between the two applications.
Pre-Requisites for NDFC Sites Configuration
Nexus Dashboard nodes provide the following two interfaces for connectivity:
● Management or Out-of-band or bond1br Interface
● Data or Fabric or in-band or bond0br Interface
ND-NDFC nodes require one IP each for the above two interface types from their respective subnets. The clusters must be Layer-2 adjacent respectively on the two interfaces.
To configure NDFC, refer to configuration guides located at https://www.cisco.com/c/en/us/support/cloud-systems-management/nexus-dashboard-fabric-controller-12/model.html.
For NDFC deployments and considerations along with DCNM to NDFC migration, refer to https://www.cisco.com/c/en/us/td/docs/dcn/whitepapers/cisco-nexus-dashboard-fabric-controller-deployment-guide.html.
Below is the summary of pre-requisites to prepare NDFC and its managed or monitored network sites for onboarding onto the Nexus Dashboard and use with Nexus Dashboard Insights:
● Configure routable loopback interfaces on switches for NDI hosting ND data network connectivity
Nexus Dashboard data network needs IP reachability to the network site and the NDFC. A routable loopback interface is used on the network site switches for this connectivity and to source telemetry data. We could use a dedicated loopback interface or an existing loopback interface on the switches. Configuring or usage of a loopback interface for both monitored and managed modes are discussed in further sections.
The round-trip time (RTT) between the Nexus Dashboard cluster and the network site must not exceed 50ms for Nexus Dashboard Insights to run for the network site properly.
● Enable and Configure NTP (Network Time Protocol) in the network
NTP is an essential clock service that syncs all the elements of the network site. NTP service is not only required for setting up the NDFC cluster and managing network site switches, but also for software telemetry to work. It maintains the consistency and coherence of logs between the switches and the NDFC controller. NTP configurations and verifications for monitored and managed modes are discussed in further sections.
● Enable and Configure PTP (Precision Time protocol) in the network
Nexus Dashboard Insights requires a microsecond-level accurate PTP clock for the network site to perform flow analytics across the site and calculate the end-to-end network latency of the flows.
For NDFC managed or monitored NX-OS network site, the PTP grandmaster needs to be an external device that can provide at least a microsecond-level clock.
The PTP configurations and verifications are discussed in the next sections for both NDFC managed and monitored network sites.
The following sections discuss in detail the configuration and verification for each of the pre-requisite requirements.
Prepare NDFC Managed Network Sites for Nexus Dashboard Insights
NDFC supports managed mode which requires discovering nodes, adding them to a fabric and assigning fabric roles. In managed mode, NDFC manages the switch configuration. It deploys the config-profiles based on a set of inputs provided in the fabric building process and monitor the network site.
This section will help prepare an NDFC managed network site for Nexus Dashboard and Nexus Dashboard Insights. It details each of the below steps in order:
● Create routable loopback interfaces on switches
This section allows you to create a controlled SDN fabric that can be managed and monitored by NDFC.
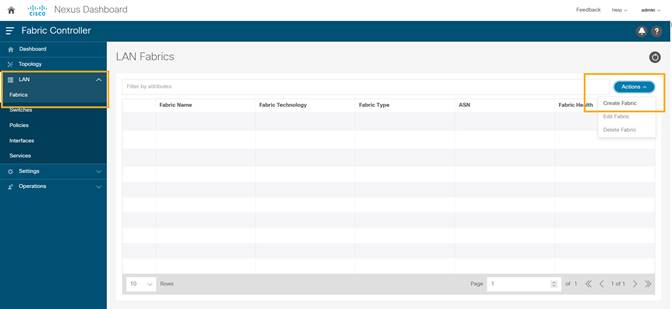
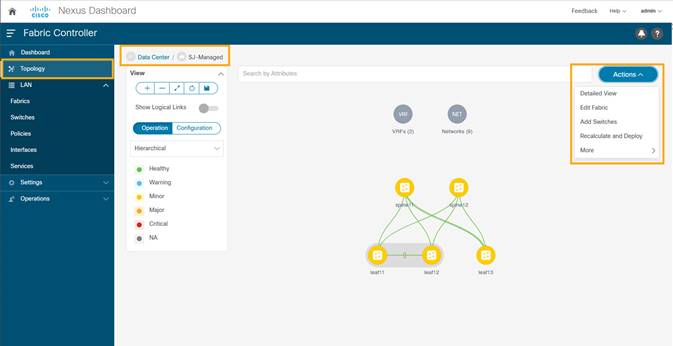
1. On the Fabric Controller UI, choose LAN > Fabrics. From the Actions drop-down list, select Create Fabric.
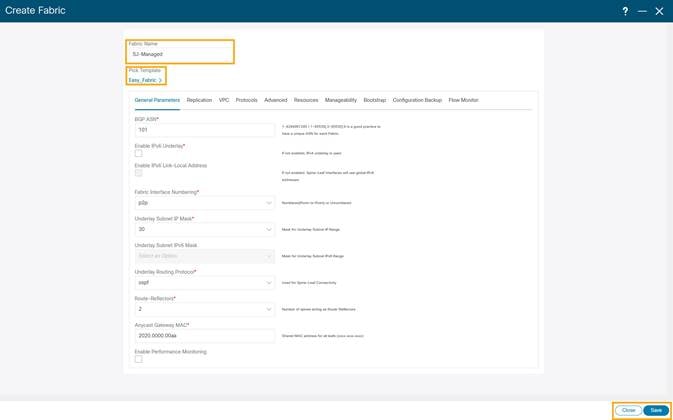
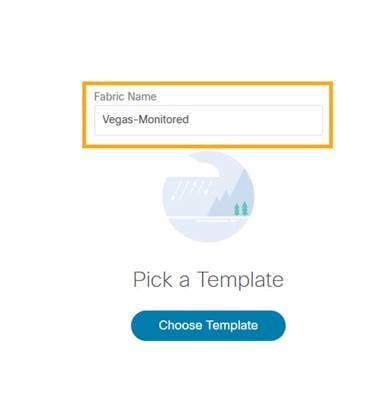
2. Enter the Fabric Name.
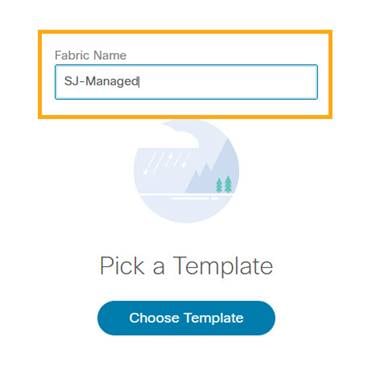
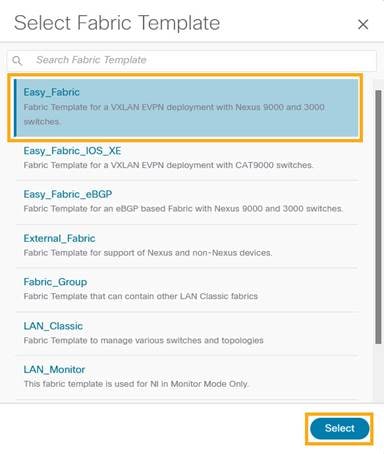
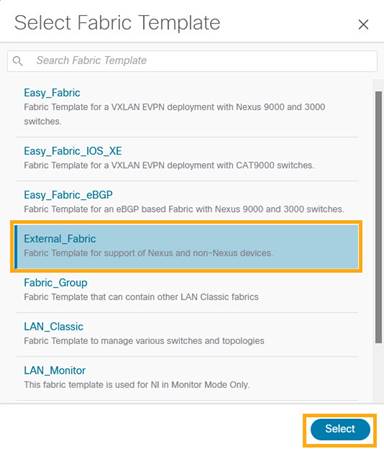
3. Click Choose Template. Select the template of interest and click Select. NDFC supports multiple fabric types of fabrics (for example: LAN classic, VxLAN fabrics and so on).
For this paper we use a VxLAN fabric.
4. In the Select Fabric Template pop-up choose Easy_Fabric template to add a managed VxLAN fabric.
5. Enter appropriate values for the chosen template. For example: Easy_Fabric. Click Save to submit the configuration.
Refer to Easy Provisioning of VxLAN BGP EVPN Fabrics in the Cisco Nexus Dashboard Fabric Controller for LAN Configuration Guide for more details on how to create and configure a VxLAN BGP EVPN Fabric on NDFC.
Discover Switches in the Fabric
NDFC uses a single seed or multiple IPs in the fabric and dynamically discover the switches for a set number of hops defined in ‘Max Hops’ or also a list of all switch IPs in the fabric with a hop count ‘0’. It allows you to select the switches to be added to the fabric.
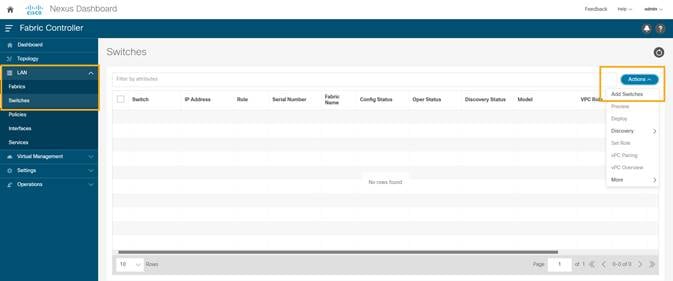
1. On the Fabric Controller UI, choose LAN > Switches. From the Actions drop-down list, select Add Switches.
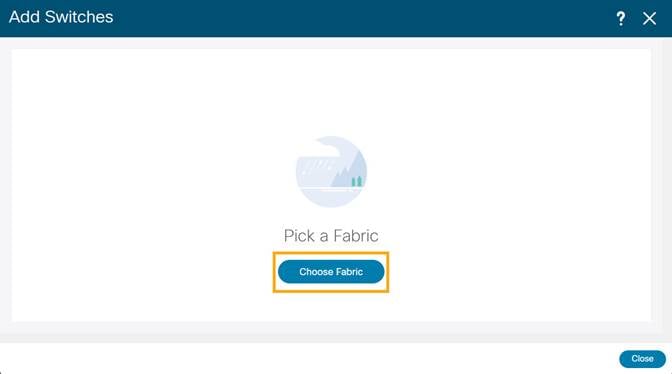
2. On the Add Switches screen, click Choose Fabric to choose a fabric to which the switches must be associated.
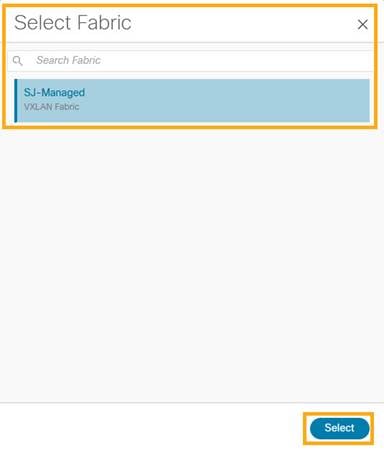
3. Select the fabric intended to discover the switches and click Select.
4. Provide a seed IP (management IP) of any switch in the fabric to be discovered. Choose the Authentication protocol used to login to switches and provide Username/Password. Select the number of hops from the seed to determine the detection boundary. Check the Preserve Config check box to keep the existing configs on the switch (brownfield deployment) or uncheck the option to clean up the configuration on the switches (greenfield. deployment).
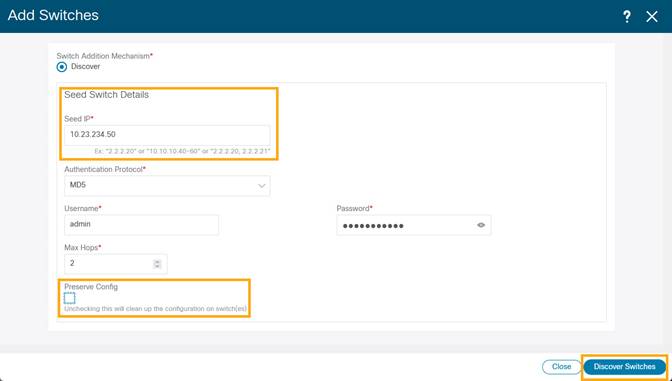
5. Click Discover Switches.
6. Select all the switches intended to be part of the fabric and click on Add Switches.
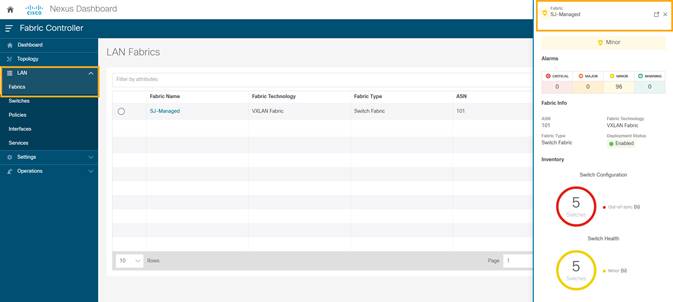
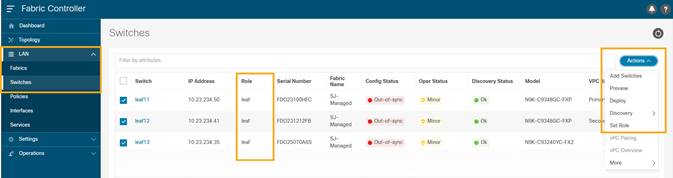
7. Chose LAN > Switches to ensure that the switches are discovered and are associated with the correct fabric. You can also choose LAN > Fabrics. Double click on the fabric to view Fabric Overview. Click on Switches tab to view the switches associated with the specific Fabric.
8. On the Switches page, click Actions > Set Role to assign roles to the switches.
Alternatively, on the Topology page, right click on the appropriate switch and assign roles.
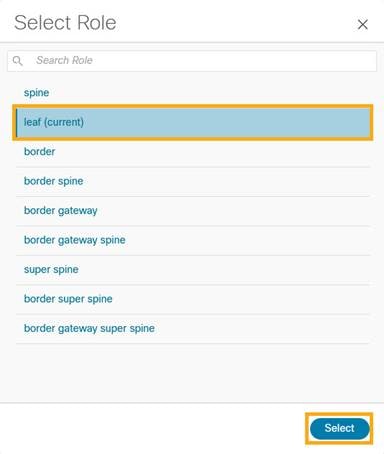
9. From the pop-up choose the intended role and click Select.
10. After setting the role, on the Switches page. select the switches and click Actions > Deploy.
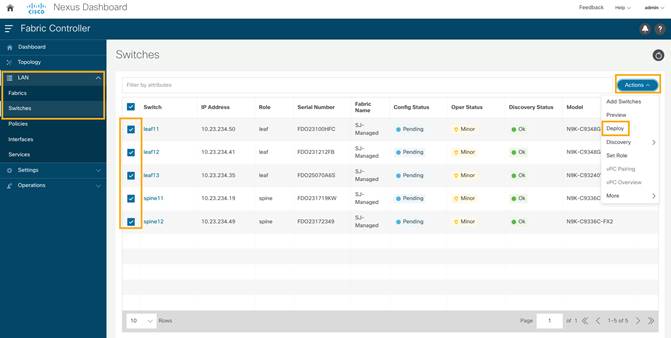
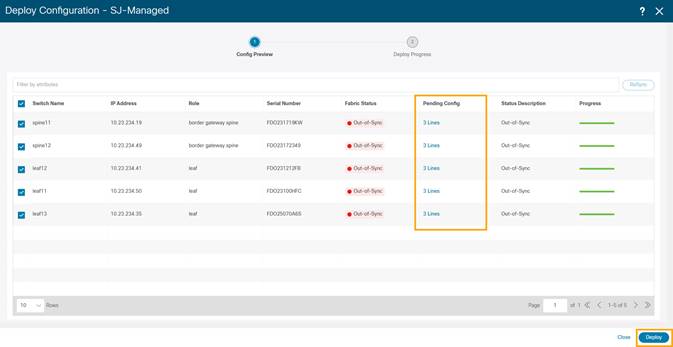
11. From the Deploy Configuration screen, preview the configurations by clicking on Pending Config and click Deploy to be guided to deployment progress screen.
Configure Routable Loopback Interface on Switches
For managed easy fabrics, NDFC deploys an underlay routing loopback and VTEP loopback on the switches. To deploy Nexus Dashboard Insights for the NDFC site, either of the loopback is leveraged when there is IP reachability to the data network of the Nexus Dashboard cluster.
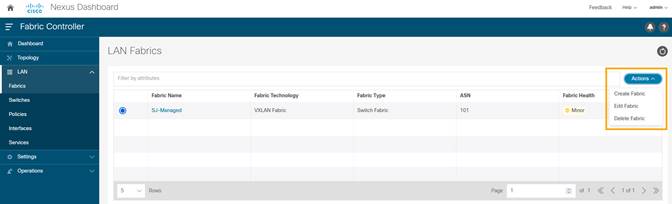
1. Choose LAN > Fabrics. From Actions drop-down list, choose Edit Fabric.
2. On the Protocols tab and enable loopback IDs. Click Save.
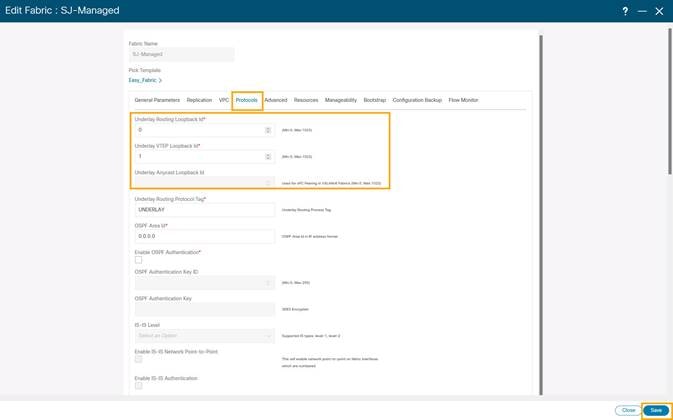
3. Save and deploy the fabric to get loopback IDs created.
4. Login to the switch to check if the loopback mentioned above is created on the switches and can ping the Nexus Dashboard cluster.
leaf11# show run interface loopback 0
interface loopback0 >>> Check if the loopback 0 is created
description Routing loopback interface
ip address 10.2.0.1/32 >>> IP address dynamically allocated
ip router ospf UNDERLAY area 0.0.0.0
ip pim sparse-mode
leaf11# show interface loopback 0
loopback0 is up >>> Check status of the loopback 0
admin state is up,
Hardware: Loopback
Description: Routing loopback interface
Internet Address is 10.2.0.1/32
MTU 1500 bytes, BW 8000000 Kbit , DLY 5000 usec
reliability 255/255, txload 1/255, rxload 1/255
Encapsulation LOOPBACK, medium is broadcast
Auto-mdix is turned off
346284 packets input 30982434 bytes
0 multicast frames 0 compressed
0 input errors 0 frame 0 overrun 0 fifo
0 packets output 0 bytes 0 underruns
0 output errors 0 collisions 0 fifo
0 out_carrier_errors
leaf11# ping 192.168.1.201 source-interface loopback 0 >> checking reachability to the Nexus Dashboard
PING 192.168.1.201 (192.168.1.201): 56 data bytes
64 bytes from 192.168.1.201: icmp_seq=0 ttl=62 time=0.738 ms
64 bytes from 192.168.1.201: icmp_seq=1 ttl=62 time=0.45 ms
64 bytes from 192.168.1.201: icmp_seq=2 ttl=62 time=0.483 ms
64 bytes from 192.168.1.201: icmp_seq=3 ttl=62 time=0.429 ms
64 bytes from 192.168.1.201: icmp_seq=4 ttl=62 time=0.367 ms
--- 192.168.1.201 ping statistics ---
5 packets transmitted, 5 packets received, 0.00% packet loss
round-trip min/avg/max = 0.367/0.493/0.738 ms
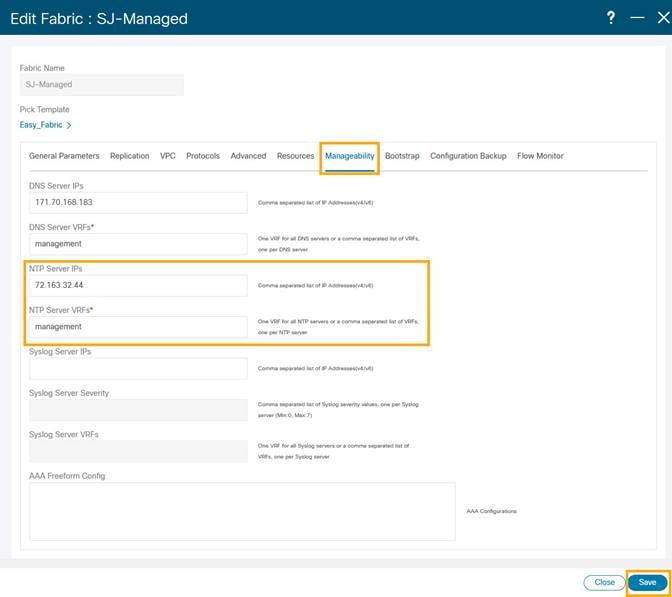
Network Time Protocol (NTP) Configuration
For a network site managed by NDFC, enable and configure NTP on the NDFC. The NDFC will push the NTP configs to all the switches.
1. On the NDFC UI, choose LAN > Fabrics. Select the fabric (SJ-Managed).
2. From Actions drop-down list, choose Edit Fabric.

3. Click on Manageability tab to fill in the NTP server IP and VRF details and click Save.
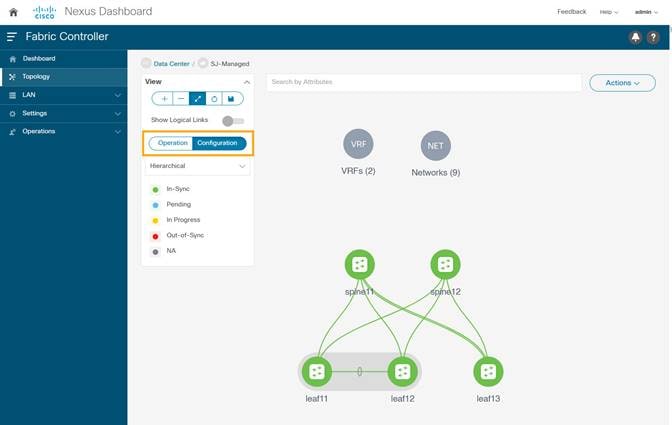
4. Click on LAN > Topology. Select Fabric (SJ-Managed). From Actions drop-down list, select Recalculate and Deploy.

5. Toggle on the Configuration to see the switches turn green (Success).
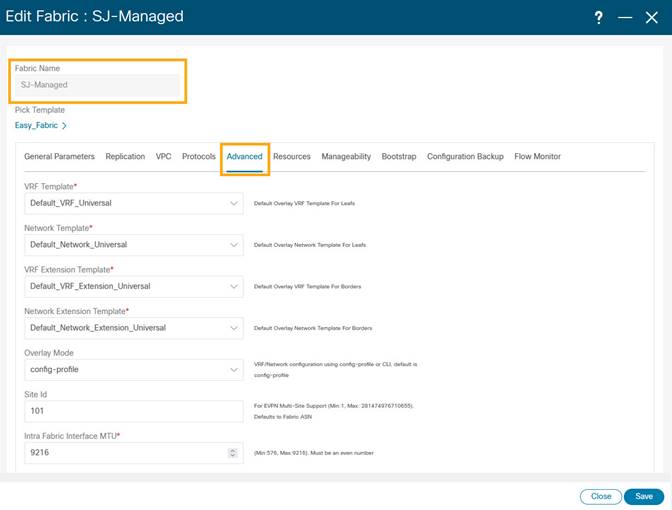
Precision Time Protocol (PTP) Configuration
When PTP is enabled, it becomes the default clock even if NTP is enabled on the switches. PTP requires a source loopback used for exchanging PTP packets and a PTP domain ID that defines boundaries of the PTP messages. NDFC offers easy site setup for enabling PTP.
1. Choose LAN > Fabrics. Select the fabric (SJ-Managed). From the drop-down list, select Edit Fabric.

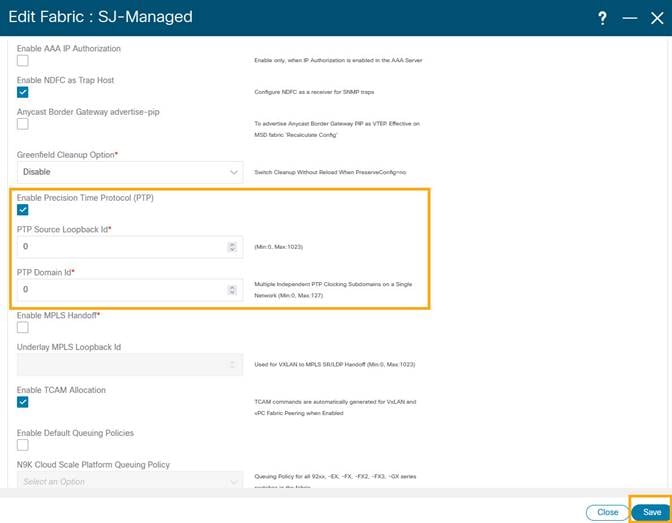
2. Click on Advanced tab and select Enable Precision Time Protocol (PTP). Provide the PTP source loopback ID, PTP domain ID. Click Save.
This enables PTP globally and on core-facing interfaces.
3. Choose LAN > Topology. Select Fabric (SJ-Managed). From the Actions drop-down list, click Recalculate and Deploy to ensure switches are configured with the required PTP settings as configured in the NDFC.
4. After the switches turn green (Success), login to the switches to confirm the configuration and clock settings.

Prepare NDFC Monitored Network Sites for Nexus Dashboard Insights
NDFC supports monitored mode which requires discovering nodes and adding them to a fabric. In monitored mode, NDFC does not manage the switch configuration and typically only helps monitor the fabric. This mode can work complementary to any configuration tools and methods used as it is agnostic of the switch configurations. For a NDFC monitored network site, users need to deploy and verify the needed switch configuration for Nexus Dashboard and Nexus Dashboard Insights by themselves.
This section helps to prepare a NDFC monitored fabric for Nexus Dashboard and Nexus Dashboard Insights. It details each of the below steps in order:
● Configure Routable Loopback Interfaces on the switches
This section shows you how to create a NDFC monitored fabric.
1. Choose LAN > Fabrics. From the Actions drop-down list, select Create Fabric.
The Add Fabric screen appears.

2. Enter fabric name and click Choose Template.
NDFC supports multiple fabric types (for example: LAN classic, VxLAN fabrics and so on). For this section we use a monitored VxLAN fabric as an example.
3. Choose External_Fabric template to add a monitored VxLAN fabric.
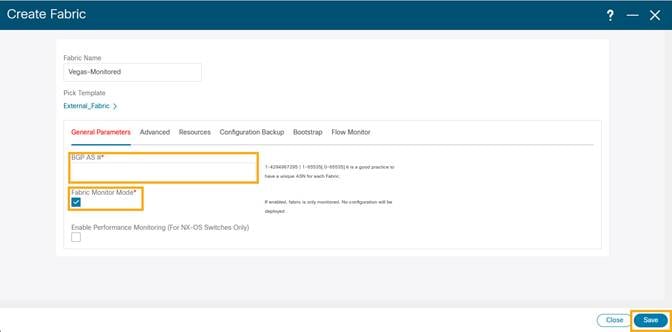
4. In the General Parameters tab, populate the BGP AS# used in the site.
5. Check the Fabric Monitor Mode check box to enable Fabric in monitored mode.
6. Click Save.
Note: Since the fabric is only monitored by the NDFC, switches on this fabric are expected to be configured by the user and NDFC does not deploy any configurations to the switches in this mode.
Discover Switches in the Fabric
NDFC can use a single seed or multiple IPs in the fabric and dynamically discover the switches for a set number of hops defined in Max Hops or also a list of all switch IPs in the fabric with a hop count ‘0’ can also serve the purpose. It allows selection of switches to be added to the fabric.
1. Choose LAN > Switches. From the Actions drop-down list, select Add Switches.
The above step will pop-up a new window to allow user to choose a fabric that the discovered switches will belong to.
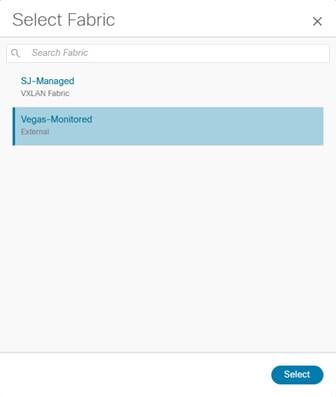
2. Click Choose Fabric.
3. From the list of Fabrics, select the fabric intended to discover the switches to. Click Select.
4. Enter a seed IP (management IP) of any switch in the fabric to be discovered. Choose the Authentication Protocol used to login to switches and provide Username/Password. Select the number of hops from the seed to determine the detection boundary.
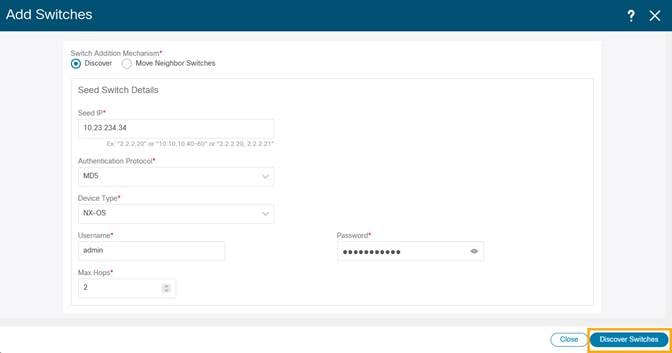
5. Click Discover Switches.
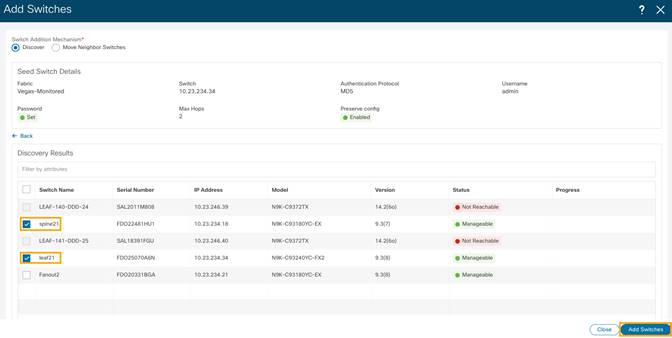
6. Select all the switches intended to be part of the fabric and click Add Switches.
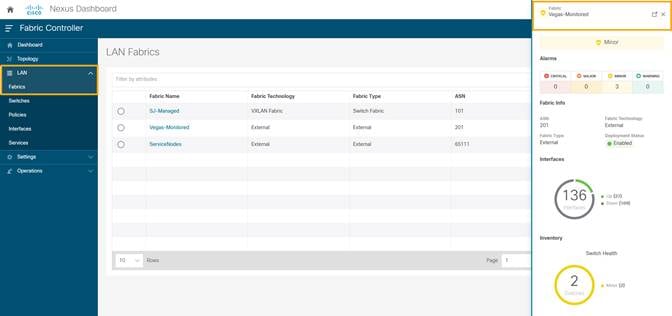
7. Click LAN > Switches. The Switches that are discovered and part of the fabric intended are displayed. You can view the switches associated with the Fabric from LAN > Fabrics > Fabrics Overview > Switches tab also.
After the switches are added to the fabric, assign roles to the switches by selecting the switch/switches and choosing the intended role, such as Spine, Leaf, Border Gateway and so on.
8. Click on LAN > Switches. Double click on the switch to view Switch Overview. From Actions drop-down list, select Set Role.
Configure a Routable Loopback Interface on Switches
Each switch in the network site needs a routable loopback interface to source the telemetry data to the Nexus Dashboard Insights. Any existing loopback on the switches with the required IP connectivity to the Nexus Dashboard Data Network could be used or users can create a new loopback for the purpose.
For a NDFC monitored fabric, users need to configure and manage such a loopback interface on the switches by themselves. Below shows the procedure.
1. Configure a loopback interface on the switches
leaf21(config)# interface loopback 0
leaf21(config-if)# description Routing loopback interface
leaf21(config-if)# ip address 20.2.0.1/32
leaf21(config-if)# ip router ospf underlay area 0.0.0.0
leaf21# show run interface loopback 0 >> check for
interface loopback0
description Routing loopback interface
ip address 20.2.0.1/32
ip router ospf underlay area 0.0.0.0
leaf21# show interface loopback 0
loopback0 is up
admin state is up,
Hardware: Loopback
Description: Routing loopback interface
Internet Address is 20.2.0.1/32
MTU 1500 bytes, BW 8000000 Kbit , DLY 5000 usec
reliability 255/255, txload 1/255, rxload 1/255
Encapsulation LOOPBACK, medium is broadcast
Auto-mdix is turned off
1031148 packets input 96462171 bytes
0 multicast frames 0 compressed
0 input errors 0 frame 0 overrun 0 fifo
0 packets output 0 bytes 0 underruns
0 output errors 0 collisions 0 fifo
0 out_carrier_errors
2. Check if the loopback created can reach the Nexus Dashboard Data Network by pinging the Nexus Dashboard Data Network IP address from the loopback interface. In the example below, the IP address 192.168.1.201 is one of the Nexus Dashboard Data Network IP addresses. If there is no firewalls or other network devices blocking the ICMP traffic, the ping should succeed.
leaf21# ping 192.168.1.201 source-interface loopback 0
PING 192.168.1.201 (192.168.1.201): 56 data bytes
64 bytes from 192.168.1.201: icmp_seq=0 ttl=62 time=0.56 ms
64 bytes from 192.168.1.201: icmp_seq=1 ttl=62 time=0.431 ms
64 bytes from 192.168.1.201: icmp_seq=2 ttl=62 time=0.38 ms
64 bytes from 192.168.1.201: icmp_seq=3 ttl=62 time=0.449 ms
64 bytes from 192.168.1.201: icmp_seq=4 ttl=62 time=0.379 ms
--- 192.168.1.201 ping statistics ---
5 packets transmitted, 5 packets received, 0.00% packet loss
round-trip min/avg/max = 0.379/0.439/0.56 ms
Note: For an effective verification, make sure the ping is sourced from the Loopback interface.
Network Time Protocol (NTP) Configuration
You must enable NTP and configure the NTP server on each switch in the network site that’s monitored by the NDFC, also need to make sure all the switches have the consistent NTP configuration and is synced to the same NTP server.
In NDFC monitored mode, all the switches in the network site must be configured with an NTP server.
spine12# config terminal
Enter configuration commands, one per line. End with CNTL/Z.
spine12(config)# ntp server 72.163.32.44 use-vrf management
Precision Time Protocol (PTP) Configuration
For NDFC managed or monitored network site, an external PTP grandmaster that provides a clock source with at least microsecond accuracy is required. When PTP is enabled, it is the default clock even if NTP is enabled on the switches. PTP requires a source loopback used for exchanging PTP packets and a PTP domain ID that defines the boundaries of the PTP messages.
For NDFC monitored network site, you must configure PTP on each network switch as NDFC doesn’t manage the switch configuration. This section describes how to configure PTP on an NX-OS switch.
1. Enable feature PTP:
leaf21# configure terminal
Enter configuration commands, one per line. End with CNTL/Z.
leaf21(config)# feature ptp -> Enabling feature ptp
2. Configure PTP domain ID and PTP source interface (a routable loopback)
leaf21(config)# ptp domain 1 -> PTP domain ID
leaf21(config)# ptp source 10.2.0.1-> PTP source IP
3. Configure PTP under core facing interfaces and ttag under Host facing interfaces:
interface Ethernet1/1 -> Core facing interface
ptp
interface Ethernet1/33 -> host facing interface
ttag
ttag-strip
NTP and PTP verifications
With either managed or monitored mode fabrics, verifications on the switch remain the same.
● NTP verifications: Login to the switches to confirm the configuration and clock settings. Verify below commands for NTP setup on the switch as the clock time source.
leaf21(config)# show run ntp
!Command: show running-config ntp
!No configuration change since last restart
!Time: Sun Feb 6 21:54:40 2022
version 9.3(7) Bios:version 05.40
ntp server 72.163.32.44 use-vrf management -> Verify the configuration
leaf11(config)# show clock
21:53:34.997 UTC Sun Feb 6 2022
Time source is NTP -> Verify NTP is the time source
leaf11(config)# show ntp peers
----------------------------------------------------
Peer IP Address Serv/Peer
----------------------------------------------------
72.163.32.44 Server (configured) -> Verify the server is configured
● PTP Verifications: After enabling PTP either through NDFC or CLI configurations, verify below commands for PTP on the switch as the clock time source.
leaf11# show run ptp
feature ptp. -> Verify that PTP is enabled and configured on the interfaces
ptp source 10.0.0.1
ptp domand 0
interface Ethernet1/1
ptp
interface Ethernet1/33
ttag
ttag-strip
leaf11# show clock
01:56:04.353 UTC sun Feb 6 2022
Time source is PTP -> Verify PTP is the time source
leaf11# show ptp clock foreign-masters record
P1=Priority1, P2=Priority2, C=Class, A=Accuracy,
OSLV=Offset-Sclaed-Log-Variance, SR=Steps-Removed
GM=Is grandmaster
---------- ------------------- --- ---- ---- --- ----- ----------
Interface Clock-ID P1 P2 C A OSLV SR
---------- ------------------- --- ---- ---- --- ----- ----------
Eth1/1 2c:4f:52:ff:fe:56:61:1f 255 255 248 254 65535 1
-> Verify if it can reach the grand master on its ptp configured interfaces
leaf11# show ptp clock
PTP Device Type : boundary-clock
PTP Device Encapsulation : NA
PTP Source IP Address : 10.2.0.1 -> Verify if source loopback IP is as configured
Clock Identity : d4:78:9b:ff:fe:19:87:c3
Clock Domain: 0
Slave Clock Operation : Two-step
Master Clock Operation : Two-step
Clave-Only Clock Mode : Disabled
Number of PTP ports: 3
Priority1 : 255
Priority2 : 255
Clock Quality:
Class : 248
Accuracy : 254
Offset (log variance) :
Offset From Master : 12
Mean Path Delay : 168
Steps removed : 2
Correction range : 100000
MPD range : 1000000000
Local clock time: Fri Aug 27 01:56:08 2021
PTP clock state : Locked
leaf11# show ptp parent
PTP PARENT PROPERTIES
Parent Clock:
Parent Clock Identity: 2c:4f:52:ff:fe:56:61:1f
Parent Port Number: 4
Observed Parent Offset (log variance): NA
Observed Parent Clock Phase Change Rate: N/A
Parent IP: 10.2.0.4
Grandmaster Clock:
Grandmaster Clock Identity: 00:ee:ab:ff:fe:3a:16:e7 -> Get the Grandmaster clock ID
Grandmaster Clock Quality
Class : 248
Accuracy : 254
Offset (log variance) : 65535
Priority1: 255
Priority2: 255
spine12# show ptp clock foreign-masters record
P1=Priority1, P2=Priority2, C=Class, A=Accuracy,
OSLV=Offset-Scaled-Log-Variance, SR=Steps-Removed
GM=Is grandmaster
---------- --------------------- --- ---- ---- --- ----- ----------
Interface Clock-ID P1 P2 C A OSLV SR
---------- --------------------- --- ---- ---- --- ----- ----------
Eth1/4 00:ee:ab:ff:fe:3a:16:e7 255 255 248 254 65535 1 GM
-> Check the Grandmaster clock ID and confirm the right Grandmaster registration on clients
Onboarding NDFC Network Site to Nexus Dashboard
Before adding an NDFC network site to Nexus Dashboard, the following status need to be confirmed:
● All NDFC servers are healthy: OK
● Nexus dashboard cluster has configured fabric connectivity and has cluster health: OK
The following procedure provides instructions to add NDFC site to the Nexus Dashboard:
1. On Nexus Dashboard UI, click Admin Console > Sites > Add Site.
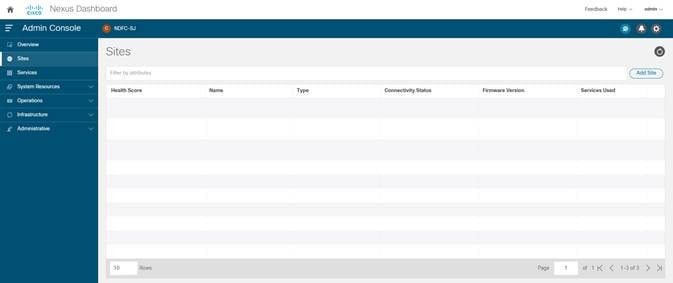
2. Select Site Type as NDFC. In the Hostname/IP address field provide the NDFC in-band IP address configured on the ‘eth2’ interface of the NDFC server. Provide Username and Password of the NDFC server.
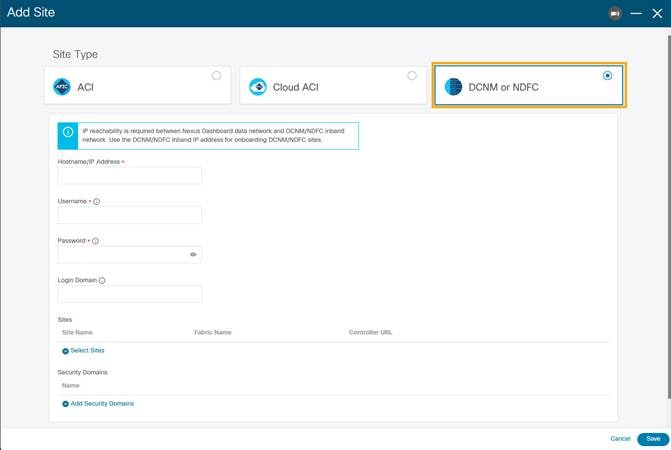
3. Click Select Sites to choose the sites to onboard onto the Nexus Dashboard. Click Select.
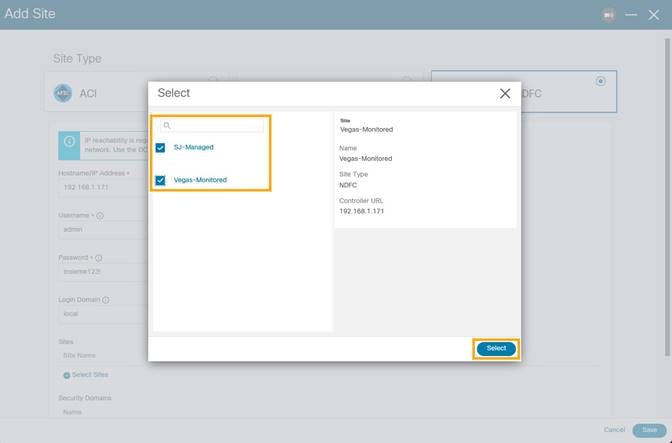
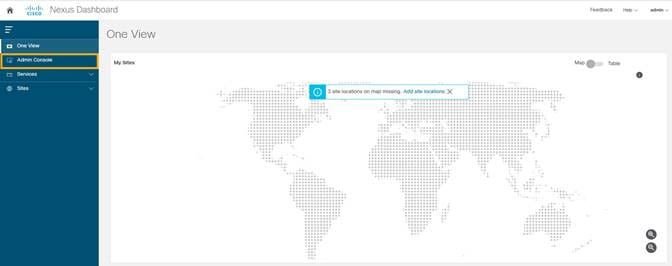
Chosen sites now are onboarded onto the Nexus Dashboard.

Enabling Nexus Dashboard Insights for a NDFC Network Site
The below workflow shows tasks involved to enable Nexus Dashboard Insights service for a NDFC network site:
● Configure the required persistent IP addresses on the Nexus Dashboard
● Install and Enable the Nexus Dashboard Insights service on the Nexus Dashboard (only required if the Insights service has not been installed or enabled yet).
● Enable the Nexus Dashboard Insights service for the site
Configuring persistent IP addresses in Nexus Dashboard
Nexus Dashboard Insights requires 6 mandatory persistent IP addresses for software and hardware telemetry services for a NDFC managed or monitored network site. The 6 persistent IP addresses are assigned to 3 UTR (Software Telemetry) application services and 3 flow collector (Hardware Telemetry) application services. These are mandatory for Nexus Dashboard Insights operations. A 7th persistent IP address is required if IPv6 is used for the assurance data collection and transport between the network site and the Nexus Dashboard. These persistent IP addresses help with retaining the same IP addresses for the Nexus Dashboard Insights services even if the internal microservice pods are relocated to different Nexus Dashboard nodes.
These persistent IP addresses are in the Nexus Dashboard Data Network subnet. They must be configured on the Nexus Dashboard prior to enabling the Nexus Dashboard Insights app.
1. On the Nexus Dashboard UI, click Admin Console
2. Choose Infrastructure > Cluster Configuration.
3. Edit External Service Pools to add 6 IP addresses from the data network subnet.
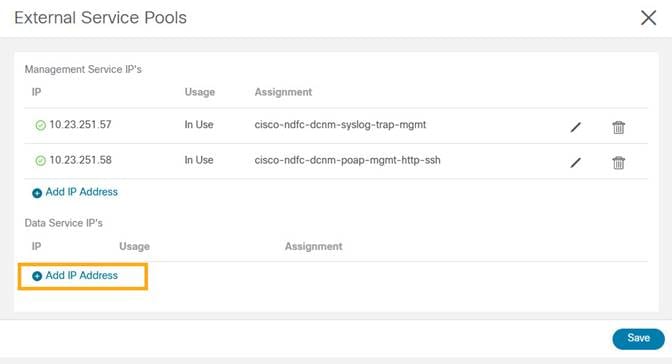
4. Click Save.
After the persistent IP addresses are added to the Nexus Dashboard, the Nexus Dashboard Insights App can be installed and enabled on the Nexus Dashboard.
Note: If Nexus Dashboard Insights is used for a NDFC managed/monitored network site, it’s required that the Nexus Dashboard nodes are Layer-2 adjacent to one another in the Data Network. In another word, the Nexus Dashboard nodes need to be in the same IP subnet for their Data Network. This is needed to allow the persistent IP addresses to move among the Nexus Dashboard nodes.
Installing and Enabling Nexus Dashboard Insights App
1. Choose Admin Console > Services > App Store tab.
You can Install the Nexus Dashboard Insights App.
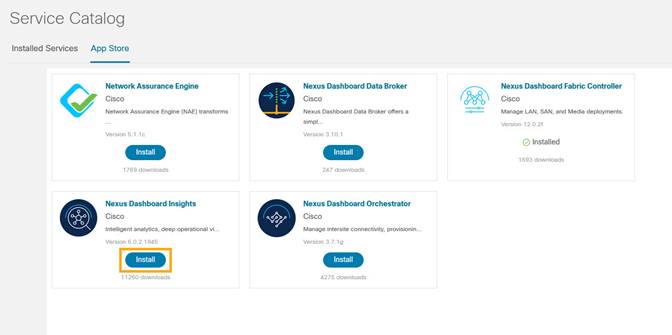
If the Nexus Dashboard cannot reach the Cisco App Store directly due to network connectivity constrains, you can install Nexus Dashboard Insights app offline.
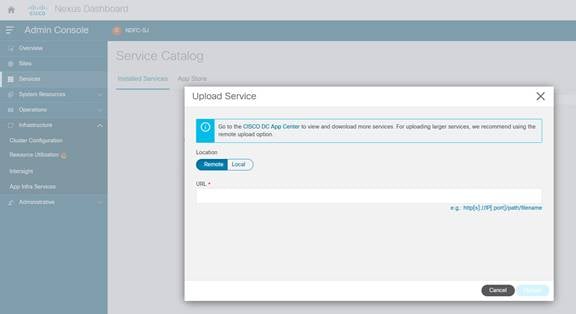
2. Download the application from the Cisco DC App Center at https://dcappcenter.cisco.com/ to your local directory or a web server. To install the app on the Nexus Dashboard, perform the following steps:
a. On the Nexus Dashboard UI, choose Admin Console > Services > Installed Services.
b. Click Actions and choose Upload Service.
c. On Upload Service screen, choose Local for location if the app image file is on your local computer. Alternatively, choose Remote if the app file is on a webserver, then provide the URL for the file.
d. Click Upload button to start the upload and installation.
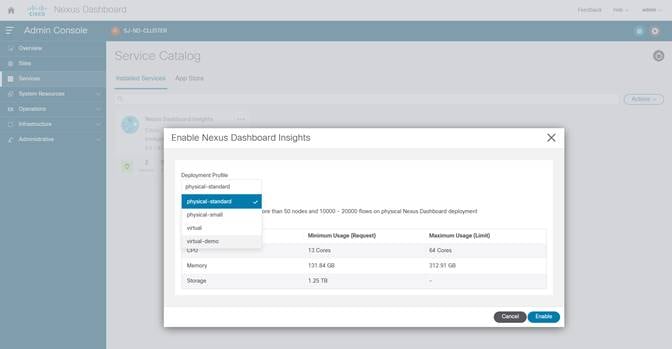
3. After Nexus Dashboard Insights is installed, click Enable.
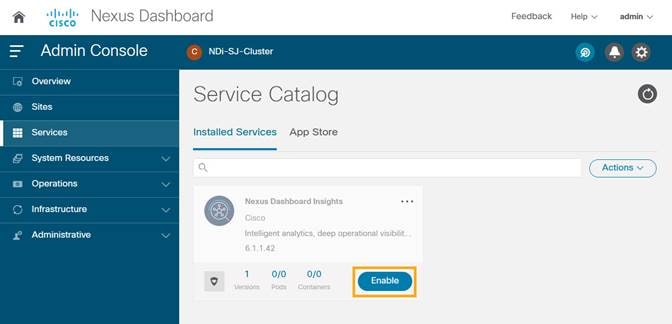
4. Choose the deployment profile. Select the appropriate profile by reading the description and complying to the Resource Requirement provided for each of the Deployment Profile. Click Enable again to apply certificates and start services required for Nexus Dashboard Insights.
For more information, refer to Nexus Dashboard Insights User Guide.
Enabling Nexus Dashboard Insights Service for NDFC Site
Perform this procedure on the Nexus Dashboard Insights UI.
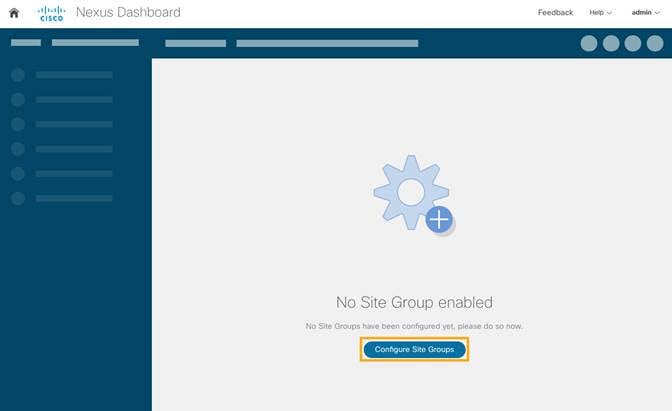
1. Create a site group and add the NDFC site to the group.
If this is the first site group on the Nexus Dashboard Insights, the following screen is displayed to guide the user to add the site group.
2. Click on Configure Site Group on the screen to start the process.
Alternatively, click on the gearbox on the top right corner, and select Site Groups > Manage. Select Add New Site Group.
3. Click Configure Site Groups and review the prerequisites for Insights.
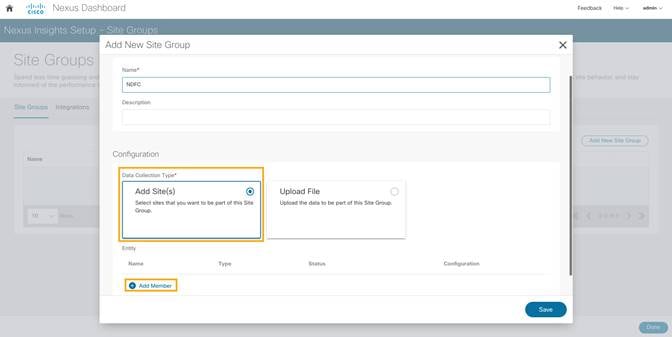
4. Click Let’s Get Started > Configure > Add New Site Group to provide a Name for the Site group.
5. Select Add Site(s). Click on +Add Member > Select Member to select the sites from Nexus Dashboard. Chose the site to be added.
6. Click Select.
7. After the site is added to the Site Group, click Enable and configure.
8. Enter the fabric type and credentials.
9. Provide the Loopback interface information that is configured in the previous section.
This Loopback interface IP address must be reachable to the Nexus Dashboard Data Network.
10. Click Save. The status changes to Enable.
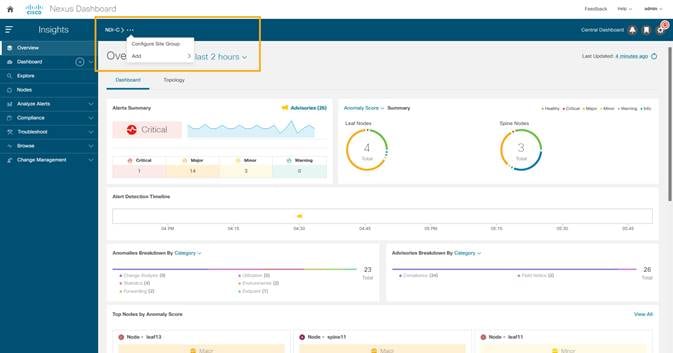
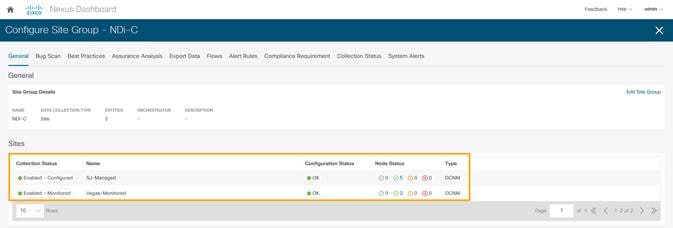
11. Click on the menu (…) option and select Configure Site Group to view the site that is enabled with Nexus Dashboard Insights services.
Enabling Bug Scan, Best Practices, and Assurance Analysis
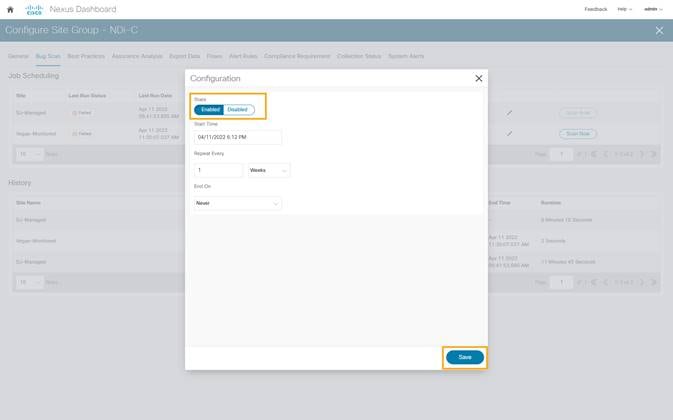
1. After the site-group is configured, to enable Bug Scan feature, click Bug Scan > (Edit) > Enabled and provide parameters for the Start and End time along with frequency of scan.
2. Click Save.
3. Click Run Now to initiate bug scan.
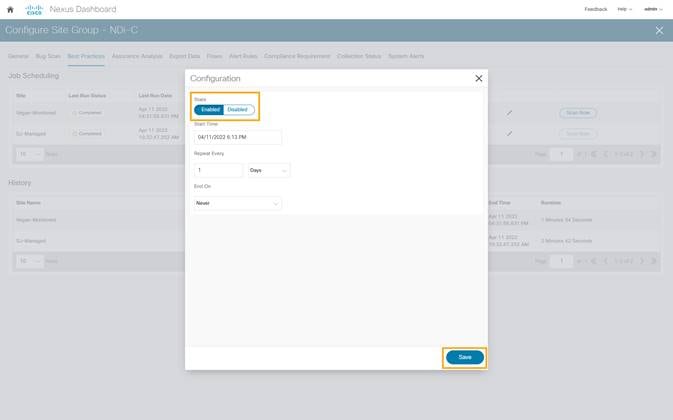
4. To enable Best Practices checks, click on Best Practices > (Edit) > Enabled and provide parameters for Start and End time along with frequency of best practice checks.
5. Click Save.
6. Click Run Now to initiate an instant best practice check in the requested site.
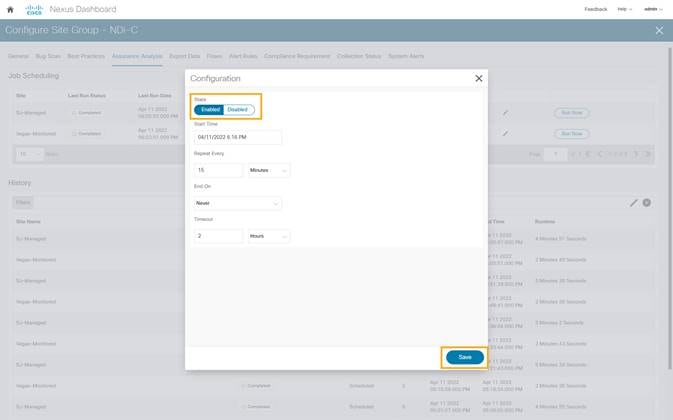
7. To enable Assurance Analysis, click on Assurance Analysis > (Edit) > Enabled and provide parameters for Start and End time along with frequency of best practice checks and timeout parameter for how long to run the job.
8. Click Save.
9. Click Run Now to initiate an instant Assurance Analysis in the requested site.
Enabling Software and Flow Telemetry
Nexus Dashboard Insights provides intuitive and simple software and flow telemetry enabling with NDFC network sites.
Enabling Software Telemetry
1. When configuring the site-group, after the site is enabled and Configuration Status is OK, Nexus Dashboard Insights generates the required configuration per switch to enable software telemetry.
In NDFC managed mode, the generated software telemetry configurations are automatically deployed on the switches. In NDFC monitored mode, the switches must be manually configured with the generated configurations.
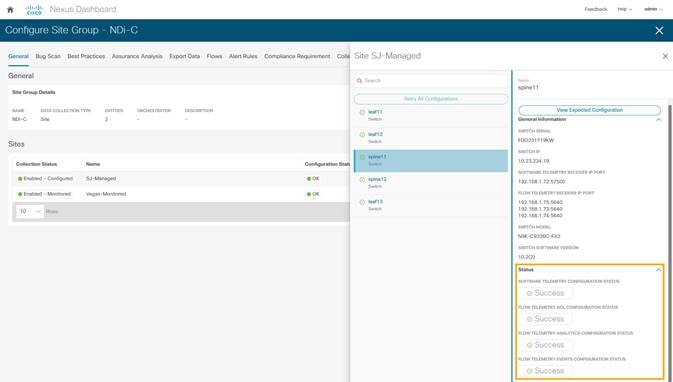
2. To check the status of the software telemetry configuration for NDFC managed sites, click on Node Status and select the node to see Success for successful operation of configuration.
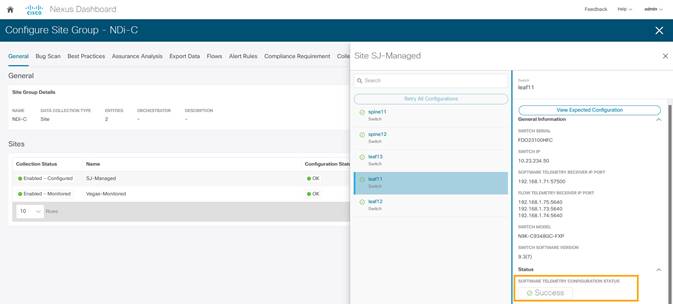
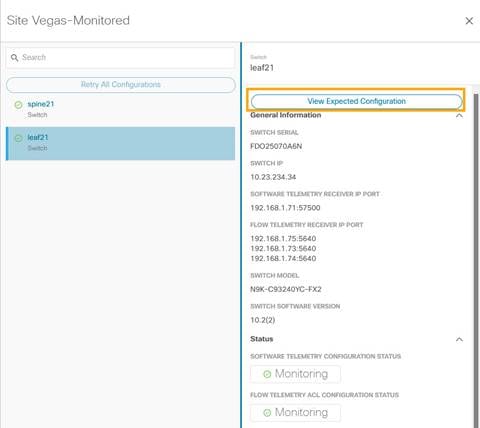
3. To fetch generated configurations to use for NDFC monitored mode network sites, click on the visual statuses under Node Status.
4. Click on any switch/node and check for SOFTWARE TELMETRY CONFIGURATION STATUS under Status.
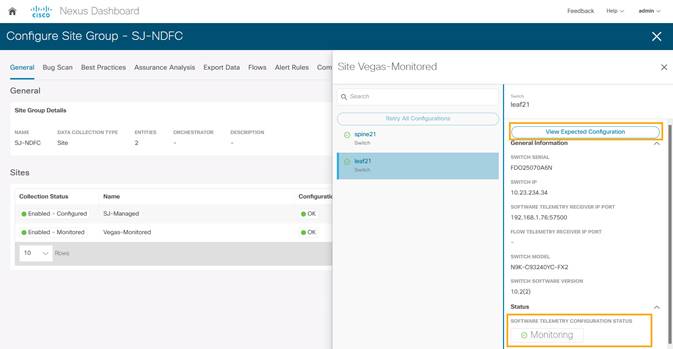
5. To fetch the auto-generated configurations, click View Expected Configuration > Software Telemetry tab. To copy the configuration to the clipboard, click Copy Configuration.
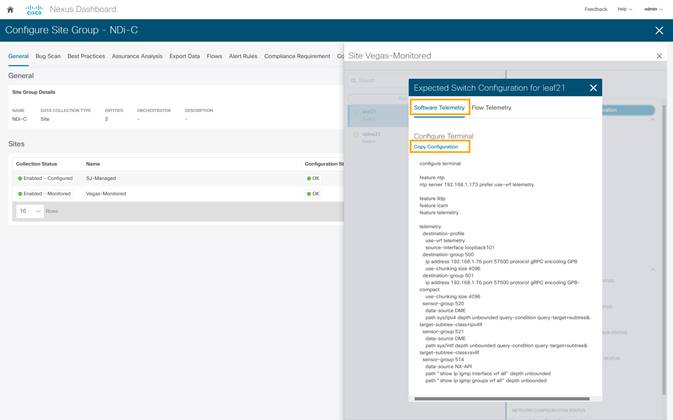
6. Repeat the process for each of the switches in the NDFC monitored mode network site.
Enabling Flow Telemetry
1. In the Configure Site Group page, click Flows > (Edit) on the desired site.
2. Choose the desired flow collection mode.
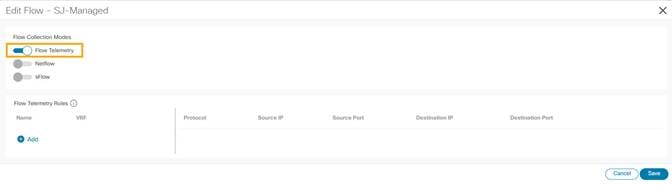
3. Under the Flow Telemetry Rules create a rule name and then populate the 5-tuple information
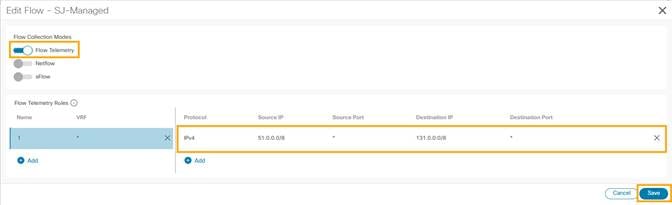
4. Click Save.
NDI auto-generates the configurations required on the switches in the network sites for enabling the created rules.
If the network sites are in NDFC managed mode, the auto-generated flow telemetry configurations are auto deployed on the switches by NDFC. If the sites are in NDFC monitored mode, the required configuration must be deployed to the switches.
5. To fetch the auto-generated configuration, in the Configure Site Group page click on General > Site under Collection Status -> Node Status -> Switch/Node -> View Expected Configuration.
6. Select Flow Telemetry tab.
Configuration with ACLs per rules created in the previous step is auto-generated along with collector information, bucket IDs, ports and other parameters such as filters and frequency of information collection.
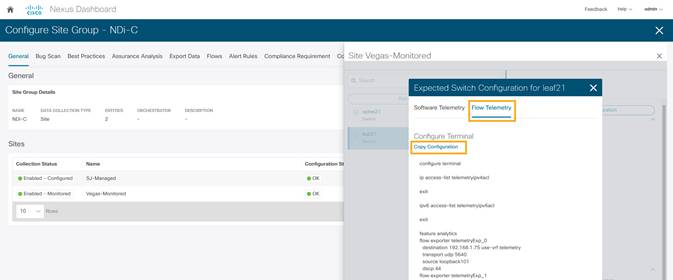
It copies configuration to the default clipboard. Use it to configure the switch in NDFC monitored mode network site.
7. Repeat the process for all the switches in the NDFC monitored mode network site.
Verifying Software and Flow Telemetry configurations
Verifications on the Nexus Dashboard Insights
In the NDFC managed mode, the configurations auto generated by NDI to enable software and flow telemetry would be deployed on all the switches in the site and status would reflect success on clicking on the status for each of the switches.
In the NDFC monitored mode, although the configurations are auto generated by NDI to enable software and flow telemetry the configuration on the switches is manual. The status in this case would be monitoring.
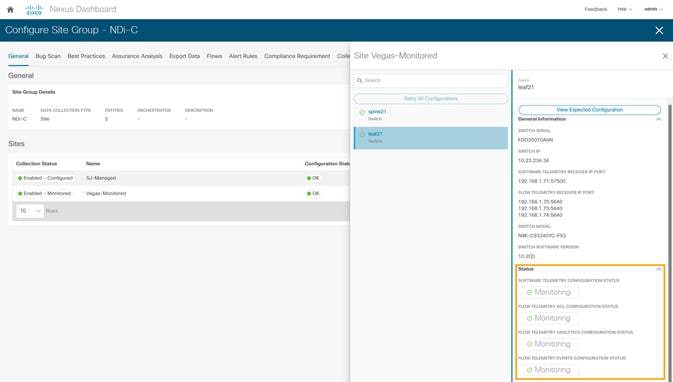
Verifications on Switches in the Network Site
Whether the switches are configured manually in NDFC monitored mode or configurations are auto deployed in NDFC managed mode, switch verification methods remain consistent for the two modes.
Software Telemetry Configuration Verifications:
Run show run telemetry on each of the switches to match the configuration to NDI-generated configuration.
Verify the correct receiver IP and port are configured on the switch and is connected.
spine21# show telemetry transport
Session Id IP Address Port Encoding Transport Status
--------------------------------------------------------------------------------
0 192.168.1.71 57500 GPB-compact gRPC Connected
0 192.168.1.71 57500 GPB gRPC Connected
--------------------------------------------------------------------------------
Retry buffer Size: 10485760
Event Retry Messages (Bytes): 0
Timer Retry Messages (Bytes): 0
Total Retries sent: 0
Total Retries Dropped: 0
Hardware Telemetry Configuration Verifications:
Verify that collectors, port and ACL information are configured.
|
|
Expected Running-Configuration |
Configured status |
| Collectors |
flow exporter telemetryExp_0 destination 192.168.1.75 transport udp 5640 source loopback0 dscp 44 flow exporter telemetryExp_1 destination 192.168.1.73 transport udp 5640 source loopback0 dscp 44 flow exporter telemetryExp_2 destination 192.168.1.74 transport udp 5640 source loopback0 dscp 44 |
spine21# show flow exporter Flow exporter telemetryExp_0: Destination: 192.168.1.75 VRF: default Destination UDP Port 5640 Source Interface loopback0 (20.2.0.2) DSCP 44 Flow exporter telemetryExp_1: Destination: 192.168.1.73 VRF: default Destination UDP Port 5640 Source Interface loopback0 (20.2.0.2) DSCP 44 Flow exporter telemetryExp_2: Destination: 192.168.1.74 VRF: default Destination UDP Port 5640 Source Interface loopback0 (20.2.0.2) DSCP 44 Feature Prio: Analytics |
| Flow Records |
flow record telemetryRec match ip source address match ip destination address match ip protocol match transport source-port match transport destination-port collect counter bytes collect counter packets |
spine21# show flow record Flow record telemetryRec: No. of users: 1 Template ID: 256 Fields: match ip source address match ip destination address match ip protocol match transport source-port match transport destination-port |
| ACL Filters |
ip access-list telemetryipv4acl
31 permit 97 131.1.101.0/27 131.1.201.0/24 30 permit 97 131.1.201.0/24 131.1.101.0/27 |
spine21# show flow filter Filter telemetryFP: Ipv4 ACL: telemetryipv4acl Ipv6 ACL: telemetryipv6acl |
Conclusion
There is a set of pre-requisite configurations for an NDFC managed or monitored network site before it can run Nexus Dashboard Insights properly. This white paper discusses the details of such required configuration. It can be used as a reference to get your NDFC managed or monitored network sites ready for Nexus Dashboard Insights. It also provides step-by-step guidance on how to add a network site to Nexus Dashboard Insights and how to enable Nexus Dashboard Insights services, such as bug scan, software telemetry, and flow telemetry functions.
Related Content
Nexus Dashboard 2.1.x User Guide
https://www.cisco.com/c/en/us/td/docs/dcn/nd/2x/user-guide/cisco-nexus-dashboard-user-guide-211.html
Nexus Dashboard Insights 6.0.x Deployment Guide
Getting your Cisco DCNM Fabrics Ready for Nexus Dashboard Insights
Cisco Nexus Dashboard Fabric Controller 12
Legal Information
Cisco and the Cisco logo are trademarks or registered trademarks of Cisco and/or its affiliates in the U.S. and other countries. To view a list of Cisco trademarks, go to this URL: www.cisco.com/go/trademarks. Third-party trademarks mentioned are the property of their respective owners. The use of the word partner does not imply a partnership relationship between Cisco and any other company. (1110R)
Any Internet Protocol (IP) addresses and phone numbers used in this document are not intended to be actual addresses and phone numbers. Any examples, command display output, network topology diagrams, and other figures included in the document are shown for illustrative purposes only. Any use of actual IP addresses or phone numbers in illustrative content is unintentional and coincidental.
© 2022 Cisco Systems, Inc. All rights reserved.