CDO에 의한 Threat Defense 관리 정보
관련 정보 클라우드 제공 Firewall Management Center
클라우드 제공 Firewall Management Center는 온프레미스 management center와 동일한 기능을 다수 제공하며 모양과 느낌이 동일합니다. CDO을 기본 관리자로 사용하는 경우, 분석만을 위해 온프레미스 management center를 사용할 수 있습니다. 온프레미스 management center는 정책 구성 또는 업그레이드를 지원하지 않습니다.
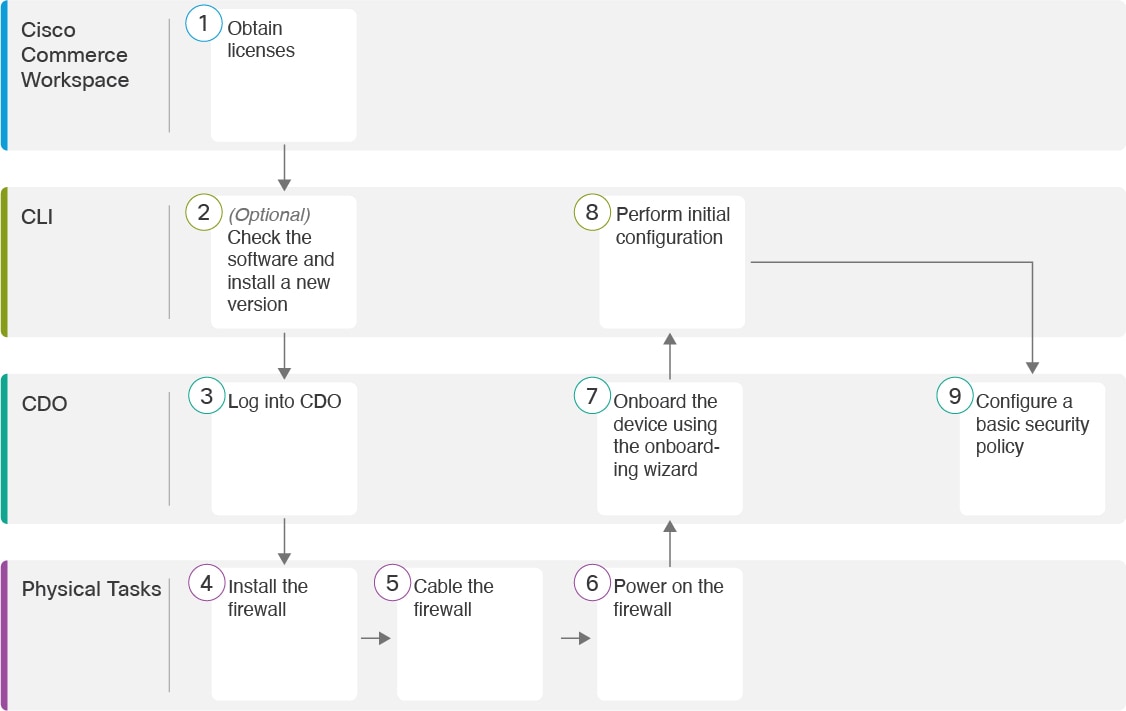
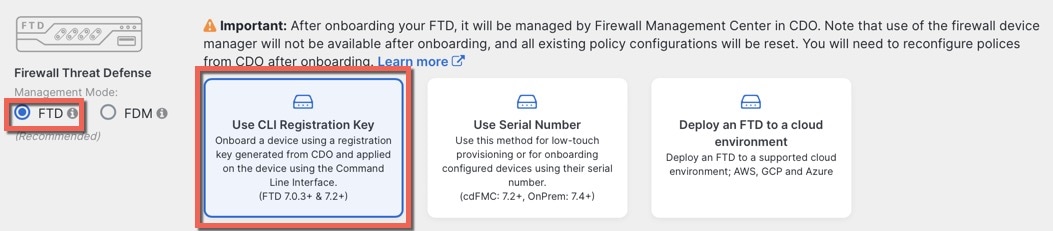
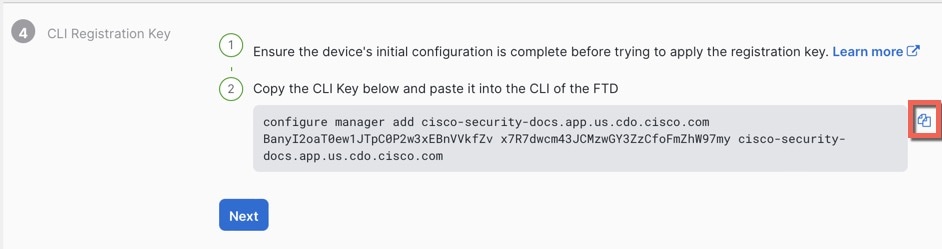
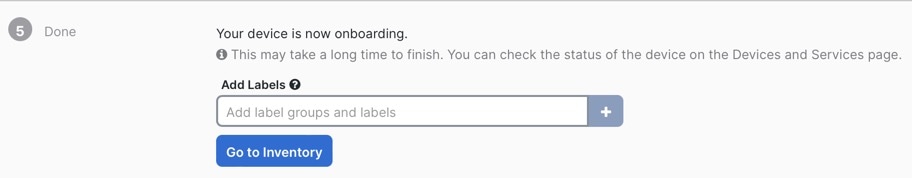
온보딩 마법사 및 CLI 등록을 사용하여 디바이스를 온보딩할 수 있습니다.
Threat Defense 관리자 액세스 인터페이스
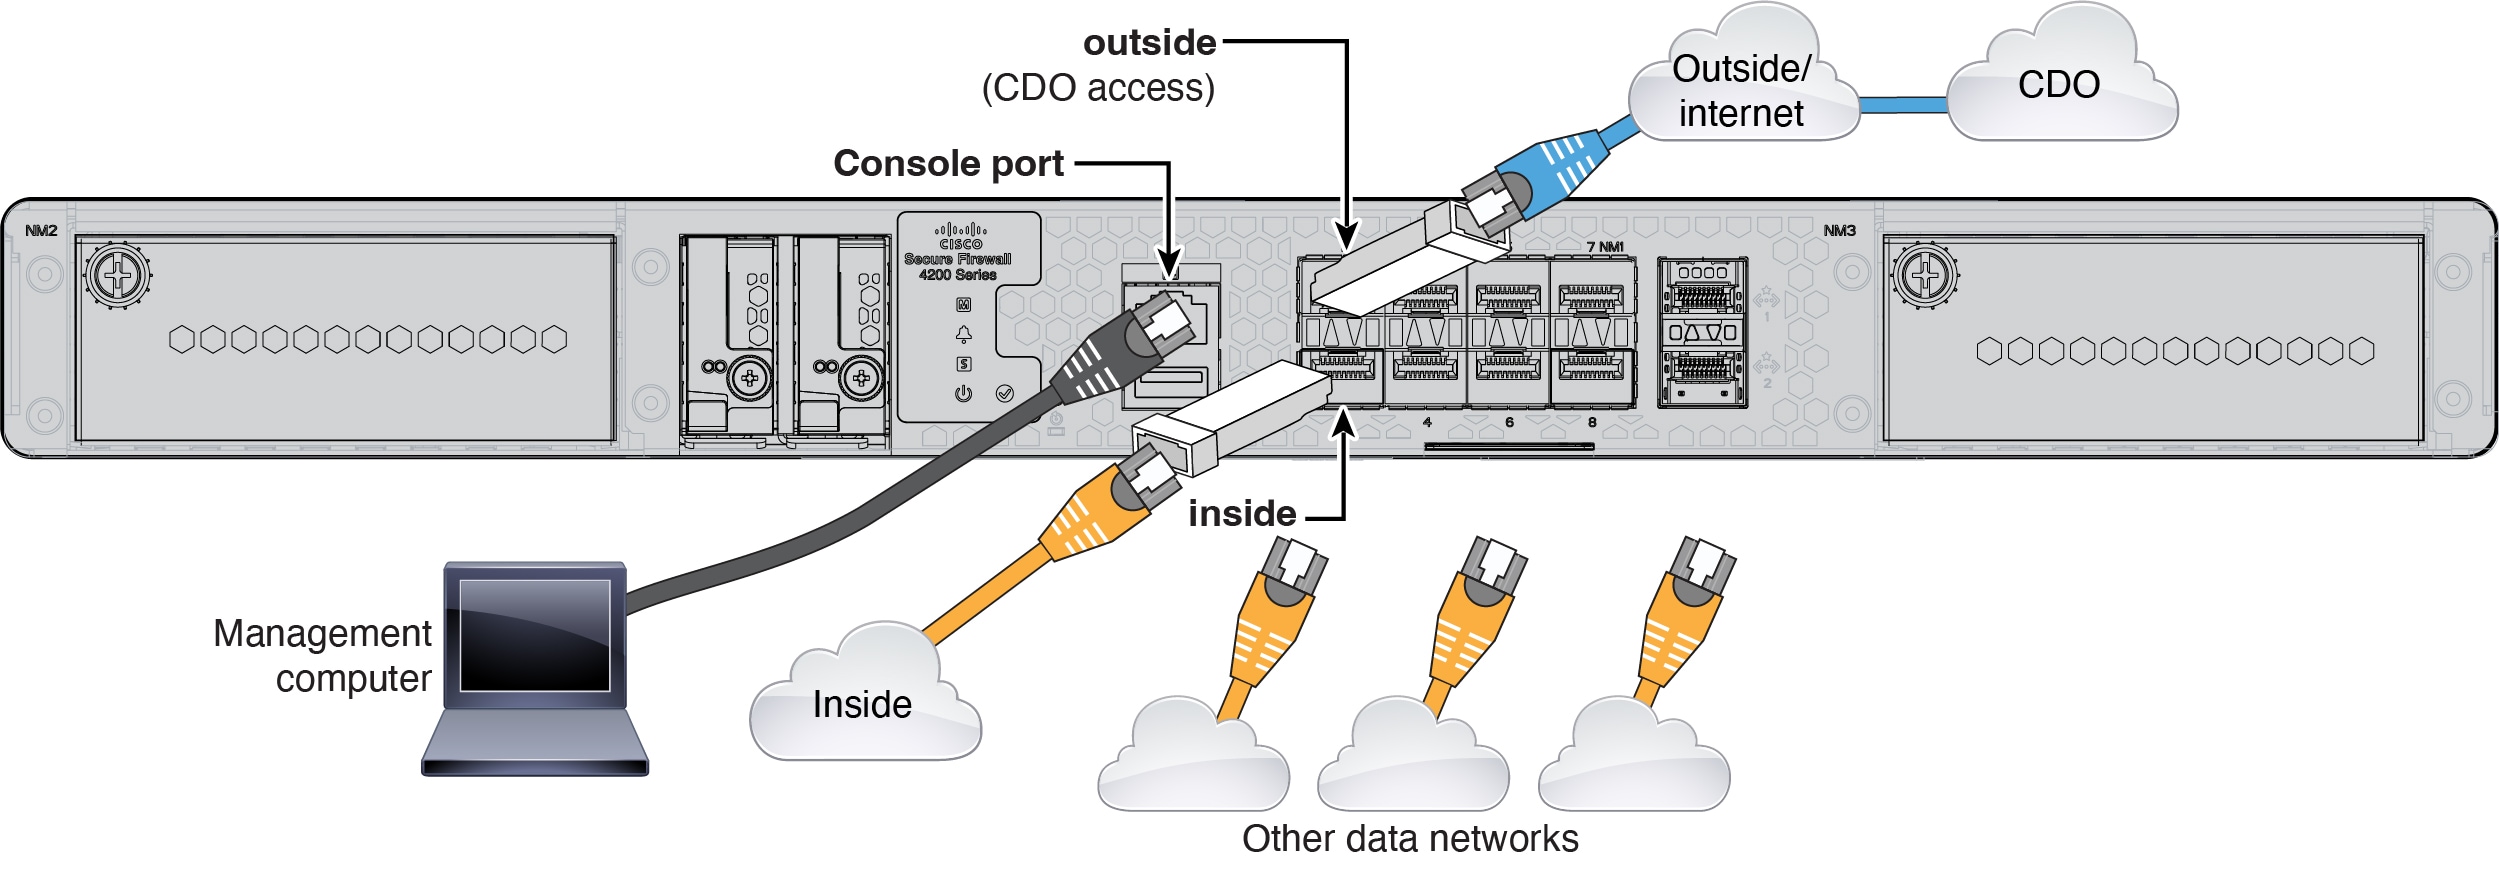
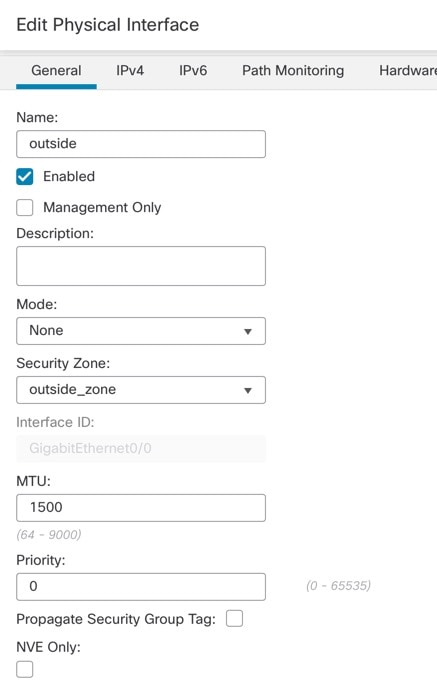
이 설명서는 원격 브랜치 오피스에 대한 시나리오이므로 외부 인터페이스 액세스를 다룹니다. 관리자 액세스는 외부 인터페이스에서 발생하지만 여전히 전용 관리 인터페이스와 관련이 있습니다. 관리 인터페이스는 threat defense 데이터 인터페이스와 별도로 구성된 특수 인터페이스이며 자체 네트워크 설정이 있습니다.
-
데이터 인터페이스에서 관리자 액세스를 활성화하더라도 관리 인터페이스 네트워크 설정은 계속 사용됩니다.
-
모든 관리 트래픽은 계속해서 관리 인터페이스에서 제공되거나 관리 인터페이스로 전송됩니다.
-
데이터 인터페이스에서 관리자 액세스를 활성화하면 threat defense는 수신 인터페이스를 백플레인을 통해 관리 인터페이스로 전달합니다.
-
발신 관리 트래픽의 경우 관리 인터페이스는 백플레인을 통해 데이터 인터페이스로 트래픽을 전달합니다.
관리자 액세스 요구 사항
데이터 인터페이스에서의 관리자 액세스에는 다음과 같은 제한이 있습니다.
-
물리적 데이터 인터페이스에서만 관리자 액세스를 활성화할 수 있습니다. 하위 인터페이스 또는 EtherChannel은 사용할 수 없습니다.또한 management center를 사용하여 리던던시(redundancy)를 위해 단일 보조 인터페이스에서 관리자 액세스를 활성화할 수 있습니다.
-
이 인터페이스는 관리 전용일 수 없습니다.
-
라우팅 인터페이스를 사용하는 라우팅 방화벽 모드 전용입니다.
-
PPPoE는 지원되지 않습니다. ISP에 PPPoE가 필요한 경우 threat defense와 WAN 모뎀 간에 PPPoE를 지원하는 라우터를 설치해야 합니다.
-
인터페이스는 전역 VRF에만 있어야 합니다.
-
SSH는 데이터 인터페이스에 대해 기본적으로 활성화되어 있지 않으므로 나중에 management center를 사용하여 SSH를 활성화해야 합니다. 관리 인터페이스 게이트웨이가 데이터 인터페이스로 변경되므로, configure network static-routes 명령을 사용하여 관리 인터페이스에 대한 고정 경로를 추가하지 않는 한 원격 네트워크에서 관리 인터페이스로 SSH 연결할 수도 없습니다.
-
별도의 관리 및 이벤트 전용 인터페이스를 사용할 수 없습니다.
-
클러스터링은 지원되지 않습니다. 이 경우에는 관리 인터페이스를 사용해야 합니다.
고가용성 요구 사항
디바이스 고가용성이 있는 데이터 인터페이스를 사용하는 경우 다음 요구 사항을 참조하십시오.
-
관리자 액세스를 위해 두 디바이스에서 동일한 데이터 인터페이스를 사용합니다.
-
이중화 관리자 액세스 데이터 인터페이스는 지원되지 않습니다.
-
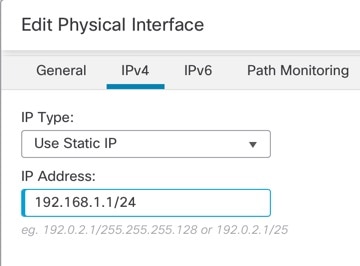
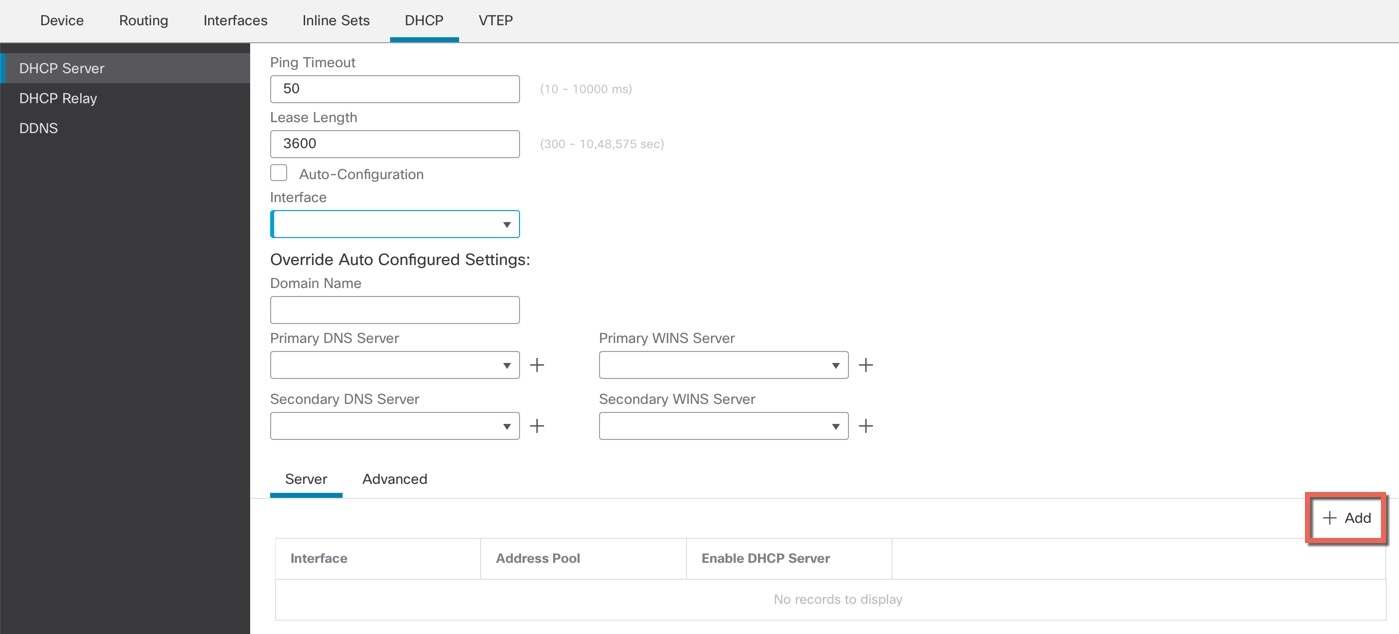
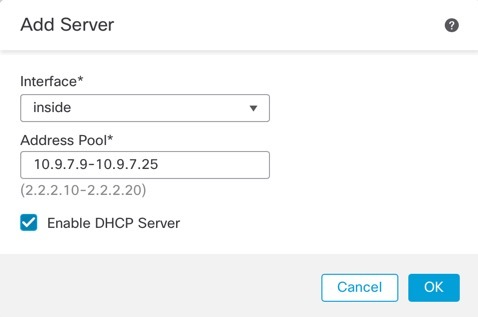
DHCP를 사용할 수 없습니다. 정적 IP 주소만 지원됩니다. DDNS 및 제로 터치 프로비저닝를 포함하여 DHCP에 의존하는 기능은 사용할 수 없습니다.
-
동일한 서브넷에 서로 다른 고정 IP 주소가 있어야 합니다.
-
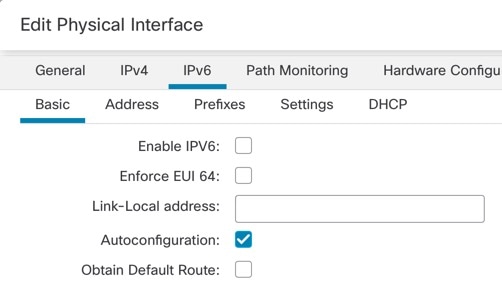
IPv4 또는 IPv6을 사용하십시오. 둘 다 설정할 수 없습니다.
-
동일한 관리자 구성(configure manager add 명령)을 사용하여 연결이 동일한지 확인하십시오.
-
장애 조치 또는 상태 링크로 데이터 인터페이스를 사용할 수 없습니다.


 )
)
 피드백
피드백