Cisco UCS DirectorOpen Automation の手順書、リリース 6.0
偏向のない言語
この製品のマニュアルセットは、偏向のない言語を使用するように配慮されています。このマニュアルセットでの偏向のない言語とは、年齢、障害、性別、人種的アイデンティティ、民族的アイデンティティ、性的指向、社会経済的地位、およびインターセクショナリティに基づく差別を意味しない言語として定義されています。製品ソフトウェアのユーザーインターフェイスにハードコードされている言語、RFP のドキュメントに基づいて使用されている言語、または参照されているサードパーティ製品で使用されている言語によりドキュメントに例外が存在する場合があります。シスコのインクルーシブランゲージに対する取り組みの詳細は、こちらをご覧ください。
翻訳について
このドキュメントは、米国シスコ発行ドキュメントの参考和訳です。リンク情報につきましては、日本語版掲載時点で、英語版にアップデートがあり、リンク先のページが移動/変更されている場合がありますことをご了承ください。あくまでも参考和訳となりますので、正式な内容については米国サイトのドキュメントを参照ください。
- Updated:
- 2017年6月30日
章のタイトル: レポートの管理
レポートの管理
この章は、次の項で構成されています。
- レポート
- POJO と注釈を使用したレポートの開発
- 表形式レポートの開発
- ドリル可能なレポートの開発
- レポートの登録
- 開発者メニューの有効化
- レポートの場所の指定
- 棒グラフ レポートの開発
- 折れ線グラフ レポートの開発
- 円グラフ レポートの開発
- ヒート マップ レポートの開発
- サマリー レポートの開発
- フォーム レポートの開発
- レポートの改ページの管理
レポート
Open Automation レポートは、データを表示したりデータを取得するためにアップロードされたモジュールの UI で使用されます。
2 種類の方法で独自のレポートを作成できます。最も簡単な方法は、Plain Old Java Object(POJO)と注釈を使用する手法です。さらに高度な手法としては、TabularReportGeneratorIf インターフェイスをプログラムによって実装する方法があります。
レポートを開発する際は、POJO ベースの手法を使うか、プログラムによってレポートを生成するかを決定する必要があります。また、ドリル ダウン レポート(POJO とプログラムによる手法のいずれでも可能)を含めるかどうかも決定する必要があります。
独自のレポートの作成に関する Open Automation のマニュアルに、表形式と表形式以外のレポートを作成する手順が記載されています。この文脈における表形式以外のレポートには、棒グラフ、折れ線グラフ、円グラフ、ヒート マップ、サマリー レポート、および「フォーム レポート」が含まれます。フォーム レポートは、レポートのスペース(つまり、UI 内のタブ全体のスペース)を占有するフォームです。
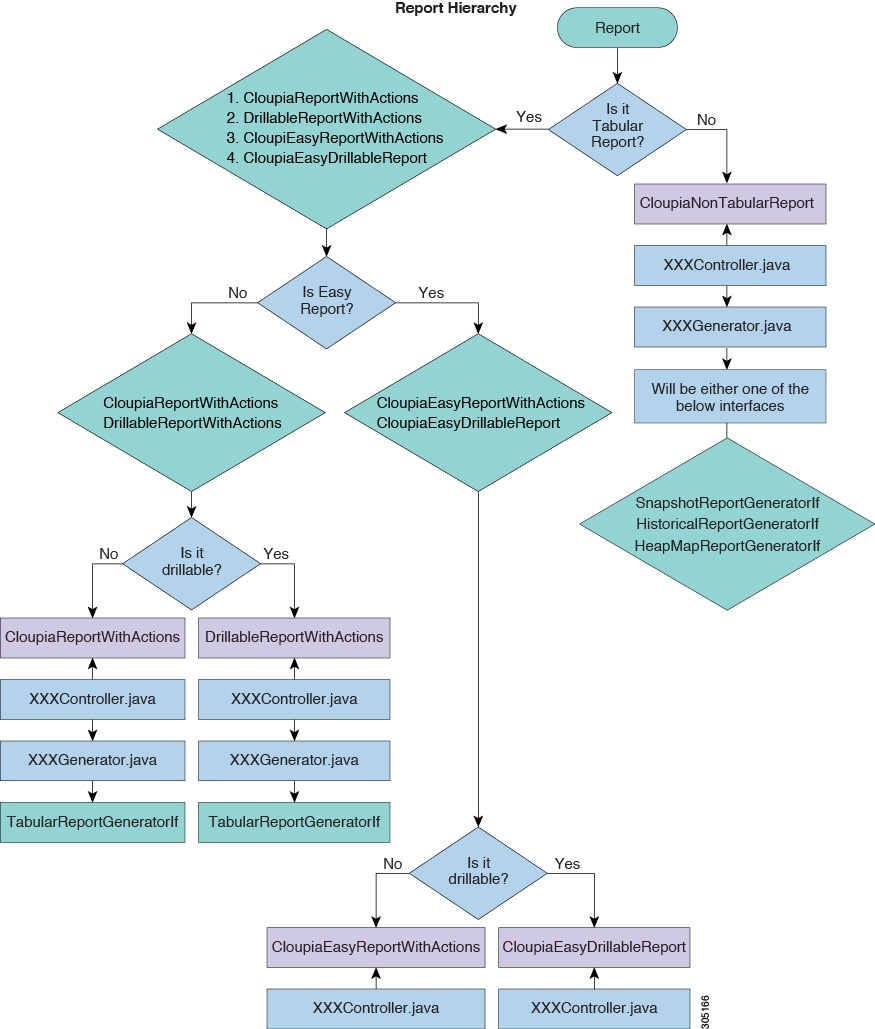
 (注) | 表形式レポートに関する情報が基本です。表形式レポートを作成するための手順が表形式以外のレポートを作成する基礎になっています。 |
POJO と注釈を使用したレポートの開発
次のクラスを使用して、POJO ベースのレポートを作成できます。
レポートを作成するには、持続化のために開発された Java Data Object(JDO)POJO を使用して、注釈をいくつか追加します。レポートは、UI に表示できます。
ReportableIf の実装
ユーザが述語を返す getInstanceQuery メソッドを使用して、そのメソッドがレポートに表示したくない POJO の任意のインスタンスを除去するためにフレームワークで使用される場合、DummySampleImpl クラスは ReportableIf インターフェイスを実装します。
@PersistenceCapable(detachable = "true")
public class DummySampleImpl implements ReportableIf {
@Persistent
private String accountName;
@ReportField(label="Name")
@Persistent
private String name;
}
CloupiaEasyReportWithActions の拡張
CloupiaEasyReportWithActions クラスを拡張し、レポート名(レポートを取得するために一意なもの)、データ ソース(pojo クラス)、およびレポート ラベル(UI に表示されるもの)を提供してレポートを取得します。getActions() メソッドからアクション オブジェクトを返すことによってアクションをこのレポートに割り当てることができます。
public class DummySampleReport extends CloupiaEasyReportWithActions {
//Unique report name that use to fetch report, report label use to show in UI
and dbSource use to store data in CloupiaReport object.
private static final String name = "foo.dummy.interface.report";
private static final String label = "Dummy Interfaces"; private static final
Class dbSource =
DummySampleImpl.class;
public DummySampleReport() { super(name, label, dbSource);
}
@Override
public CloupiaReportAction[] getActions() {
// return the action objects,if you don’t have any action then simply return
null.
}
}
DummySampleReport レポートを UI の getReport セクションのモジュール クラスに登録します。
表形式レポートの開発
例として、com.cloupia.feature.foo.reports.DummyVLANsReport、および com.cloupia.feature.foo.reports.DummyVLANsReportImpl を参照してください。
表形式のレポート
DummyReportImpl クラスは TabularReportGeneratorIf インターフェイスを実装しています。レポートに表示するデータについてより細かなコントロールが必要な場合は、このアプローチを使用して、TabularReportGeneratorIf インターフェイスを実装してレポートを作成します。
public class DummyReportImpl implements TabularReportGeneratorIf
{
private static Logger logger = Logger.getLogger(DummyReportImpl.class);
@Override
public TabularReport getTabularReportReport(ReportRegistryEntry reportEntry,
ReportContext context) throws Exception {
TabularReport report = new TabularReport();
// current system time is taking as report generated time, setting unique
report name and the context of report
report.setGeneratedTime(System.currentTimeMillis());
report.setReportName(reportEntry.getReportLabel());
report.setContext(context);
//TabularReportInternalModel contains all the data you want to show in report
TabularReportInternalModel model = new TabularReportInternalModel();
model.addTextColumn("Name", "Name"); model.addTextColumn("VLAN ID", "VLAN
ID"); model.addTextColumn("Group", "Assigned To Group");
model.completedHeader(); model.updateReport(report);
return report;
}
}
public class DummySampleReport extends CloupiaReportWithActions {
private static final String NAME = "foo.dummy.report"; private static final
String LABEL = "Dummy Sample";
//Returns the implementation class
@Override
public Class getImplementationClass() { return DummyReportImpl.class;
}
//Returns the report label use to display as report name in
UI
@Override
public String getReportLabel() { return LABEL;
}
//Returns unique report name to get report
@Override
public String getReportName() { return NAME;
}
//For leaf report it should returns as false
@Override
public boolean isEasyReport() { return false;
}
//For drilldown report it should return true
@Override
public boolean isLeafReport() { return true;
}
}
UI でレポートを表示するには、システムにレポートを登録します。
ドリル可能なレポートの開発
他のレポート内にネストされているレポートやドリル ダウンでのみアクセス可能なレポートは、ドリル可能なレポートと呼ばれます。ドリル可能なレポートは、表形式のレポートのみに適用できます。
レポート データ ソースは、POJO と注釈のアプローチによって実装される必要があります。false を返すように isLeafReport API をオーバーライドする必要があります。レポートは thecom.cloupia.service.cIM.inframgr.reports.simplified.CloupiaEasyDrillableReport クラスを拡張する必要があります。レポート データ ソースは TabularReportGeneratorIf インターフェイスを使用して実装する必要があります。レポートは thecom.cloupia.service.cIM.inframgr.reports.simplified.DrillableReportWithA ctions クラスを拡張する必要があります。どちらのクラスの場合も、ユーザがベース レポートをドリル ダウンすると表示されるレポートのインスタンスを指定する必要があります。getDrillDownReports() メソッドが呼び出されるたびに、同じインスタンスが返される必要があります。com.cloupia.feature.foo.reports.DummyAccountMgmtReport の場合のように、レポートの配列を初期化して、それらをメンバー変数として宣言する必要があります。
-
ドリルダウン コンテキスト用のレポート レジストリを追加します。詳細については、レポート コンテキストの登録を参照してください。
例: ReportContextRegistry.getInstance().register(FooConstants. DUMMY_CONTEXT_ONE_DRILLDOWN, FooConstants. DUMMY_CONTEXT_ONE_ DRILLDOWN _LABEL);
-
親レポートでは、前の手順のようにレポート レジストリで定義されるドリルダウン コンテキスト(たとえば DUMMY_CONTEXT_ONE_ DRILLDOWN)を返すように getContextLevel() クラスをオーバーライドします。
例: @Override public int getContextLevel() { DynReportContext context = ReportContextRegistry.getInstance().getContextByName(FooConstants. DUMMY_CONTEXT_ONE_ DRILLDOWN); logger.info("Context " + context.getId() + " " + context.getType()); return context.getType(); } -
ドリルダウン子レポートでは、レポート レジストリで定義されるドリルダウン コンテキスト(たとえば DUMMY_CONTEXT_ONE_ DRILLDOWN)を参照するように getMapRules() クラスをオーバーライドします。
例: @Override public ContextMapRule[] getMapRules() { DynReportContext context = ReportContextRegistry.getInstance().getContextByName(FooConstants. DUMMY_CONTEXT_ONE_ DRILLDOWN); ContextMapRule rule = new ContextMapRule(); rule.setContextName(context.getId()); rule.setContextType(context.getType()); ContextMapRule[] rules = new ContextMapRule[1]; rules[0] = rule; return rules; }
レポートの登録
レポートを作成する最後のステップは、AbstractCloupiaModule で開発したすべてのコンポーネントを登録することです。createAccountType() と getReports() を実装する必要があります。レポートの新規インスタンスをインスタンス化して返すと、システムに登録できます。
public class FooModule extends AbstractCloupiaModule {
@Override
public CloupiaReport[] getReports() {
CloupiaReport[] reports = new
CloupiaReport[2];
}
}
reports[0] = new SampleReport(); reports[1] = new FooAccountSampleReport
();
return reports;
レポート コンテキストの登録
アカウント タイプのメイン レポート コンテキストを定義し、登録する必要があります。アカウント タイプのトップ レベルのレポートは、このコンテキストに関連付けられます。
次のコード スニペットは、レポート コンテキストの登録方法を示しています。
ReportContextRegistry.getInstance().register(FooConstants.INFRA_ACCOUNT_TYPE, FooConstants.INFRA_ACCOUNT_LABEL);
トップ レベルのレポートでは、コンテキスト ID を解析し、クエリ フィルタ条件を生成するためのカスタム クエリ ビルダーを実装することが必要になる場合があります。このような場合、レポート内に次のコードが必要です。
this.setQueryBuilder (new FooQueryBuilder ());
カスタム クエリ ビルダーを構築する方法の詳細については、FooQueryBuilder.java クラスを参照してください。ドリルダウン レポートの各種レポート コンテキスト レベルを登録できます。詳細については、ドリル可能なレポートの開発 を参照してください。
開発者メニューの有効化
レポートの場所の指定
ユーザ インターフェイスにレポートを表示する正確な場所を指定するには、次の 2 種類の情報を入力する必要があります。
これらの情報を収集するには、Cisco UCS Director に付属のメタデータを使用して開始します。メタデータには、レポートを表示したい場所に最も近いレポートのデータが含まれており、このデータを使用して必要なレポート指定を作成できます。
| ステップ 1 | セッション用の開発者メニューを有効にします。 |
| ステップ 2 | レポートを表示したい場所にある表形式レポートに移動して、[レポートメタデータ(Report Metadata)] をクリックし、[情報(Information)] ウィンドウを表示します。このウィンドウの上部にある [レポートコンテキスト(Report Context)] セクションを確認します。
|
| ステップ 3 | reportContexts.html ファイルから、コンテキスト マップの作成に必要な 2 つ目の情報を取得します。付録 B の資料を参照してください。 reportContexts.html ファイルには、システムに登録されているすべてのレポート コンテキストが含まれています。最初の列にレポート コンテキストの type が示され、2 つ目の列にレポート コンテキストの name が示されます。type がわかっていれば、名前を見つけることができます。たとえば、0 は「global」に対応します。 両方の情報(コンテキスト名とコンテキスト タイプ)がわかっていれば、コンテキスト マップ ルールを作成できます。 |
| ステップ 4 | 次のサンプル コードと同様の詳細情報を使用してコンテキスト マップ ルールをインスタンス化します。 例: ContextMapRule rule = new ContextMapRule();
rule.setContextName("global");
rule.setContextType(0);
ContextMapRule[] rules = new ContextMapRule[1];
rules[0] = rule;
このサンプルでは、引数なしコンストラクタが使用されていることに注意してください。他のコンストラクタは使用しないでください。この場合は、引数なしコンストラクタが適切であり、これらの値は明示的に設定します。 |
レポート指定コードでこれらの新しい値が適切に設定されているか、または、これらの値を返すメソッドがオーバーライドされていれば、想定した場所にレポートを表示できるようになります。
 ヒント | すべての新しいレポートのサンプルが [物理(Physical)] > [ネットワーク(Network)] > [DummyAccount] タブに表示されます。いずれかの行をドリル ダウンすれば、レポートが見つかります。 |
棒グラフ レポートの開発
Open Automation を使用して、棒グラフなどの表形式以外のレポートを作成することができます。棒グラフの作成は単純な表形式レポートの作成と同様であり、同じ基本手順に従う必要があります。棒グラフ レポートの場合は、データはソース クラスによって提供することができます。getSnapshotReport メソッドをオーバーライドし、データ ソースを提供します。対応する値を返すように getReportType および getReportHint APIs をオーバーライドする必要があります。
| ステップ 1 | 次に示す例に従って、CloupiaNonTabularReport を拡張します。 例: public class BarChartReport extends CloupiaNonTabularReport {
private static final string NAME = "foo.dummy.bar.chart.report";
private static final string LABEL = "Dummy Bar Chart";
|
| ステップ 2 | getReportType() と getReportHint() をオーバーライドします。次のコード スニペットを参照してください。 例:
@Override
public int getReportType()
{
    return ReportDefinition.REPORT_TYPE_SNAPSHOT;
}

@Override
public int getReportHint()
{
    return ReportDefiniton.REPORT_HINT_BARCHART;
}
|
| ステップ 3 | 次のコードで示す例に従って独自の棒グラフを実装します。 例:
public class BarChartReportImpl implements SnapshotReportGeneratorIf {

private final int NUM_BARS = 2;
private final String BAR_1 = "bar1";
private final String BAR_2 = "bar2";
|
| ステップ 4 | 棒グラフを作成してカテゴリに登録するには、このセクションのコードで示す例に従います。 例:
ReportNameValuePair[] rnv1 = new ReportNameValuePair [NUM_BARS];
rnv1[0] = new ReportNameValuePair(BAR_1, 5);
rnv1[1] = new ReportNameValuePair(BAR_2, 10);

SnapshotReportCategory cat1 = new SnapshotReportCategory();
cat1.setCategoryName("cat1");
cat1.setNameValuePairs(rnvr1);
|
棒グラフ
public class SampleBarChartReportImpl implements SnapshotReportGeneratorIf {
//In this example , defines the number of bars should be in chart as bar1 nd
bar2 like shown in above snapshot
private final int NUM_BARS = 2; private final String BAR_1 = "bar1"; private
final String BAR_2 = "bar2";
@Override
public SnapshotReport getSnapshotReport(ReportRegistryEntry reportEntry,
ReportContext context) throws Exception
{
SnapshotReport report = new SnapshotReport(); report.setContext(context);
report.setReportName(reportEntry.getReportLabel());
report.setNumericalData(true); report.setValueAxisName("Value Axis Name");
report.setPrecision(0);
chart
// setting the report name value pair for the bar
ReportNameValuePair[] rnv1 = new
ReportNameValuePair[NUM_BARS];
rnv1[0] = new ReportNameValuePair(BAR_1, 5); rnv1[1] = new
ReportNameValuePair(BAR_2, 10);
// setting category of report SnapshotReportCategory cat1 = new
SnapshotReportCategory();
cat1.setCategoryName("cat1"); cat1.setNameValuePairs(rnv1);
});
report.setCategories(new SnapshotReportCategory[] { cat1
return report;
}
}
The Report class extends CloupiaNonTabularReport to override the
getReportType() and getReportType() methods to make the report as bar chart.
public class SampleBarChartReport extends CloupiaNonTabularReport
{
private static final String NAME = "foo.dummy.bar.chart.report"; private
static final String LABEL = "Dummy Bar Chart";
// returns the implementation class
@Override
public Class getImplementationClass() { return SampleBarChartReportImpl.class;
}
//The below two methiods are very important to shown as Bar cahrt in the GUI.
//This method returns the report type for bar chart shown below.
@Override
public int getReportType() {
return ReportDefinition.REPORT_TYPE_SNAPSHOT;
}
//This method returns the report hint for bar chart shown below
@Override
public int getReportHint()
{
return ReportDefinition.REPORT_HINT_BARCHART;
}
//bar charts will be display in summary if it returns true
@Override
public boolean showInSummary()
{
return true;
}
}
折れ線グラフ レポートの開発
Open Automation を使用して、折れ線グラフなどの表形式以外のレポートを作成することができます。折れ線グラフは、傾向レポートです。HistoricalDataSeries クラスは、DataSample 配列が特定の期間(fromTime、toTime)内の値のセットである履歴情報を提供します。
折れ線グラフの作成は、単純な表形式レポートの作成と同様であり、同じ基本手順に従う必要があります。
| ステップ 1 | CloupiaNonTabularReport を拡張します。getReportType をオーバーライドして、REPORT_TYPE_HISTORICAL を返します。 |
| ステップ 2 | HistoricalReportGeneratorIf を実装します。折れ線グラフ レポートの場合は、データはソース クラスによって提供することができます。
public class SampleLineChartReportImpl implements HistoricalReportGeneratorIf
{
@Override
public HistoricalReport generateReport(ReportRegistryEntry reportEntry,
ReportContext repContext,String durationName, long fromTime, long toTime)
throws Exception {
HistoricalReport report = new HistoricalReport();
report.setContext(repContext); report.setFromTime(fromTime);
report.setToTime(toTime); report.setDurationName(durationName);
report.setReportName(reportEntry.getReportLabel());
int numLines = 1; HistoricalDataSeries[] hdsList = new
HistoricalDataSeries[numLines];
HistoricalDataSeries line1 = new HistoricalDataSeries();
line1.setParamLabel("param1");
line1.setPrecision(0);
// createDataset1() this method use to create dataset. DataSample[] dataset1 =
createDataset1(fromTime, toTime); line1.setValues(dataset1);
hdsList[0] = line1; report.setSeries(hdsList); return report;
}
//implementation for method createDataset1()
private DataSample[] createDataset1(long start, long end) { long interval =
(end ‐ start) / 5;
long timestamp = start; double yValue = 1.0;
DataSample[] dataset = new DataSample[5]; for (int i=0; i<dataset.length; i++)
{
DataSample data = new DataSample(); data.setTimestamp(timestamp);
data.setAvg(yValue);
timestamp += interval; yValue += 5.0;
dataset[i] = data;
}
return dataset;
}
}
折れ線グラフ レポートは CloupiaNonTabularReport クラスを拡張し、getReportType() メソッドをオーバーライドします。 public class SampleLineChartReport extends CloupiaNonTabularReport {
// report name and report label is defined. private static final String NAME =
"foo.dummy.line.chart.report";
private static final String LABEL = "Dummy Line Chart";
//Returns implementation class
@Override
public Class getImplementationClass() { return
SampleLineChartReportImpl.class;
}
//This method returns report type as shown below
@Override
public int getReportType() {
return ReportDefinition.REPORT_TYPE_HISTORICAL;
}
}
|
円グラフ レポートの開発
Open Automation を使用して、円グラフなどの表形式以外のレポートを作成することができます。一般的に、単一の Open Automation 円グラフでは複数のカテゴリの処理に対応できません。ここで示す手順とサンプル コードは 1 つのカテゴリのみからなる円グラフの作成を意図していることに注意してください。円グラフ用に生成されるデータ セット(後述)は、5 つのスライスを表します。それぞれのスライスの値は (i+1) * 5 として指定されます。
円グラフの作成は、単純な表形式レポートの作成と同様であり、同じ基本手順に従う必要があります。
(注) | 一般的に、単一の Open Automation 円グラフでは複数のカテゴリの処理に対応できません。ここに示す手順とサンプル コードは 1 つのカテゴリと 5 つのスライスからなる円グラフを作成します。 |
public class SamplePieChartReport extends CloupiaNonTabularReport
{
//Returns implementation class
@Override
public Class getImplementationClass() { return SamplePieChartReportImpl.class;
}
//Returns report type for pie chart as shown below
@Override
public int getReportType() {
return ReportDefinition.REPORT_TYPE_SNAPSHOT;
}
//Returns report hint for pie chart as shown below
@Override
public int getReportHint()
{
return ReportDefinition.REPORT_HINT_PIECHART;
}
}
public class SamplePieChartReportImpl implements SnapshotReportGeneratorIf {
@Override
public SnapshotReport getSnapshotReport(ReportRegistryEntry reportEntry,
ReportContext context) throws Exception { SnapshotReport report = new
SnapshotReport(); report.setContext(context);
report.setReportName(reportEntry.getReportLabel());
report.setNumericalData(true); report.setDisplayAsPie(true);
report.setPrecision(0);
//creation of report name value pair goes ReportNameValuePair[] rnv = new
ReportNameValuePair[5]; for (int i = 0; i < rnv.length; i++)
{
(i+1) * 5);
}
rnv[i] = new ReportNameValuePair("category" + i,
//setting of report category goes SnapshotReportCategory cat = new
SnapshotReportCategory();
cat.setCategoryName(""); cat.setNameValuePairs(rnv);
report.setCategories(new SnapshotReportCategory[] { cat
});
return report;
}
}
ヒート マップ レポートの開発
ヒート マップは、値をサイズや色で表したセルまたは領域を使用してデータを表現します。単純なヒート マップは情報の瞬間的概要表示を可能にします。
ここで示す手順は、3 つのセクションからなるヒート マップ レポートの作成方法を示します。3 つのセクションのそれぞれが 4 つの等しい「子」セクションに分割されます。ここでは、i が最大 25 のサイズを設定します。開発者は、ここに示すアプローチを拡張することにより、セクションをさらに分割することができます。
ヒート マップ レポートの作成は、単純な表形式レポートの作成と同様であり、同じ基本手順に従う必要があります。ただし、いくつかの重要な違いがあります。ヒート マップを作成するには、次の手順を実行する必要があります。
| ステップ 1 | 次に示す例に従って、CloupiaNonTabularReport を拡張します。 例: public class BarChartReport extends CloupiaNonTabularReport {
private static final string NAME = "foo.dummy.heatmap.report";
private static final string LABEL = "Dummy Heatmap Chart";
|
| ステップ 2 | 3 つのセクションからなり、それぞれのセクションがさらに 4 つのセクションに分割されたヒート マップを作成するには、次のコードで示す例に従います。
例:
for (int i=0; i<3; i++) {
  String parentName = "parent" + i;
  HeatMapCell root = new HeatMapCell();
  root.set.Label(parentName);
  root.setUnUsedChildSize(0.0);

  //create child cells within parent cell
  HeatMapCell[] childCells = new HeatMapCell[4];
  for (int j=0; j<4; j++) {
    HeatMapCell child = new HeatMapCell();
    child.setLabel(parentName + "child" + j);
    child.stValue((j+1)*25); //sets color, the color used
    //for each section is relative, there is a scale in the UI
    child.setSize(25);  //sets weight
    childCells[j] = child;
  }
  root.setChildCells(childCells);
  cells.add(root);
}
|
正常に動作するヒートマップ コードの他の例については、com.cloupia.feature.foo.heatmap.DummyHeatmapReport と com.cloupia.feature.foo.heatmap.DummyHeatmapReportImpl を参照してください。
サマリー レポートの開発
Open Automation を使用して、独自のサマリー レポートを作成することができます。サマリー レポートは、表形式以外のレポートと考えられます。これはサマリー レポートという 1 つの機能ですが、このレポートをサマリー パネルに表示するかどうかを指定できます。
サマリー レポートの作成は、単純な表形式レポートの作成と同様であり、同じ基本手順に従う必要があります。ただし、いくつかの重要な違いがあります。サマリー レポートを作成するには、次の手順を実行する必要があります。
| ステップ 1 | CloupiaNonTabularReport を拡張するには、ここに示す例に従ってください。 例: public class DummySummaryReport extends CloupiaNonTabularReport {
private static final string NAME = "foo.dummy.summary.report";
private static final string LABEL = "Dummy Summary";
|
| ステップ 2 | このコード スニペットを使用して、getReportType() と getReportHint() をオーバーライドします。 例:
@Override
public int getReportType()
{
    return ReportDefinition.REPORT._TYPE_SUMMARY;
}

/**
* @return report hint
*/
@Override
public int getReportHint()
{
    return ReportDefiniton.REPORT_HINT_VERTICAL_TABLE_WITH_GRAPHS;
}
|
| ステップ 3 | データの分類方法を定義します。 例:
model.addText("table one key one", "table one property one", DUMMY_TABLE_ONE);
model.addText("table one key two", "table one property two", DUMMY_TABLE_ONE);

model.addText("table two key one", "table two property one", DUMMY_TABLE_TWO);
model.addText("table two key two", "table two property two", DUMMY_TABLE_TWO);
|
| ステップ 4 | オプション:サマリー パネルにグラフやチャートを表示するには、ここに示すコード例に従ってください。
サマリー パネルにチャートを表示する場合は、サマリー チャート レポートでこのコードを使用します。既定では、このパネルにレポートは表示されません。詳細については、棒グラフのトピックを参照してください。 例:
//NOTE: If you want this chart to show up in a summary report, you need
//to make sure that this is set to true; by default it is false.
@Override
public boolan showInSummary()
{
    return true;
}
|
正常に動作するサマリー レポート コードの他の例については、com.cloupia.feature.foo.summary.DummySummaryReport と com.cloupia.feature.foo.summary.DummySummaryReportImpl を参照してください。
フォーム レポートの開発
Open Automation フォーム フレームワークを使用して、レポートのスペースを占有するフォームを作成できます。UI 内のタブ全体のスペース(通常はレポート用に予約されている)を使い切るこのようなフォーム レポートは「コンフィギュレーション フォーム」と呼ばれています。フォーム レポートは表形式以外のレポートと考えられます。開発者にとって、フォーム レポートはレポート アクションと似ています。
フォーム レポートの作成は、単純な表形式レポートの作成と同様であり、同じ基本手順に従う必要があります。ただし、いくつかの重要な違いがあります。
| ステップ 1 | CloupiaNonTabularReport を拡張するには、ここに示す例に従ってください。 例: public class DummyFormReport extends CloupiaNonTabularReport {
private static final string NAME = "foo.dummy.form.chart.report";
private static final string LABEL = "Dummy Form Report";
|
| ステップ 2 | このコード スニペットを参照しながら getReportType と isManagementReport をセットアップします。 isManagementReport では必ず true を返します。false を返すと、UI にフォームが表示されません。 例:
@Override
public int getReportType()
{
    return ReportDefinition.REPORT_TYPE_CONFIG_FORM;
}

@Override
public boolean isManagementReport()
{
    return true;
}
|
| ステップ 3 | CloupiaPageAction クラスを拡張して、フォーム レイアウトをトリガーするアクションを定義します。 フォーム レポートの場合は、レポート実装クラスが他のレポート実装と異なります。 例:
@override
public void definePage(Page page, ReportContext context) {
  //This is where you define the layout of your action.
  //The easiest way to do this is to use this "bind" method.
  //Since I already have my form object, I just need to provide
  //a unique ID and the POJO itself. The framework will handle all the other details.
  page.bind(formId, DummyFormReportObject.class);
  //A common request is to hide the submit button which normally comes for free with
  //any form. In this particular case, because this form will show as a report,
  //I would like to hide the submit button,
  // which is what this line demonstrates
  page.setSubmitButton("");
}
ユーザが UI で [送信(Submit)] ボタンをクリックすると、メソッド validatePageDate(次のステップを参照)が呼び出されます。 |
| ステップ 4 | このコード例で示すように validatePageDate をセットアップします。
例:
@Override
public int validatePageData(Page page, report Context context,
WizardSession session) throws exception {
  return PageIf.STATUS_OK;
}
|
正常に動作するフォーム レポート コードの他の例については、以下を参照してください。
レポートの改ページの管理
Cisco UCS Director は、前後の矢印リンクを使用して、複数のページにまたがって分割されたデータを管理するための CloupiaReportWithActions および PaginatedReportHandler クラスを提供しています。
改ページ表形式のレポートを実装するには、次の 3 つのクラスを実装します。
| ステップ 1 | レポート ファイルに CloupiaReportWithActions.java を拡張し、getPaginationModelClass および getPaginationProvider メソッドをオーバーライドします。
//Tabular Report Source class which provides data for the table
@Override
public Class getPaginationModelClass() { return DummyAccount.class;
}
//New java file to be implemented for handling the pagination support.
@Override
public Class getPaginationProvider() { return FooAccountReportHandler.class;
}
Override the return type of the isPaginated method as true.
@Override
public boolean isPaginated() { return true;
}
|
| ステップ 2 | getReportHint メソッドの戻りタイプを ReportDefinition REPORT_HINT_PAGINATED_TABLE としてオーバーライドし、改ページ レポートを取得します。
@Override
public int getReportHint(){
return ReportDefinition.REPORT_HINT_PAGINATED_TABLE;
}
|
| ステップ 3 | FooAccountReportHandler ハンドラに PaginatedReportHandler.java を拡張し、appendContextSubQuery メソッドをオーバーライドします。
	@Override
public Query appendContextSubQuery(ReportRegistryEntry
entry,TabularReportMetadata md, ReportContext rc, Query query)
{
logger.info("entry.isPaginated():::::"+entry.isPaginated())
;
String contextID = rc.getId();
if (contextID != null && !contextID.isEmpty()) { String str[] =
contextID.split(";"); String accountName = str[0];
logger.info("paginated context ID = " + contextID); int mgmtColIndex =
entry.getManagementColumnIndex(); logger.info("mgmtColIndex :: " +
mgmtColIndex); ColumnDefinition[] colDefs = md.getColumns(); ColumnDefinition
mgmtCol = colDefs[mgmtColIndex]; String colId = mgmtCol.getColumnId();
logger.info("colId :: " + colId);
//sub query builder builds the context id sub query (e.g. id = 'xyz')
QueryBuilder sqb = new QueryBuilder();
//sqb.putParam()
sqb.putParam(colId).eq(accountName);
//qb ands sub query with actual query (e.g. (id = 'xyz') AND ((vmID = 36) AND
//(vdc = 'someVDC')))
if (query == null) {
//if query is null and the id field has actual value, we only want to return
//columnName = value of id
Query q = sqb.get();
return q;
} else {
QueryBuilder qb = new QueryBuilder(); qb.and(query, sqb.get());
return qb.get();
}
} else {
return query;
}
}
|
 フィードバック