vEdgeの双方向フォワーディング検出(BFD)とデータプレーン接続の問題のトラブルシューティング
ダウンロード オプション
偏向のない言語
この製品のドキュメントセットは、偏向のない言語を使用するように配慮されています。このドキュメントセットでの偏向のない言語とは、年齢、障害、性別、人種的アイデンティティ、民族的アイデンティティ、性的指向、社会経済的地位、およびインターセクショナリティに基づく差別を意味しない言語として定義されています。製品ソフトウェアのユーザインターフェイスにハードコードされている言語、RFP のドキュメントに基づいて使用されている言語、または参照されているサードパーティ製品で使用されている言語によりドキュメントに例外が存在する場合があります。シスコのインクルーシブ ランゲージの取り組みの詳細は、こちらをご覧ください。
翻訳について
シスコは世界中のユーザにそれぞれの言語でサポート コンテンツを提供するために、機械と人による翻訳を組み合わせて、本ドキュメントを翻訳しています。ただし、最高度の機械翻訳であっても、専門家による翻訳のような正確性は確保されません。シスコは、これら翻訳の正確性について法的責任を負いません。原典である英語版(リンクからアクセス可能)もあわせて参照することを推奨します。
内容
はじめに
このドキュメントでは、コントロールプレーンの接続後にvEdgeデータプレーン接続の問題について説明しますが、サイト間のデータプレーン接続はありません。
前提条件
要件
Cisco Software Defined Wide Area Network (SDWAN)のソリューションに関する知識があることが推奨されます。
使用するコンポーネント
このドキュメントの内容は、特定のソフトウェアやハードウェアのバージョンに限定されるものではありません。 このドキュメントでは、vEdgeプラットフォームを中心に説明します。
このドキュメントの情報は、特定のラボ環境にあるデバイスに基づいて作成されました。このドキュメントで使用するすべてのデバイスは、クリアな(デフォルト)設定で作業を開始しています。本稼働中のネットワークでは、各コマンドによって起こる可能性がある影響を十分確認してください。
Ciscoエッジルータ(コントローラモードのCisco IOS® XEルータ)については、を参照してください。
コントロールプレーン情報
コントロールのローカルプロパティの確認
vEdge上のWide Area Network (WAN)インターフェイスのステータスを確認するには、show control local-properties wan-interface-listコマンドを使用します。
この出力では、RFC 4787 Network Address Translation (NAT) Typeを確認できます。
vEdgeがNATデバイス(ファイアウォール、ルータなど)の背後にある場合、パブリックおよびプライベートのIPv4アドレス、パブリックおよびプライベートの送信元User Datagram Protocol (UDP)ポートを使用して、データプレーントンネルが構築されます。
また、トンネルインターフェイスの状態、色、および設定されているコントロール接続の最大数も確認できます。
vEdge1# show control local-properties wan-interface-list

 NAT TYPE: E -- indicates End-point independent mapping
           A -- indicates Address-port dependent mapping
           N -- indicates Not learned
           Requires minimum two vbonds to learn the NAT type

           PUBLIC          PUBLIC PRIVATE         PRIVATE          PRIVATE                           MAX   RESTRICT/           LAST        SPI TIME   NAT  VM
INTERFACE  IPv4            PORT   IPv4            IPv6             PORT    VS/VM COLOR        STATE CNTRL  CONTROL/   LR/LB   CONNECTION   REMAINING  TYPE CON
                                                                                                            STUN                                           PRF
---------------------------------------------------------------------------------------------------------------------------------------------------------------
ge0/0      203.0.113.225   4501   10.19.145.2     ::               12386    1/1  gold           up    2    no/yes/no   No/No  7:02:55:13   0:09:02:29  N    5
ge0/1      10.20.67.10     12426  10.20.67.10     ::               12426    0/0  mpls           up    2    yes/yes/no  No/No  0:00:00:01   0:11:40:16  N    5
このデータを使用して、データトンネルの構築方法と、データトンネルの構築時に(ルータの観点から)使用が予想されるポートに関する特定の情報を特定できます。
コントロール接続の確認
データプレーントンネルを形成しない色に、オーバーレイ内のコントローラとの制御接続が確立されていることを確認することが重要です。
それ以外の場合、vEdgeはTransport Locator (TLOC)情報をOverlay Management Protocol (OMP)経由でvSmartに送信しません。
show control connectionsコマンドを使用してそれが動作可能かどうかを検証するには、connectの状態を調べます。
vEdge1# show control connections
                                                                                       PEER                                          PEER                                              CONTROLLER
PEER    PEER PEER            SITE       DOMAIN PEER                                    PRIV  PEER                                    PUB                                               GROUP
TYPE    PROT SYSTEM IP       ID         ID     PRIVATE IP                              PORT  PUBLIC IP                               PORT  LOCAL COLOR     STATE           UPTIME      ID
--------------------------------------------------------------------------------------------------------------------------------------------------------------------------------------------------
vsmart  dtls 10.1.0.3         3          1      203.0.113.13                          12446 203.0.113.13                          12446 gold            up              7:03:18:31  0
vbond   dtls -                0          0      203.0.113.12                          12346 203.0.113.12                          12346 mpls            connect                     0
vmanage dtls 10.1.0.1         1          0      203.0.113.14                          12646 203.0.113.14                          12646 gold            up              7:03:18:31  0
データトンネルを形成していないインターフェイスが接続を試みる場合は、その色でコントロール接続を正常に起動して問題を解決します。
または、トンネルインターフェイスセクションで、選択したインターフェイスのmax-control-connections 0を設定します。
vpn 0
 interface ge0/1
  ip address 10.20.67.10/24
  tunnel-interface
   encapsulation ipsec
   color mpls restrict
   max-control-connections 0
   no allow-service bgp
   allow-service dhcp
   allow-service dns
   allow-service icmp
   no allow-service sshd
   no allow-service netconf
   no allow-service ntp
   no allow-service ospf
   no allow-service stun
  !
  no shutdown
 !
注:同じ目標を達成するために、「no control-connections」コマンドを使用できる場合があります。ただし、このコマンドでは、コントロール接続の最大数は確立されません。このコマンドはバージョン15.4から廃止され、新しいソフトウェアでは使用されません。
オーバーレイ管理プロトコル
OMP TLOCがvEdgeからアドバタイズされることを確認します。
OMP TLOCを送信できません。インターフェイスがそのカラーを使用して制御接続を形成しようとし、コントローラに到達できないためです。
色(データがトンネリングする色)がその特定の色のTLOCをvSmartsに送信するかどうかを確認します。
show omp tlocs advertisedコマンドを使用して、OMPピアに送信されるTLOCを確認します。
例:Colors mplsおよびgold。TLOCはカラーmplsのvSmartに送信されません。
vEdge1# show omp tlocs advertised
C   -> chosen
I   -> installed
Red -> redistributed
Rej -> rejected
L   -> looped
R   -> resolved
S   -> stale
Ext -> extranet
Stg -> staged
Inv -> invalid

                                                                                                                                                PUBLIC           PRIVATE
ADDRESS                                                                      PSEUDO                   PUBLIC                   PRIVATE  PUBLIC  IPV6    PRIVATE  IPV6     BFD
FAMILY   TLOC IP          COLOR            ENCAP  FROM PEER        STATUS    KEY     PUBLIC IP        PORT    PRIVATE IP       PORT     IPV6    PORT    IPV6     PORT     STATUS
----------------------------------------------------------------------------------------------------------------------------------------------------------------------------------
ipv4     10.1.0.5         gold             ipsec  0.0.0.0          C,Red,R   1       203.0.113.225    4501    10.19.145.2      12386    ::      0       ::       0        up
         10.1.0.2         mpls             ipsec  10.1.0.3          C,I,R     1       10.20.67.20      12386   10.20.67.20      12386    ::      0       ::       0        down
         10.1.0.2         blue             ipsec  10.1.0.3          C,I,R     1       198.51.100.187   12406   10.19.146.2      12406    ::      0       ::       0        up
         10.1.0.30         mpls             ipsec  10.1.0.3          C,I,R     1       10.20.67.30      12346   10.20.67.30      12346    ::      0       ::       0        down
         10.1.0.30         gold             ipsec  10.1.0.3          C,I,R     1       192.0.2.129      12386   192.0.2.129      12386    ::      0       ::       0        up
         10.1.0.4         mpls             ipsec  10.1.0.3          C,I,R     1       10.20.67.40      12426   10.20.67.40      12426    ::      0       ::       0        down
         10.1.0.4         gold             ipsec  10.1.0.3          C,I,R     1       203.0.113.226    12386   203.0.113.226    12386    ::      0       ::       0        up
例:Colors mplsおよびgold。両方の色に対してTLOCが送信されます。
vEdge2# show omp tlocs advertised
C   -> chosen
I   -> installed
Red -> redistributed
Rej -> rejected
L   -> looped
R   -> resolved
S   -> stale
Ext -> extranet
Stg -> staged
Inv -> invalid

                                                                                                                                                PUBLIC           PRIVATE
ADDRESS                                                                      PSEUDO                   PUBLIC                   PRIVATE  PUBLIC  IPV6    PRIVATE  IPV6     BFD
FAMILY   TLOC IP          COLOR            ENCAP  FROM PEER        STATUS    KEY     PUBLIC IP        PORT    PRIVATE IP       PORT     IPV6    PORT    IPV6     PORT     STATUS
----------------------------------------------------------------------------------------------------------------------------------------------------------------------------------
ipv4     10.1.0.5         gold             ipsec  10.1.0.3          C,I,R     1       203.0.113.225    4501    10.19.145.2      12386    ::      0       ::       0        up
         10.1.0.2         mpls             ipsec  0.0.0.0          C,Red,R   1       10.20.67.20      12386   10.20.67.20      12386    ::      0       ::       0        up
         10.1.0.2         blue             ipsec  0.0.0.0          C,Red,R   1       198.51.100.187   12406   10.19.146.2      12406    ::      0       ::       0        up
         10.1.0.30         mpls             ipsec  10.1.0.3          C,I,R     1       10.20.67.30      12346   10.20.67.30      12346    ::      0       ::       0        up
         10.1.0.30         gold             ipsec  10.1.0.3          C,I,R     1       192.0.2.129      12386   192.0.2.129      12386    ::      0       ::       0        up
         10.1.0.4         mpls             ipsec  10.1.0.3          C,I,R     1       10.20.67.40      12426   10.20.67.40      12426    ::      0       ::       0        up
10.1.0.4 gold ipsec 10.1.0.3 C,I,R 1 203.0.113.226 12386 203.0.113.226 12386 :: 0 :: 0 up 注:ローカルに生成されたコントロールプレーン情報の場合、「FROM PEER」フィールドは0.0.0.0に設定されます。ローカルで発信された情報を検索する場合は、この値に基づいて一致していることを確認します。
vSmartがTLOCを受信してアドバタイズすることを確認します。
TLOCがvSmartにアドバタイズされます。正しいピアからTLOCを受信し、他のvEdgeにアドバタイズすることを確認します。
例:vSmartが10.1.0.2 vEdge1からTLOCを受信します。
vSmart1# show omp tlocs received
C   -> chosen
I   -> installed
Red -> redistributed
Rej -> rejected
L   -> looped
R   -> resolved
S   -> stale
Ext -> extranet
Stg -> staged
Inv -> invalid

                                                                                                                                                PUBLIC           PRIVATE
ADDRESS                                                                      PSEUDO                   PUBLIC                   PRIVATE  PUBLIC  IPV6    PRIVATE  IPV6     BFD
FAMILY   TLOC IP          COLOR            ENCAP  FROM PEER        STATUS    KEY     PUBLIC IP        PORT    PRIVATE IP       PORT     IPV6    PORT    IPV6     PORT     STATUS
----------------------------------------------------------------------------------------------------------------------------------------------------------------------------------
ipv4     10.1.0.5         gold             ipsec  10.1.0.5         C,I,R     1       203.0.113.225  4501    10.19.145.2      12386    ::      0       ::       0        -
         10.1.0.2         mpls             ipsec  10.1.0.2         C,I,R     1       10.20.67.20      12386   10.20.67.20      12386    ::      0       ::       0        -
         10.1.0.2         blue             ipsec  10.1.0.2         C,I,R     1       198.51.100.187   12406   10.19.146.2      12406    ::      0       ::       0        -
         10.1.0.30        mpls             ipsec  10.1.0.30         C,I,R     1       10.20.67.30      12346   10.20.67.30      12346    ::      0       ::       0        -
         10.1.0.30        gold             ipsec  10.1.0.30         C,I,R     1       192.0.2.129      12386   192.0.2.129      12386    ::      0       ::       0        -
         10.1.0.4         mpls             ipsec  10.1.0.4         C,I,R     1       10.20.67.40      12426   10.20.67.40      12426    ::      0       ::       0        -
         10.1.0.4         gold             ipsec  10.1.0.4         C,I,R     1       203.0.113.226    12386   203.0.113.226    12386    ::      0       ::       0        -
TLOCが表示されない場合、または他のコードがここで表示される場合は、次の点を確認してください。
vSmart-vIPtela-MEX# show omp tlocs received
C   -> chosen
I   -> installed
Red -> redistributed
Rej -> rejected
L   -> looped
R   -> resolved
S   -> stale
Ext -> extranet
Stg -> staged
Inv -> invalid

                                                                                                                                                PUBLIC           PRIVATE
ADDRESS                                                                      PSEUDO                   PUBLIC                   PRIVATE  PUBLIC  IPV6    PRIVATE  IPV6     BFD
FAMILY   TLOC IP          COLOR            ENCAP  FROM PEER        STATUS    KEY     PUBLIC IP        PORT    PRIVATE IP       PORT     IPV6    PORT    IPV6     PORT     STATUS
----------------------------------------------------------------------------------------------------------------------------------------------------------------------------------
ipv4     10.1.0.5         gold             ipsec  10.1.0.5         C,I,R     1       203.0.113.225    4501    10.19.145.2      12386    ::      0       ::       0        -
         10.1.0.2         mpls             ipsec  10.1.0.2         C,I,R     1       10.20.67.20      12386   10.20.67.20      12386    ::      0       ::       0        -
         10.1.0.2         blue             ipsec  10.1.0.2         Rej,R,Inv 1       198.51.100.187   12406   10.19.146.2      12406    ::      0       ::       0        -
         10.1.0.30         mpls             ipsec  10.1.0.30         C,I,R     1       10.20.67.30      12346   10.20.67.30      12346    ::      0       ::       0        -
         10.1.0.30         gold             ipsec  10.1.0.30         C,I,R     1       192.0.2.129      12386   192.0.2.129      12386    ::      0       ::       0        -
         10.1.0.4         mpls             ipsec  10.1.0.4         C,I,R     1       10.20.67.40      12426   10.20.67.40      12426    ::      0       ::       0        -
         10.1.0.4         gold             ipsec  10.1.0.4         C,I,R     1       203.0.113.226    12386   203.0.113.226    12386    ::      0       ::       0        -
TLOCをブロックするポリシーがないことを確認します。
show run policy control-policy - vSmartで、advertisedまたはreceivedとしてTLOCを拒否するtloc-listを探します。
vSmart1(config-policy)# sh config
policy
 lists
  tloc-list SITE20
   tloc 10.1.0.2 color blue encap ipsec
  !
 !
 control-policy SDWAN
  sequence 10
   match tloc
    tloc-list SITE20
   !
   action reject ----> here we are rejecting the TLOC 10.1.0.2,blue,ipsec
   !
  !
  default-action accept
 !
apply-policy
 site-list SITE20
  control-policy SDWAN in -----> the policy is applied to control traffic coming IN the vSmart, it will filter the tlocs before adding it to the OMP table.
注:TLOCが「Rejected」または「Invalid」の場合、他のvEdgeにはアドバタイズされません。
TLOCがvSmartからアドバタイズされるときに、ポリシーによってTLOCがフィルタリングされないことを確認します。TLOCがvSmartで受信されているものの、他のvEdgeでは受信されていないことがわかります。
例1:C、I、RのTLOCでのvSmart
vSmart1# show omp tlocs
C   -> chosen
I   -> installed
Red -> redistributed
Rej -> rejected
L   -> looped
R   -> resolved
S   -> stale
Ext -> extranet
Stg -> staged
Inv -> invalid

                                                                                                                                                PUBLIC           PRIVATE
ADDRESS                                                                      PSEUDO                   PUBLIC                   PRIVATE  PUBLIC  IPV6    PRIVATE  IPV6     BFD
FAMILY   TLOC IP          COLOR            ENCAP  FROM PEER        STATUS    KEY     PUBLIC IP        PORT    PRIVATE IP       PORT     IPV6    PORT    IPV6     PORT     STATUS
----------------------------------------------------------------------------------------------------------------------------------------------------------------------------------
ipv4     10.1.0.5         mpls             ipsec  10.1.0.5         C,I,R     1       10.20.67.10      12406   10.20.67.10      12406    ::      0       ::       0        -
         10.1.0.5         gold             ipsec  10.1.0.5         C,I,R     1       203.0.113.225    4501    10.19.145.2      12386    ::      0       ::       0        -
         10.1.0.2         mpls             ipsec  10.1.0.2         C,I,R     1       10.20.67.20      12386   10.20.67.20      12386    ::      0       ::       0        -
         10.1.0.2         blue             ipsec  10.1.0.2         C,I,R     1       198.51.100.187   12426   10.19.146.2      12426    ::      0       ::       0        -
         10.1.0.30         mpls             ipsec  10.1.0.30         C,I,R     1       10.20.67.30      12346   10.20.67.30      12346    ::      0       ::       0        -
         10.1.0.30         gold             ipsec  10.1.0.30         C,I,R     1       192.0.2.129      12386   192.0.2.129      12386    ::      0       ::       0        -
         10.1.0.4         mpls             ipsec  10.1.0.4         C,I,R     1       10.20.67.40      12426   10.20.67.40      12426    ::      0       ::       0        -
         10.1.0.4         gold             ipsec  10.1.0.4         C,I,R     1       203.0.113.226    12386   203.0.113.226    12386    ::      0       ::       0        -
例2:vEdge1では、vEdge2の青のTLOCが表示されません。MPLS TLOCのみを認識します。
vEdge1# show omp tlocs
C   -> chosen
I   -> installed
Red -> redistributed
Rej -> rejected
L   -> looped
R   -> resolved
S   -> stale
Ext -> extranet
Stg -> staged
Inv -> invalid

                                                                                                                                                PUBLIC           PRIVATE
ADDRESS                                                                      PSEUDO                   PUBLIC                   PRIVATE  PUBLIC  IPV6    PRIVATE  IPV6     BFD
FAMILY   TLOC IP          COLOR            ENCAP  FROM PEER        STATUS    KEY     PUBLIC IP        PORT    PRIVATE IP       PORT     IPV6    PORT    IPV6     PORT     STATUS
----------------------------------------------------------------------------------------------------------------------------------------------------------------------------------
ipv4     10.1.0.5         mpls             ipsec  0.0.0.0          C,Red,R   1       10.20.67.10      12406   10.20.67.10      12406    ::      0       ::       0        up
         10.1.0.5         gold             ipsec  0.0.0.0          C,Red,R   1       203.0.113.225    4501    10.19.145.2      12386    ::      0       ::       0        up
         10.1.0.2         mpls             ipsec  10.1.0.3          C,I,R     1       10.20.67.20      12386   10.20.67.20      12386    ::      0       ::       0        up
         10.1.0.30         mpls             ipsec  10.1.0.3          C,I,R     1       10.20.67.30      12346   10.20.67.30      12346    ::      0       ::       0        up
         10.1.0.30         gold             ipsec  10.1.0.3          C,I,R     1       192.0.2.129      12386   192.0.2.129      12386    ::      0       ::       0        up
         10.1.0.4         mpls             ipsec  10.1.0.3          C,I,R     1       10.20.67.40      12426   10.20.67.40      12426    ::      0       ::       0        up
         10.1.0.4         gold             ipsec  10.1.0.3          C,I,R     1       203.0.113.226    12386   203.0.113.226    12386    ::      0       ::       0        up
ポリシーを確認すると、TLOCがvEdge1に表示されない理由を確認できます。
vSmart1# show running-config policy
policy
 lists
  tloc-list SITE20
   tloc 10.1.0.2 color blue encap ipsec
  !
  site-list SITE10
   site-id 10
  !
 !
 control-policy SDWAN
  sequence 10
   match tloc
    tloc-list SITE20
   !
   action reject
   !
  !
  default-action accept
 !
apply-policy
 site-list SITE10
  control-policy SDWAN out
 !
!
双方向フォワーディング検出
show bfd sessionsコマンドについて
出力で確認すべき重要な項目を次に示します。
vEdge-2# show bfd sessions
                                      SOURCE TLOC      REMOTE TLOC                                      DST PUBLIC                      DST PUBLIC         DETECT      TX
SYSTEM IP        SITE ID  STATE       COLOR            COLOR            SOURCE IP                       IP                              PORT        ENCAP  MULTIPLIER  INTERVAL(msec) UPTIME          TRANSITIONS
-------------------------------------------------------------------------------------------------------------------------------------------------------------------------------------------------------------
10.1.0.5         10       down        blue             gold             10.19.146.2                     203.0.113.225                   4501        ipsec  7           1000           NA              7
10.1.0.30         30       up          blue             gold             10.19.146.2                     192.0.2.129                     12386       ipsec  7           1000           0:00:00:22      2
10.1.0.4         40       up          blue             gold             10.19.146.2                     203.0.113.226                   12386       ipsec  7           1000           0:00:00:22      1
10.1.0.4         40       up          mpls             mpls             10.20.67.10                     10.20.67.40                     12426       ipsec  7           1000           0:00:10:11      0
SYSTEM IP:ピアsystem-ipSOURCE and REMOTE TLOC COLOR:これは、TLOCの送受信が予想される内容を知るために役立ちます。SOURCE IP:これは送信元IPでprivate。NATの背後にいる場合、この情報がここに表示されます(show control local-propertiesを使用することで確認できます)。DST PUBLIC IP:これは、NATの背後にあるかどうかにかかわらず、vEdgeがData Planeトンネルを形成するために使用する宛先です(例:インターネットに直接接続されたvEdge、またはMulti-Protocol Label Switching (MPLS)リンク)。DST PUBLIC PORTリモートvEdgeへのData Planeトンネルを形成するためにvEdgeで使用されるパブリックNAT対応ポート。TRANSITIONS:BFDセッションがステータスを変更した回数(NAからUP、またはその逆)。
show tunnel statisticsコマンド
show tunnel statisticsを使用すると、データプレーントンネルに関する情報を表示できます。vEdge間の特定のIPSECトンネルに対してパケットを送受信するかどうかを決定できます。
これにより、パケットが両端に到着するかどうかを把握し、ノード間の接続の問題を切り分けることができます。
この例では、コマンドを複数回実行すると、「tx-pkts」または「rx-pkts」の値が増えているか、増えていないことがわかります。
ヒント:tx-pktsのカウンタが増加している場合は、ピアにデータを送信します。rx-pktsが増加しない場合は、データがピアから受信されていないことを意味します。この場合は、もう一方の端を確認して、tx-pktsが増加するかどうかを確認します。
                                                                                                                                                       TCP
vEdge2# show tunnel statistics

TUNNEL                                   SOURCE  DEST                                                  TUNNEL                                          MSS
PROTOCOL  SOURCE IP      DEST IP         PORT    PORT   SYSTEM IP    LOCAL COLOR      REMOTE COLOR     MTU     tx-pkts  tx-octets  rx-pkts  rx-octets  ADJUST
---------------------------------------------------------------------------------------------------------------------------------------------------------------
ipsec     172.16.16.147  10.88.244.181   12386   12406  10.1.0.5     public-internet  default          1441    38282    5904968    38276    6440071    1361
ipsec     172.16.16.147  10.152.201.104  12386   63364  10.1.0.0  public-internet  default          1441    33421    5158814    33416    5623178    1361
ipsec     172.16.16.147  10.152.204.31   12386   58851  10.1.0.7     public-internet  public-internet  1441    12746    1975022    12744    2151926    1361
ipsec     172.24.90.129  10.88.244.181   12426   12406  10.1.0.5     biz-internet     default          1441    38293    5906238    38288    6454580    1361
ipsec     172.24.90.129  10.152.201.104  12426   63364  10.1.0.0  biz-internet     default          1441    33415    5157914    33404    5621168    1361
ipsec     172.24.90.129  10.152.204.31   12426   58851  10.1.0.7     biz-internet     public-internet  1441    12750    1975622    12747    2152446    1361

TUNNEL                                   SOURCE  DEST                                                  TUNNEL                                          MSS
PROTOCOL  SOURCE IP      DEST IP         PORT    PORT   SYSTEM IP    LOCAL COLOR      REMOTE COLOR     MTU     tx-pkts  tx-octets  rx-pkts  rx-octets  ADJUST
---------------------------------------------------------------------------------------------------------------------------------------------------------------
ipsec     172.16.16.147  10.88.244.181   12386   12406  10.1.0.5     public-internet  default          1441    39028    6020779    39022    6566326    1361
ipsec     172.16.16.147  10.152.201.104  12386   63364  10.1.0.0  public-internet  default          1441    34167    5274625    34162    5749433    1361
ipsec     172.16.16.147  10.152.204.31   12386   58851  10.1.0.7     public-internet  public-internet  1441    13489    2089069    13487    2276382    1361
ipsec     172.24.90.129  10.88.244.181   12426   12406  10.1.0.5     biz-internet     default          1441    39039    6022049    39034    6580835    1361
ipsec     172.24.90.129  10.152.201.104  12426   63364  10.1.0.0  biz-internet     default          1441    34161    5273725    34149    5747259    1361
ipsec     172.24.90.129  10.152.204.31   12426   58851  10.1.0.7     biz-internet     public-internet  1441    13493    2089669    13490    2276902    1361
もう1つの便利なコマンドは、特定のデータプレーントンネル内で送受信されたBFDパケットの数をチェックするために使用できるshow tunnel statistics bfdです。
vEdge1# show tunnel statistics bfd

                                                                                               BFD   BFD   BFD     BFD
                                                       BFD      BFD                            PMTU  PMTU  PMTU    PMTU
TUNNEL                                  SOURCE  DEST   ECHO TX  ECHO RX  BFD ECHO   BFD ECHO   TX    RX    TX      RX
PROTOCOL  SOURCE IP      DEST IP        PORT    PORT   PKTS     PKTS     TX OCTETS  RX OCTETS  PKTS  PKTS  OCTETS  OCTETS
---------------------------------------------------------------------------------------------------------------------------
ipsec     192.168.109.4  192.168.109.5  4500    4500   0        0        0          0          0     0     0       0
ipsec     192.168.109.4  192.168.109.5  12346   12366  1112255  1112253  186302716  186302381  487   487   395939  397783
ipsec     192.168.109.4  192.168.109.7  12346   12346  1112254  1112252  186302552  186302210  487   487   395939  397783
ipsec     192.168.109.4  192.168.110.5  12346   12366  1112255  1112253  186302716  186302381  487   487   395939  397783
Access List
アクセスリストは、「show bfd sessions」の出力を調べた後の便利で必要な手順です。
プライベートIPとパブリックIPおよびポートが判明したので、SRC_PORT、DST_PORT、SRC_IP、DST_IPに対して照合するAccess Control List (ACL)を作成できます。
これは、送受信されたBFDメッセージの確認に役立ちます。
次に、ACL設定の例を示します。
policy
 access-list checkbfd-out
  sequence 10
   match
    source-ip        192.168.0.92/32
    destination-ip   198.51.100.187/32
    source-port      12426
    destination-port 12426
   !
   action accept
    count bfd-out-to-dc1-from-br1
   !
  !
  default-action accept
 !
 access-list checkbfd-in
  sequence 20
   match
    source-ip        198.51.100.187/32
    destination-ip   192.168.0.92/32
    source-port      12426
    destination-port 12426
   !
   action accept
    count bfd-in-from-dc1-to-br1
   !
  !
  default-action accept
 !
vpn 0
 interface ge0/0
   access-list checkbfd-in in
   access-list checkbfd-out out
  !
 !
!
この例では、ACLは2つのシーケンスを使用します。シーケンス10は、このvEdgeからピアに送信されるBFDメッセージと一致します。シーケンス20はその逆を行います。
送信元(Private)ポートおよび宛先(Public)ポートと照合されます。vEdgeがNATを使用している場合は、正しい送信元ポートと宛先ポートを確認してください。
各シーケンスカウンタのヒットを確認するには、 show policy access-list counters
vEdge1# show policy access-list-counters

NAME      COUNTER NAME               PACKETS  BYTES
-----------------------------------------------------
checkbfd  bfd-out-to-dc1-from-br1    10       2048
          bfd-in-from-dc1-to-br1        0        0
ネットワークアドレス変換
ツールstun-clientを使用してNATマップとフィルタを検出する方法
すべての手順を実行し、NATの背後にいる場合は、次の手順で「UDP NAT Traversal (RFC 4787) Map and Filter」の動作を特定します。
このツールは、ローカルvEdgeの外部IPアドレスがNATデバイスの背後にある場合に、そのvEdgeを検出するために使用されます。
このコマンドは、デバイスのポートマッピングを取得し、オプションでローカルデバイスとサーバ(パブリックサーバ:google stun serverなど)の間のNATに関するプロパティを検出します。
注:詳細については、次を参照してください。
vEdge1# tools stun-client vpn 0 options "--mode full --localaddr 192.168.12.100 12386 --verbosity 2 stun.l.google.com 19302" stunclient --mode full --localaddr 192.168.12.100 stun.l.google.com in VPN 0 Binding test: success
Local address: 192.168.12.100:12386
Mapped address: 203.0.113.225:4501
Behavior test: success
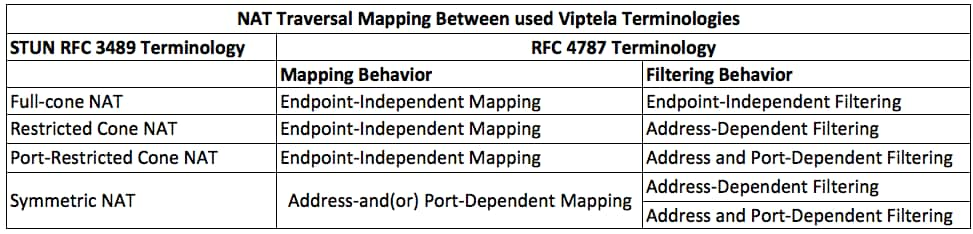
Nat behavior: Address Dependent Mapping
Filtering test: success
Nat filtering: Address and Port Dependent Filtering
新しいバージョンのソフトウェアでは、構文が少し異なる場合があります。
vEdge1# tools stun-client vpn 0 options "--mode full --localaddr 192.168.12.100 --localport 12386 --verbosity 2 stun.l.google.com 19302"
この例では、Google STUNサーバへのUDP送信元ポート12386を使用して、完全なNAT検出テストを実行します。
このコマンドの出力には、NATの動作とRFC 4787に基づくNATフィルタタイプが示されます。
注:tools stunを使用する場合、トンネルインターフェイスでSTUNサービスを許可することを忘れないでください。許可しない場合は機能しません。allow-service stun を使用して、stunデータを渡します。
vEdge1# show running-config vpn 0 interface ge0/0
vpn 0
 interface ge0/0
  ip address 10.19.145.2/30
  !
  tunnel-interface
   encapsulation ipsec
   color gold
   max-control-connections 1
   no allow-service bgp
   allow-service dhcp
   allow-service dns
   no allow-service icmp
   no allow-service sshd
   no allow-service netconf
   no allow-service ntp
   no allow-service ospf
   allow-service stun
  !
  no shutdown
 !
!
次に、STUN用語(フルコーンNAT)とRFC 4787(UDPのNAT動作)のマッピングを示します。
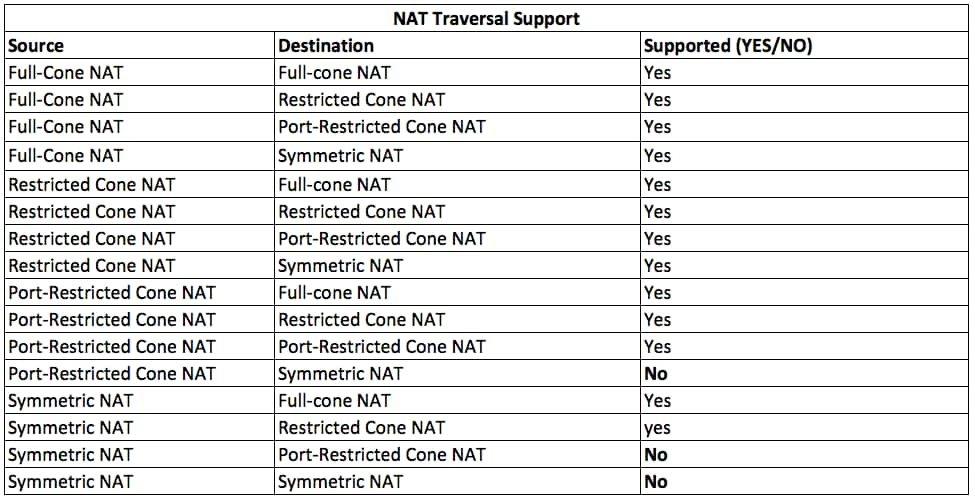
CLIで使用されるデータプレーントンネル「送信」用にサポートされるNATタイプ
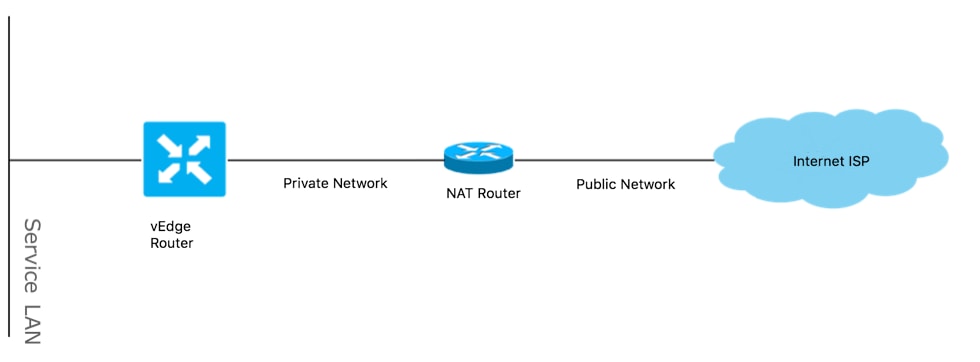
ほとんどの場合、ビジネスインターネットやパブリックインターネットなどのパブリックカラーをインターネットに直接接続できます。
また、vEdge WANインターフェイスと実際のインターネットサービスプロバイダー(ISP)の背後にNATデバイスが存在する場合もあります。
このように、vEdgeはプライベートIPを持つことができ、他のデバイス(ルータ、ファイアウォールなど)はパブリック側のIPアドレスを持つデバイスにすることができます。
NATタイプが正しくない場合、データプレーントンネルの形成を許可しない最も一般的な理由の1つである可能性があります。サポートされているNATタイプは次のとおりです。
ファイアウォール
サポートされていないSourceタイプおよびDestinationタイプではないにもかかわらず、すでにNATをチェックしている場合、ファイアウォールによって、Data Planeトンネルの形成に使用されるポートがブロックされている可能性があります。
データプレーン接続用にファイアウォールで次のポートが開いていることを確認します。vEdge to vEdge Data Plane:
UDP 12346 ~ 13156
vEdgeからコントローラへのコントロール接続用:
UDP 12346 ~ 13156
TCP 23456から24156
データプレーントンネルの接続を成功させるために、これらのポートを開いていることを確認します。
データプレーントンネルに使用される送信元ポートと宛先ポートを確認する際、show tunnel statisticsまたはshow bfd sessions | tabは使用できますが、show bfd sessionsは使用できません。
次のように、送信元ポートは表示されず、宛先ポートのみが表示されます。
vEdge1# show bfd sessions
                                      SOURCE TLOC      REMOTE TLOC                                      DST PUBLIC                      DST PUBLIC         DETECT      TX
SYSTEM IP        SITE ID  STATE       COLOR            COLOR            SOURCE IP                       IP                              PORT        ENCAP  MULTIPLIER  INTERVAL(msec) UPTIME          TRANSITIONS
-------------------------------------------------------------------------------------------------------------------------------------------------------------------------------------------------------------
192.168.30.105   50       up          biz-internet     biz-internet     192.168.109.181                 192.168.109.182                 12346       ipsec  7           1000           1:21:28:05      10
192.168.30.105   50       up          private1         private1         192.168.110.181                 192.168.110.182                 12346       ipsec  7           1000           1:21:26:13      2

vEdge1# show bfd sessions | tab

                                         SRC    DST                    SITE                                     DETECT      TX
SRC IP           DST IP           PROTO  PORT   PORT   SYSTEM IP       ID    LOCAL COLOR   COLOR         STATE  MULTIPLIER  INTERVAL  UPTIME      TRANSITIONS
---------------------------------------------------------------------------------------------------------------------------------------------------------------
192.168.109.181  192.168.109.182  ipsec  12346  12346  192.168.30.105  50    biz-internet  biz-internet  up     7           1000      1:21:28:05  10
192.168.110.181  192.168.110.182  ipsec  12346  12346  192.168.30.105  50    private1      private1      up     7           1000      1:21:26:13  2
注:使用されているSD-WANファイアウォールポートの詳細については、こちらを参照してください。
セキュリティ
ACLカウンタのインバウンドとアウトバウンドが増加している場合は、何回か確認してください show system statistics diff and ensure there are no drops.
vEdge1# show policy access-list-counters

NAME      COUNTER NAME               PACKETS  BYTES
-----------------------------------------------------
checkbfd  bfd-out-to-dc1-from-br1    55       9405
bfd-in-from-dc1-to-br1 54 8478 この出力では、rx_replay_integrity_dropsが show system statistics diff command.
vEdge1#show system statistics diff

 rx_pkts : 5741427
 ip_fwd : 5952166
 ip_fwd_arp : 3
 ip_fwd_to_egress : 2965437
 ip_fwd_null_mcast_group : 26
 ip_fwd_null_nhop : 86846
 ip_fwd_to_cpu : 1413393
 ip_fwd_from_cpu_non_local : 15
 ip_fwd_rx_ipsec : 1586149
 ip_fwd_mcast_pkts : 26
 rx_bcast : 23957
 rx_mcast : 304
 rx_mcast_link_local : 240
 rx_implicit_acl_drops : 12832
 rx_ipsec_decap : 21
 rx_spi_ipsec_drops : 16
 rx_replay_integrity_drops : 1586035
 port_disabled_rx : 2
 rx_invalid_qtags : 212700
 rx_non_ip_drops : 1038073
 pko_wred_drops : 3
 bfd_tx_record_changed : 23
 rx_arp_non_local_drops : 19893
 rx_arp_reqs : 294
 rx_arp_replies : 34330
 arp_add_fail : 263
 tx_pkts : 4565384
 tx_mcast : 34406
 port_disabled_tx : 3
 tx_ipsec_pkts : 1553753
 tx_ipsec_encap : 1553753
 tx_pre_ipsec_pkts : 1553753
 tx_pre_ipsec_encap : 1553753
 tx_arp_replies : 377
 tx_arp_reqs : 34337
 tx_arp_req_fail : 2
 bfd_tx_pkts : 1553675
 bfd_rx_pkts : 21
 bfd_tx_octets : 264373160
 bfd_rx_octets : 3600
 bfd_pmtu_tx_pkts : 78
 bfd_pmtu_tx_octets : 53052
 rx_icmp_echo_requests : 48
 rx_icmp_network_unreach : 75465
 rx_icmp_other_types : 47
 tx_icmp_echo_requests : 49655
 tx_icmp_echo_replies : 48
 tx_icmp_network_unreach : 86849
 tx_icmp_other_types : 7
vEdge1# show system statistics diff

 rx_pkts : 151
 ip_fwd : 157
 ip_fwd_to_egress : 75
 ip_fwd_null_nhop : 3
 ip_fwd_to_cpu : 43
 ip_fwd_rx_ipsec : 41
 rx_bcast : 1
 rx_replay_integrity_drops : 41
 rx_invalid_qtags : 7
 rx_non_ip_drops : 21
 rx_arp_non_local_drops : 2
 tx_pkts : 114
 tx_ipsec_pkts : 40
 tx_ipsec_encap : 40
 tx_pre_ipsec_pkts : 40
 tx_pre_ipsec_encap : 40
 tx_arp_reqs : 1
 bfd_tx_pkts : 40
 bfd_tx_octets : 6800
 tx_icmp_echo_requests : 1
vEdge1# show system statistics diff

 rx_pkts : 126
 ip_fwd : 125
 ip_fwd_to_egress : 58
 ip_fwd_null_nhop : 3
 ip_fwd_to_cpu : 33
 ip_fwd_rx_ipsec : 36
 rx_bcast : 1
 rx_implicit_acl_drops : 1
 rx_replay_integrity_drops : 35
 rx_invalid_qtags : 6
 rx_non_ip_drops : 22
 rx_arp_replies : 1
 tx_pkts : 97
 tx_mcast : 1
 tx_ipsec_pkts : 31
 tx_ipsec_encap : 31
 tx_pre_ipsec_pkts : 31
 tx_pre_ipsec_encap : 31
 bfd_tx_pkts : 32
 bfd_tx_octets : 5442
 rx_icmp_network_unreach : 3
 tx_icmp_echo_requests : 1
 tx_icmp_network_unreach : 3
vEdge1# show system statistics diff

 rx_pkts : 82
 ip_fwd : 89
 ip_fwd_to_egress : 45
 ip_fwd_null_nhop : 3
 ip_fwd_to_cpu : 24
 ip_fwd_rx_ipsec : 22
 rx_bcast : 1
 rx_implicit_acl_drops : 1
 rx_replay_integrity_drops : 24
 rx_invalid_qtags : 2
 rx_non_ip_drops : 14
 rx_arp_replies : 1
 tx_pkts : 62
 tx_mcast : 1
 tx_ipsec_pkts : 24
 tx_ipsec_encap : 24
 tx_pre_ipsec_pkts : 24
 tx_pre_ipsec_encap : 24
 tx_arp_reqs : 1
 bfd_tx_pkts : 23
 bfd_tx_octets : 3908
 rx_icmp_network_unreach : 3
 tx_icmp_echo_requests : 1
 tx_icmp_network_unreach : 3
vEdge1# show system statistics diff

 rx_pkts : 80
 ip_fwd : 84
 ip_fwd_to_egress : 39
 ip_fwd_to_cpu : 20
 ip_fwd_rx_ipsec : 24
 rx_replay_integrity_drops : 22
 rx_invalid_qtags : 3
 rx_non_ip_drops : 12
 tx_pkts : 66
 tx_ipsec_pkts : 21
 tx_ipsec_encap : 21
 tx_pre_ipsec_pkts : 21
 tx_pre_ipsec_encap : 21
 bfd_tx_pkts : 21
 bfd_tx_octets : 3571
まず、vEdgeでrequest security ipsec-rekeyを実行します。次に、show system statistics diffを何度か繰り返し実行して、rx_replay_integrity_dropsが表示されるかどうかを確認します。
実行する場合は、セキュリティ設定を確認します。
vEdge1# show running-config security
security
 ipsec
 authentication-type sha1-hmac ah-sha1-hmac
 !
!
DSCPでマークされたトラフィックに関するISPの問題
デフォルトでは、vEdgeルータからコントローラへのすべての制御および管理トラフィックは、DTLSまたはTLS接続を介して伝送され、DSCP値CS6(10進数で48)でマークされます。
データプレイストンネルトラフィックの場合、vEdgeルータはIPsecまたはGREカプセル化を使用して、互いにデータトラフィックを送信します。
データプレーン障害の検出とパフォーマンス測定のために、ルータは互いに定期的にBFDパケットを送信します。
これらのBFDパケットは、DSCP値CS6(10進数で48)でもマーキングされます。
ISPの観点からは、このタイプのトラフィックはDSCP値がCS6のUDPトラフィックと見なされます。これは、vEdgeルータとSD-WANコントローラが、デフォルトでマーキングされているDSCPを外部IPヘッダーにコピーするためです。
tcpdumpが中継ISPルータで実行されている場合の表示例を次に示します。
14:27:15.993766 IP (tos 0xc0, ttl 64, id 44063, offset 0, flags [DF], proto UDP (17), length 168)
    192.168.109.5.12366 > 192.168.20.2.12346: [udp sum ok] UDP, length 140
14:27:16.014900 IP (tos 0xc0, ttl 63, id 587, offset 0, flags [DF], proto UDP (17), length 139)
    192.168.20.2.12346 > 192.168.109.5.12366: [udp sum ok] UDP, length 111
14:27:16.534117 IP (tos 0xc0, ttl 63, id 0, offset 0, flags [DF], proto UDP (17), length 157)
    192.168.109.5.12366 > 192.168.110.6.12346: [no cksum] UDP, length 129
14:27:16.534289 IP (tos 0xc0, ttl 62, id 0, offset 0, flags [DF], proto UDP (17), length 150)
    192.168.110.6.12346 > 192.168.109.5.12366: [no cksum] UDP, length 122
ここに示すように、すべてのパケットはDSフィールドとも呼ばれるTOSバイト0xc0でマークされます(これは、10進数の192、または2進数の110 000 00と同じです)。
最初の6つの上位ビットは、10進数のDSCPビット値48またはCS6に対応します)。
出力の最初の2つのパケットはコントロールプレーントンネルに対応し、残りの2つはデータプレーントンネルトラフィックに対応します。
パケット長とTOSマークに基づいて、BFDパケット(RX方向とTX方向)であったことが確実に判明します。 これらのパケットはCS6でもマーキングされます。
一部のサービスプロバイダー(特にMPLS L3 VPN/MPLS L2 VPNサービスプロバイダー)は、異なるSLAを維持し、DSCPマークに基づいて異なるクラスのトラフィックを異なる方法で処理できます。
たとえば、DSCP EFとCS6の音声およびシグナリングトラフィックに優先順位を付けるプレミアムサービスがある場合です。
アップリンクの合計帯域幅を超えなくても、優先順位トラフィックはほぼ常にポリシングされるため、このタイプのトラフィックではパケット損失が見られ、そのためBFDセッションもフラッピングする可能性があります。
サービスプロバイダールータ上の専用優先キューが枯渇していて、通常のトラフィック(vEdgeルータから単純なpingを実行した場合など)では廃棄が見られない場合があることが確認されています。
これは、このようなトラフィックがデフォルトのDSCP値0(TOSバイト)でマーキングされるためです(TOSバイト)。
15:49:22.268044 IP (tos 0x0, ttl 62, id 0, offset 0, flags [DF], proto UDP (17), length 142)
    192.168.110.5.12366 > 192.168.109.7.12346: [no cksum] UDP, length 114
15:49:22.272919 IP (tos 0x0, ttl 62, id 0, offset 0, flags [DF], proto UDP (17), length 142)
    192.168.110.5.12366 > 192.168.109.7.12346: [no cksum] UDP, length 114
15:49:22.277660 IP (tos 0x0, ttl 62, id 0, offset 0, flags [DF], proto UDP (17), length 142)
    192.168.110.5.12366 > 192.168.109.7.12346: [no cksum] UDP, length 114
15:49:22.314821 IP (tos 0x0, ttl 62, id 0, offset 0, flags [DF], proto UDP (17), length 142)
    192.168.110.5.12366 > 192.168.109.7.12346: [no cksum] UDP, length 114
しかし同時に、BFDセッションがフラップします。
show bfd history
                                                       DST PUBLIC       DST PUBLIC                                  RX      TX
SYSTEM IP        SITE ID  COLOR            STATE       IP               PORT        ENCAP  TIME                     PKTS    PKTS    DEL
---------------------------------------------------------------------------------------------------------------------------------------
192.168.30.4     13       public-internet  up          192.168.109.4    12346       ipsec  2019-05-01T03:54:23+0200 127     135     0
192.168.30.4     13       public-internet  up          192.168.109.4    12346       ipsec  2019-05-01T03:54:23+0200 127     135     0
192.168.30.4     13       public-internet  down        192.168.109.4    12346       ipsec  2019-05-01T03:55:28+0200 140     159     0
192.168.30.4     13       public-internet  down        192.168.109.4    12346       ipsec  2019-05-01T03:55:28+0200 140     159     0
192.168.30.4     13       public-internet  up          192.168.109.4    12346       ipsec  2019-05-01T03:55:40+0200 361     388     0
192.168.30.4     13       public-internet  up          192.168.109.4    12346       ipsec  2019-05-01T03:55:40+0200 361     388     0
192.168.30.4     13       public-internet  down        192.168.109.4    12346       ipsec  2019-05-01T03:57:38+0200 368     421     0
192.168.30.4     13       public-internet  down        192.168.109.4    12346       ipsec  2019-05-01T03:57:38+0200 368     421     0
192.168.30.4     13       public-internet  up          192.168.109.4    12346       ipsec  2019-05-01T03:58:05+0200 415     470     0
192.168.30.6     13       public-internet  up          192.168.109.4    12346       ipsec  2019-05-01T03:58:05+0200 415     470     0
192.168.30.6     13       public-internet  down        192.168.109.4    12346       ipsec  2019-05-01T03:58:25+0200 464063  464412  0
ここで、npingを使用すると、トラブルシューティングに役立ちます。
vedge2# tools nping vpn 0 options "--tos 0x0c --icmp --icmp-type echo --delay 200ms -c 100 -q" 192.168.109.7
Nping in VPN 0

Starting Nping 0.6.47 ( http://nmap.org/nping ) at 2019-05-07 15:58 CEST
Max rtt: 200.305ms | Min rtt: 0.024ms | Avg rtt: 151.524ms
Raw packets sent: 100 (2.800KB) | Rcvd: 99 (4.554KB) | Lost: 1 (1.00%)
Nping done: 1 IP address pinged in 19.83 seconds
BFDのデバッグ
より詳細な調査が必要な場合は、vEdgeルータでBFDのデバッグを実行します。
Forwarding Traffic Manager(FTM)はvEdgeルータ上のBFD処理を担当するため、debug ftm bfdが必要です。
デバッグ出力はすべて/var/log/tmplog/vdebugファイルに保存されます。これらのメッセージをコンソールに表示する場合は(Cisco IOSのterminal monitorの動作と同様)、monitor start /var/log/tmplog/vdebugを使用します。
ロギングを停止するには、 monitor stop /var/log/tmplog/vdebug
出力は、タイムアウトが原因でダウンしたBFDセッションを検索する方法を次に示します(IPアドレス192.168.110.6のリモートTLOCには到達できなくなります)。
log:local7.debug: May  7 16:23:09 vedge2 FTMD[674]: bfdmgr_session_update_state[1008]: BFD-session TNL 192.168.110.5:12366->192.168.110.6:12346,l-tloc(32771)->r-tloc(32772),TLOC 192.168.30.5:biz-internet->192.168.30.6:public-internet IPSEC: BFD Session STATE update, New_State :- DOWN, Reason :- LOCAL_TIMEOUT_DETECT Observed latency :- 7924, bfd_record_index :- 8, Hello timer :- 1000, Detect Multiplier :- 7
log:local7.debug: May  7 16:23:09 vedge2 FTMD[674]: ftm_proc_tunnel_public_tloc_msg[252]: tun_rec_index 13 tloc_index 32772 public tloc 0.0.0.0/0
log:local7.debug: May  7 16:23:09 vedge2 FTMD[674]: ftm_increment_wanif_bfd_flap[2427]: BFD-session TNL 192.168.110.5:12366->192.168.110.6:12346, : Increment the WAN interface counters by 1
log:local7.debug: May  7 16:23:09 vedge2 FTMD[674]: bfdmgr_session_update_state[1119]: BFD-session TNL 192.168.110.5:12366->192.168.110.6:12346,l-tloc(32771)->r-tloc(32772),TLOC 192.168.30.5:biz-internet->192.168.30.6:public-internet IPSEC BFD session history update, old state 3 new state 1 current  flap count 1 prev_index 1 current 2
log:local7.debug: May  7 16:23:09 vedge2 FTMD[674]: ftm_tloc_add[1140]: Attempting to add TLOC : from_ttm 0 origin remote tloc-index 32772 pub 192.168.110.6:12346 pub v6 :::0 system_ip 192.168.30.6 color 5 spi 333
log:local7.debug: May  7 16:23:09 vedge2 FTMD[674]: bfdmgr_session_set_del_marker_internal[852]: (32771:32772) proto 50 src 192.168.110.5:12366 dst 192.168.110.6:12346 ref_count 1
log:local7.debug: May  7 16:23:09 vedge2 FTMD[674]: bfdmgr_session_set_del_marker_internal[852]: (32770:32772) proto 50 src 192.168.109.5:12366 dst 192.168.110.6:12346 ref_count 1
log:local7.debug: May  7 16:23:09 vedge2 FTMD[674]: bfdmgr_session_create[238]: Attempting BFD session creation. Remote-tloc: tloc-index 32772, system-ip 192.168.30.6, color 5 encap 2from local WAN Interface ge0_0
log:local7.debug: May  7 16:23:09 vedge2 FTMD[674]: bfdmgr_session_clear_delete_marker[828]: (32771:32772) proto 50 src 192.168.110.5:12366 dst 192.168.110.6:12346 ref_count 1
log:local7.debug: May  7 16:23:09 vedge2 FTMD[674]: bfdmgr_session_create[238]: Attempting BFD session creation. Remote-tloc: tloc-index 32772, system-ip 192.168.30.6, color 5 encap 2from local WAN Interface ge0_1
log:local7.debug: May  7 16:23:09 vedge2 FTMD[674]: bfdmgr_session_clear_delete_marker[828]: (32770:32772) proto 50 src 192.168.109.5:12366 dst 192.168.110.6:12346 ref_count 1
log:local7.debug: May  7 16:23:09 vedge2 FTMD[674]: bfdmgr_session_update_sa[1207]: BFD-session TNL 192.168.110.5:12366->192.168.110.6:12346,l-tloc(32771)->r-tloc(32772),TLOC 192.168.30.5:biz-internet->192.168.30.6:public-internet IPSEC: session sa index changed from 484 to 484
log:local7.debug: May  7 16:23:09 vedge2 FTMD[674]: ftm_tloc_add[1653]: BFD (32771:32772) src 192.168.110.5:12366 dst 192.168.110.6:12346 record index 8 ref-count 1 sa-idx 484
log:local7.debug: May  7 16:23:09 vedge2 FTMD[674]: bfdmgr_session_update_sa[1207]: BFD-session TNL 192.168.109.5:12366->192.168.110.6:12346,l-tloc(32770)->r-tloc(32772),TLOC 192.168.30.5:public-internet->192.168.30.6:public-internet IPSEC: session sa index changed from 485 to 485
log:local7.debug: May  7 16:23:09 vedge2 FTMD[674]: ftm_tloc_add[1653]: BFD (32770:32772) src 192.168.109.5:12366 dst 192.168.110.6:12346 record index 9 ref-count 1 sa-idx 485
log:local7.debug: May  7 16:23:09 vedge2 FTMD[674]: bfdmgr_session_update_state[1008]: BFD-session TNL 192.168.109.5:12366->192.168.110.6:12346,l-tloc(32770)->r-tloc(32772),TLOC 192.168.30.5:public-internet->192.168.30.6:public-internet IPSEC: BFD Session STATE update, New_State :- DOWN, Reason :- LOCAL_TIMEOUT_DETECT Observed latency :- 7924, bfd_record_index :- 9, Hello timer :- 1000, Detect Multiplier :- 7
log:local7.debug: May  7 16:23:09 vedge2 FTMD[674]: ftm_proc_tunnel_public_tloc_msg[252]: tun_rec_index 14 tloc_index 32772 public tloc 0.0.0.0/0
log:local7.debug: May  7 16:23:09 vedge2 FTMD[674]: ftm_increment_wanif_bfd_flap[2427]: BFD-session TNL 192.168.109.5:12366->192.168.110.6:12346, : Increment the WAN interface counters by 1
log:local7.debug: May  7 16:23:09 vedge2 FTMD[674]: bfdmgr_session_update_state[1119]: BFD-session TNL 192.168.109.5:12366->192.168.110.6:12346,l-tloc(32770)->r-tloc(32772),TLOC 192.168.30.5:public-internet->192.168.30.6:public-internet IPSEC BFD session history update, old state 3 new state 1 current  flap count 1 prev_index 1 current 2
log:local7.debug: May  7 16:23:09 vedge2 FTMD[674]: ftm_tloc_add[1140]: Attempting to add TLOC : from_ttm 0 origin remote tloc-index 32772 pub 192.168.110.6:12346 pub v6 :::0 system_ip 192.168.30.6 color 5 spi 333
log:local7.debug: May  7 16:23:09 vedge2 FTMD[674]: bfdmgr_session_set_del_marker_internal[852]: (32771:32772) proto 50 src 192.168.110.5:12366 dst 192.168.110.6:12346 ref_count 1
log:local7.debug: May  7 16:23:09 vedge2 FTMD[674]: bfdmgr_session_set_del_marker_internal[852]: (32770:32772) proto 50 src 192.168.109.5:12366 dst 192.168.110.6:12346 ref_count 1
log:local7.debug: May  7 16:23:09 vedge2 FTMD[674]: bfdmgr_session_create[238]: Attempting BFD session creation. Remote-tloc: tloc-index 32772, system-ip 192.168.30.6, color 5 encap 2from local WAN Interface ge0_0
log:local7.debug: May  7 16:23:09 vedge2 FTMD[674]: bfdmgr_session_clear_delete_marker[828]: (32771:32772) proto 50 src 192.168.110.5:12366 dst 192.168.110.6:12346 ref_count 1
log:local7.debug: May  7 16:23:09 vedge2 FTMD[674]: bfdmgr_session_create[238]: Attempting BFD session creation. Remote-tloc: tloc-index 32772, system-ip 192.168.30.6, color 5 encap 2from local WAN Interface ge0_1
log:local7.debug: May  7 16:23:09 vedge2 FTMD[674]: bfdmgr_session_clear_delete_marker[828]: (32770:32772) proto 50 src 192.168.109.5:12366 dst 192.168.110.6:12346 ref_count 1
log:local7.debug: May  7 16:23:09 vedge2 FTMD[674]: bfdmgr_session_update_sa[1207]: BFD-session TNL 192.168.110.5:12366->192.168.110.6:12346,l-tloc(32771)->r-tloc(32772),TLOC 192.168.30.5:biz-internet->192.168.30.6:public-internet IPSEC: session sa index changed from 484 to 484
log:local7.debug: May  7 16:23:09 vedge2 FTMD[674]: ftm_tloc_add[1653]: BFD (32771:32772) src 192.168.110.5:12366 dst 192.168.110.6:12346 record index 8 ref-count 1 sa-idx 484
log:local7.debug: May  7 16:23:09 vedge2 FTMD[674]: bfdmgr_session_update_sa[1207]: BFD-session TNL 192.168.109.5:12366->192.168.110.6:12346,l-tloc(32770)->r-tloc(32772),TLOC 192.168.30.5:public-internet->192.168.30.6:public-internet IPSEC: session sa index changed from 485 to 485
log:local7.debug: May  7 16:23:09 vedge2 FTMD[674]: ftm_tloc_add[1653]: BFD (32770:32772) src 192.168.109.5:12366 dst 192.168.110.6:12346 record index 9 ref-count 1 sa-idx 485
log:local7.debug: May  7 16:23:09 vedge2 FTMD[674]: ftm_send_bfd_msg[499]: Sending BFD notification Down notification to TLOC id 32772
log:local7.debug: May  7 16:23:09 vedge2 FTMD[674]: ftm_tloc_add[1140]: Attempting to add TLOC : from_ttm 1 origin remote tloc-index 32772 pub 192.168.110.6:12346 pub v6 :::0 system_ip 192.168.30.6 color 5 spi 333
log:local7.debug: May  7 16:23:09 vedge2 FTMD[674]: bfdmgr_session_set_del_marker_internal[852]: (32771:32772) proto 50 src 192.168.110.5:12366 dst 192.168.110.6:12346 ref_count 1
log:local7.debug: May  7 16:23:09 vedge2 FTMD[674]: bfdmgr_session_set_del_marker_internal[852]: (32770:32772) proto 50 src 192.168.109.5:12366 dst 192.168.110.6:12346 ref_count 1
log:local7.debug: May  7 16:23:09 vedge2 FTMD[674]: ftm_tloc_add[1285]: UPDATE local tloc
log:local7.debug: May  7 16:23:09 vedge2 FTMD[674]: bfdmgr_session_create[238]: Attempting BFD session creation. Remote-tloc: tloc-index 32772, system-ip 192.168.30.6, color 5 encap 2from local WAN Interface ge0_0
log:local7.debug: May  7 16:23:09 vedge2 FTMD[674]: bfdmgr_session_clear_delete_marker[828]: (32771:32772) proto 50 src 192.168.110.5:12366 dst 192.168.110.6:12346 ref_count 1
log:local7.debug: May  7 16:23:09 vedge2 FTMD[674]: bfdmgr_session_create[238]: Attempting BFD session creation. Remote-tloc: tloc-index 32772, system-ip 192.168.30.6, color 5 encap 2from local WAN Interface ge0_1
log:local7.debug: May  7 16:23:09 vedge2 FTMD[674]: bfdmgr_session_clear_delete_marker[828]: (32770:32772) proto 50 src 192.168.109.5:12366 dst 192.168.110.6:12346 ref_count 1
log:local7.debug: May  7 16:23:09 vedge2 FTMD[674]: bfdmgr_session_update_sa[1207]: BFD-session TNL 192.168.110.5:12366->192.168.110.6:12346,l-tloc(32771)->r-tloc(32772),TLOC 192.168.30.5:biz-internet->192.168.30.6:public-internet IPSEC: session sa index changed from 484 to 484
log:local7.debug: May  7 16:23:09 vedge2 FTMD[674]: ftm_tloc_add[1653]: BFD (32771:32772) src 192.168.110.5:12366 dst 192.168.110.6:12346 record index 8 ref-count 1 sa-idx 484
log:local7.debug: May  7 16:23:09 vedge2 FTMD[674]: bfdmgr_session_update_sa[1207]: BFD-session TNL 192.168.109.5:12366->192.168.110.6:12346,l-tloc(32770)->r-tloc(32772),TLOC 192.168.30.5:public-internet->192.168.30.6:public-internet IPSEC: session sa index changed from 485 to 485
log:local7.debug: May  7 16:23:09 vedge2 FTMD[674]: ftm_tloc_add[1653]: BFD (32770:32772) src 192.168.109.5:12366 dst 192.168.110.6:12346 record index 9 ref-count 1 sa-idx 485
log:local7.info: May  7 16:23:09 vedge2 FTMD[674]: %Viptela-vedge2-ftmd-6-INFO-1400002: Notification: 5/7/2019 14:23:9 bfd-state-change severity-level:major host-name:"vedge2" system-ip:192.168.30.5 src-ip:192.168.110.5 dst-ip:192.168.110.6 proto:ipsec src-port:12366 dst-port:12346 local-system-ip:192.168.30.5 local-color:"biz-internet" remote-system-ip:192.168.30.6 remote-color:"public-internet" new-state:down deleted:false flap-reason:timeout
log:local7.info: May  7 16:23:09 vedge2 FTMD[674]: %Viptela-vedge2-ftmd-6-INFO-1400002: Notification: 5/7/2019 14:23:9 bfd-state-change severity-level:major host-name:"vedge2" system-ip:192.168.30.5 src-ip:192.168.109.5 dst-ip:192.168.110.6 proto:ipsec src-port:12366 dst-port:12346 local-system-ip:192.168.30.5 local-color:"public-internet" remote-system-ip:192.168.30.6 remote-color:"public-internet" new-state:down deleted:false flap-reason:timeout
有効にするもう1つの便利なデバッグは、Tunnel Traffic Manager (TTM) events debug is debug ttm eventsです。
TTMの観点から見たBFD DOWNイベントの外観は次のとおりです。
log:local7.debug: May  7 16:58:19 vedge2 TTMD[683]: ttm_debug_announcement[194]: Received TTM Msg LINK_BFD, Client: ftmd, AF: LINK
log:local7.debug: May  7 16:58:19 vedge2 TTMD[683]: ttm_debug_announcement[413]:     Remote-TLOC: 192.168.30.6 : public-internet : ipsec, Local-TLOC: 192.168.30.5 : biz-internet : ipsec, Status: DOWN, Rec Idx: 13 MTU: 1441, Loss: 77, Latency: 0, Jitter: 0
log:local7.debug: May  7 16:58:19 vedge2 TTMD[683]: ttm_debug_announcement[194]: Received TTM Msg LINK_BFD, Client: ftmd, AF: LINK
log:local7.debug: May  7 16:58:19 vedge2 TTMD[683]: ttm_debug_announcement[413]:     Remote-TLOC: 192.168.30.6 : public-internet : ipsec, Local-TLOC: 192.168.30.5 : public-internet : ipsec, Status: DOWN, Rec Idx: 14 MTU: 1441, Loss: 77, Latency: 0, Jitter: 0
log:local7.debug: May  7 16:58:19 vedge2 TTMD[683]: ttm_debug_announcement[194]: Received TTM Msg BFD, Client: ftmd, AF: TLOC-IPV4
log:local7.debug: May  7 16:58:19 vedge2 TTMD[683]: ttm_debug_announcement[402]:     TLOC: 192.168.30.6 : public-internet : ipsec, Status: DOWN
log:local7.debug: May  7 16:58:19 vedge2 TTMD[683]: ttm_af_tloc_db_bfd_status[234]:   BFD message: I SAY WHAT WHAT tloc 192.168.30.6 : public-internet : ipsec status is 0
log:local7.debug: May  7 16:58:19 vedge2 TTMD[683]: ttm_debug_announcement[194]: Sent TTM Msg TLOC_ADD, Client: ompd, AF: TLOC-IPV4
log:local7.debug: May  7 16:58:19 vedge2 TTMD[683]: ttm_debug_announcement[213]:     TLOC: 192.168.30.6 : public-internet : ipsec, Index: 32772, Origin: REMOTE, Status: DOWN, LR enabled: 0, LR hold time: 0
log:local7.debug: May  7 16:58:19 vedge2 TTMD[683]: ttm_debug_announcement[217]:       Attributes: GROUP PREF WEIGHT GEN-ID VERSION TLOCv4-PUB TLOCv4-PRI TLOCv6-PUB TLOCv6-PRI SITE-ID CARRIER ENCAP RESTRICT
log:local7.debug: May  7 16:58:19 vedge2 TTMD[683]: ttm_debug_announcement[220]:         Preference: 0
log:local7.debug: May  7 16:58:19 vedge2 TTMD[683]: ttm_debug_announcement[223]:         Weight: 1
log:local7.debug: May  7 16:58:19 vedge2 TTMD[683]: ttm_debug_announcement[226]:         Gen-ID: 2147483661
log:local7.debug: May  7 16:58:19 vedge2 TTMD[683]: ttm_debug_announcement[229]:         Version: 2
log:local7.debug: May  7 16:58:19 vedge2 TTMD[683]: ttm_debug_announcement[232]:         Site-ID: 13
log:local7.debug: May  7 16:58:19 vedge2 TTMD[683]: ttm_debug_announcement[235]:         Carrier: 4
log:local7.debug: May  7 16:58:19 vedge2 TTMD[683]: ttm_debug_announcement[241]:         Restrict: 0
log:local7.debug: May  7 16:58:19 vedge2 TTMD[683]: ttm_debug_announcement[249]:         Group: Count: 1
log:local7.debug: May  7 16:58:19 vedge2 TTMD[683]: ttm_debug_announcement[262]:         Groups: 0
log:local7.debug: May  7 16:58:19 vedge2 TTMD[683]: ttm_debug_announcement[269]:         TLOCv4-Public: 192.168.110.6:12346
log:local7.debug: May  7 16:58:19 vedge2 TTMD[683]: ttm_debug_announcement[273]:         TLOCv4-Private: 192.168.110.6:12346
log:local7.debug: May  7 16:58:19 vedge2 TTMD[683]: ttm_debug_announcement[277]:         TLOCv6-Public: :::0
log:local7.debug: May  7 16:58:19 vedge2 TTMD[683]: ttm_debug_announcement[281]:         TLOCv6-Private: :::0
log:local7.debug: May  7 16:58:19 vedge2 TTMD[683]: ttm_debug_announcement[285]:         TLOC-Encap: ipsec-tunnel
log:local7.debug: May  7 16:58:19 vedge2 TTMD[683]: ttm_debug_announcement[295]:           Authentication: unknown(0x98) Encryption: aes256(0xc) SPI 334 Proto ESP
log:local7.debug: May  7 16:58:19 vedge2 TTMD[683]: ttm_debug_announcement[312]:           SPI 334, Flags 0x1e           Integrity: 1, encrypt-keys: 1 auth-keys: 1
log:local7.debug: May  7 16:58:19 vedge2 TTMD[683]: ttm_debug_announcement[317]:           Number of protocols 0
log:local7.debug: May  7 16:58:19 vedge2 TTMD[683]: ttm_debug_announcement[328]:           Number of encrypt types: 2
log:local7.debug: May  7 16:58:19 vedge2 TTMD[683]: ttm_debug_announcement[333]:           Encrypt type[0] AES256-GCM
log:local7.debug: May  7 16:58:19 vedge2 TTMD[683]: ttm_debug_announcement[333]:           Encrypt type[1] AES256-CBC
log:local7.debug: May  7 16:58:19 vedge2 TTMD[683]: ttm_debug_announcement[339]:           Number of integrity types: 1
log:local7.debug: May  7 16:58:19 vedge2 TTMD[683]: ttm_debug_announcement[344]:           integrity type[0] HMAC_SHA1
log:local7.debug: May  7 16:58:19 vedge2 TTMD[683]: ttm_debug_announcement[349]:       #Paths: 0
log:local7.debug: May  7 16:58:19 vedge2 TTMD[683]: ttm_debug_announcement[194]: Sent TTM Msg TLOC_ADD, Client: ftmd, AF: TLOC-IPV4
log:local7.debug: May  7 16:58:19 vedge2 TTMD[683]: ttm_debug_announcement[213]:     TLOC: 192.168.30.6 : public-internet : ipsec, Index: 32772, Origin: REMOTE, Status: DOWN, LR enabled: 0, LR hold time: 0
log:local7.debug: May  7 16:58:19 vedge2 TTMD[683]: ttm_debug_announcement[217]:       Attributes: GROUP PREF WEIGHT GEN-ID VERSION TLOCv4-PUB TLOCv4-PRI TLOCv6-PUB TLOCv6-PRI SITE-ID CARRIER ENCAP RESTRICT
log:local7.debug: May  7 16:58:19 vedge2 TTMD[683]: ttm_debug_announcement[220]:         Preference: 0
log:local7.debug: May  7 16:58:19 vedge2 TTMD[683]: ttm_debug_announcement[223]:         Weight: 1
log:local7.debug: May  7 16:58:19 vedge2 TTMD[683]: ttm_debug_announcement[226]:         Gen-ID: 2147483661
log:local7.debug: May  7 16:58:19 vedge2 TTMD[683]: ttm_debug_announcement[229]:         Version: 2
log:local7.debug: May  7 16:58:19 vedge2 TTMD[683]: ttm_debug_announcement[232]:         Site-ID: 13
log:local7.debug: May  7 16:58:19 vedge2 TTMD[683]: ttm_debug_announcement[235]:         Carrier: 4
log:local7.debug: May  7 16:58:19 vedge2 TTMD[683]: ttm_debug_announcement[241]:         Restrict: 0
log:local7.debug: May  7 16:58:19 vedge2 TTMD[683]: ttm_debug_announcement[249]:         Group: Count: 1
log:local7.debug: May  7 16:58:19 vedge2 TTMD[683]: ttm_debug_announcement[262]:         Groups: 0
log:local7.debug: May  7 16:58:19 vedge2 TTMD[683]: ttm_debug_announcement[269]:         TLOCv4-Public: 192.168.110.6:12346
log:local7.debug: May  7 16:58:19 vedge2 TTMD[683]: ttm_debug_announcement[273]:         TLOCv4-Private: 192.168.110.6:12346
log:local7.debug: May  7 16:58:19 vedge2 TTMD[683]: ttm_debug_announcement[277]:         TLOCv6-Public: :::0
log:local7.debug: May  7 16:58:19 vedge2 TTMD[683]: ttm_debug_announcement[281]:         TLOCv6-Private: :::0
log:local7.debug: May  7 16:58:19 vedge2 TTMD[683]: ttm_debug_announcement[285]:         TLOC-Encap: ipsec-tunnel
log:local7.debug: May  7 16:58:19 vedge2 TTMD[683]: ttm_debug_announcement[295]:           Authentication: unknown(0x98) Encryption: aes256(0xc) SPI 334 Proto ESP
log:local7.debug: May  7 16:58:19 vedge2 TTMD[683]: ttm_debug_announcement[312]:           SPI 334, Flags 0x1e           Integrity: 1, encrypt-keys: 1 auth-keys: 1
log:local7.debug: May  7 16:58:19 vedge2 TTMD[683]: ttm_debug_announcement[317]:           Number of protocols 0
log:local7.debug: May  7 16:58:19 vedge2 TTMD[683]: ttm_debug_announcement[328]:           Number of encrypt types: 2
log:local7.debug: May  7 16:58:19 vedge2 TTMD[683]: ttm_debug_announcement[333]:           Encrypt type[0] AES256-GCM
log:local7.debug: May  7 16:58:19 vedge2 TTMD[683]: ttm_debug_announcement[333]:           Encrypt type[1] AES256-CBC
log:local7.debug: May  7 16:58:19 vedge2 TTMD[683]: ttm_debug_announcement[339]:           Number of integrity types: 1
log:local7.debug: May  7 16:58:19 vedge2 TTMD[683]: ttm_debug_announcement[344]:           integrity type[0] HMAC_SHA1
log:local7.debug: May  7 16:58:19 vedge2 TTMD[683]: ttm_debug_announcement[349]:       #Paths: 0
log:local7.debug: May  7 16:58:19 vedge2 TTMD[683]: ttm_debug_announcement[194]: Sent TTM Msg TLOC_ADD, Client: fpmd, AF: TLOC-IPV4
log:local7.debug: May  7 16:58:19 vedge2 TTMD[683]: ttm_debug_announcement[213]:     TLOC: 192.168.30.6 : public-internet : ipsec, Index: 32772, Origin: REMOTE, Status: DOWN, LR enabled: 0, LR hold time: 0
log:local7.debug: May  7 16:58:19 vedge2 TTMD[683]: ttm_debug_announcement[217]:       Attributes: GROUP PREF WEIGHT GEN-ID VERSION TLOCv4-PUB TLOCv4-PRI TLOCv6-PUB TLOCv6-PRI SITE-ID CARRIER ENCAP RESTRICT
log:local7.debug: May  7 16:58:19 vedge2 TTMD[683]: ttm_debug_announcement[220]:         Preference: 0
log:local7.debug: May  7 16:58:19 vedge2 TTMD[683]: ttm_debug_announcement[223]:         Weight: 1
log:local7.debug: May  7 16:58:19 vedge2 TTMD[683]: ttm_debug_announcement[226]:         Gen-ID: 2147483661
log:local7.debug: May  7 16:58:19 vedge2 TTMD[683]: ttm_debug_announcement[229]:         Version: 2
log:local7.debug: May  7 16:58:19 vedge2 TTMD[683]: ttm_debug_announcement[232]:         Site-ID: 13
log:local7.debug: May  7 16:58:19 vedge2 TTMD[683]: ttm_debug_announcement[235]:         Carrier: 4
log:local7.debug: May  7 16:58:19 vedge2 TTMD[683]: ttm_debug_announcement[241]:         Restrict: 0
log:local7.debug: May  7 16:58:19 vedge2 TTMD[683]: ttm_debug_announcement[249]:         Group: Count: 1
log:local7.debug: May  7 16:58:19 vedge2 TTMD[683]: ttm_debug_announcement[262]:         Groups: 0
log:local7.debug: May  7 16:58:19 vedge2 TTMD[683]: ttm_debug_announcement[269]:         TLOCv4-Public: 192.168.110.6:12346
log:local7.debug: May  7 16:58:19 vedge2 TTMD[683]: ttm_debug_announcement[273]:         TLOCv4-Private: 192.168.110.6:12346
log:local7.debug: May  7 16:58:19 vedge2 TTMD[683]: ttm_debug_announcement[277]:         TLOCv6-Public: :::0
log:local7.debug: May  7 16:58:19 vedge2 TTMD[683]: ttm_debug_announcement[281]:         TLOCv6-Private: :::0
log:local7.debug: May  7 16:58:19 vedge2 TTMD[683]: ttm_debug_announcement[285]:         TLOC-Encap: ipsec-tunnel
log:local7.debug: May  7 16:58:19 vedge2 TTMD[683]: ttm_debug_announcement[295]:           Authentication: unknown(0x98) Encryption: aes256(0xc) SPI 334 Proto ESP
log:local7.debug: May  7 16:58:19 vedge2 TTMD[683]: ttm_debug_announcement[312]:           SPI 334, Flags 0x1e           Integrity: 1, encrypt-keys: 1 auth-keys: 1
log:local7.debug: May  7 16:58:19 vedge2 TTMD[683]: ttm_debug_announcement[317]:           Number of protocols 0
log:local7.debug: May  7 16:58:19 vedge2 TTMD[683]: ttm_debug_announcement[328]:           Number of encrypt types: 2
log:local7.debug: May  7 16:58:19 vedge2 TTMD[683]: ttm_debug_announcement[333]:           Encrypt type[0] AES256-GCM
log:local7.debug: May  7 16:58:19 vedge2 TTMD[683]: ttm_debug_announcement[333]:           Encrypt type[1] AES256-CBC
log:local7.debug: May  7 16:58:19 vedge2 TTMD[683]: ttm_debug_announcement[339]:           Number of integrity types: 1
log:local7.debug: May  7 16:58:19 vedge2 TTMD[683]: ttm_debug_announcement[344]:           integrity type[0] HMAC_SHA1
log:local7.debug: May  7 16:58:19 vedge2 TTMD[683]: ttm_debug_announcement[349]:       #Paths: 0
log:local7.debug: May  7 16:58:19 vedge2 TTMD[683]: ttm_debug_announcement[194]: Sent TTM Msg DATA_DEVICE_ADD, Client: pimd, AF: DATA-DEVICE-IPV4
log:local7.debug: May  7 16:58:19 vedge2 TTMD[683]: ttm_debug_announcement[431]:     Device: 192.168.30.6, Status: 2
log:local7.info: May  7 16:58:19 vedge2 FTMD[674]: %Viptela-vedge2-ftmd-6-INFO-1400002: Notification: 5/7/2019 14:58:19 bfd-state-change severity-level:major host-name:"vedge2" system-ip:192.168.30.5 src-ip:192.168.110.5 dst-ip:192.168.110.6 proto:ipsec src-port:12366 dst-port:12346 local-system-ip:192.168.30.5 local-color:"biz-internet" remote-system-ip:192.168.30.6 remote-color:"public-internet" new-state:down deleted:false flap-reason:timeout
log:local7.info: May  7 16:58:20 vedge2 FTMD[674]: %Viptela-vedge2-ftmd-6-INFO-1400002: Notification: 5/7/2019 14:58:19 bfd-state-change severity-level:major host-name:"vedge2" system-ip:192.168.30.5 src-ip:192.168.109.5 dst-ip:192.168.110.6 proto:ipsec src-port:12366 dst-port:12346 local-system-ip:192.168.30.5 local-color:"public-internet" remote-system-ip:192.168.30.6 remote-color:"public-internet" new-state:down deleted:false flap-reason:timeout
パケットトレースを使用したBFDパケットのキャプチャ(20.5以降)
20.5.1以降のソフトウェアで導入されたもう1つの便利なツールは、vEdge用のパケットトレースです。
BFDセッションは同じ標準ポート(通常は12346)を使用するため、ピアIPアドレスに基づいてフィルタリングするのが最も簡単です。
例:
vedge# show bfd sessions
                                      SOURCE TLOC      REMOTE TLOC                                      DST PUBLIC                      DST PUBLIC         DETECT      TX
SYSTEM IP        SITE ID  STATE       COLOR            COLOR            SOURCE IP                       IP                              PORT        ENCAP  MULTIPLIER  INTERVAL(msec) UPTIME          TRANSITIONS
-------------------------------------------------------------------------------------------------------------------------------------------------------------------------------------------------------------
10.4.4.1         101      up          default          default          192.168.16.29                   192.168.22.103                  12386       ipsec  7           1000           0:03:23:34      0
10.4.4.2         102      up          default          default          192.168.16.29                   192.168.29.39                   12346       ipsec  7           1000           0:03:21:24      1
パケットトレースは次のように設定されます。
vedge# debug packet-trace condition ingress-if ge0/0 vpn 0 source-ip 192.168.29.39
vedge# debug packet-trace condition start
vedge# debug packet-trace condition stop
結果は、次に示すshowコマンドを使用して表示できます。入力パケットには、BFDトラフィックに対して「1」(true)に設定された「isBFD」フラグがあります。
vedge# show packet-trace statistics
packet-trace statistics 0
 source-ip             192.168.29.39
 source-port           12346
 destination-ip        192.168.16.29
 destination-port      12346
 source-interface      ge0_0
 destination-interface loop0.1
 decision              FORWARD
 duration              25
packet-trace statistics 1
 source-ip             192.168.29.39
 source-port           12346
 destination-ip        192.168.16.29
 destination-port      12346
 source-interface      ge0_0
 destination-interface loop0.1
 decision              FORWARD
 duration              14
packet-trace statistics 2
 source-ip             192.168.29.39
 source-port           12346
 destination-ip        192.168.16.29
 destination-port      12346
 source-interface      ge0_0
 destination-interface loop0.1
 decision              FORWARD
 duration              14

vedge# show packet-trace detail 0
==========================================================================================================================
Pkt-id           src_ip(ingress_if)            dest_ip(egress_if)           Duration           Decision           Protocol
==========================================================================================================================
0         192.168.29.39:12346 (ge0_0)    192.168.16.29:12346 (loop0.1)        25 us             FORWARD              17
INGRESS_PKT:
00 50 56 84 79 be 00 50 56 84 3c b5 08 00 45 c0 00 96 ab 40 40 00 3f 11 e0 c1 c0 a8 1d 27 c0
a8 10 1d 30 3a 30 3a 00 82 00 00 a0 00 01 02 00 00 0e 3f 4b 65 07 bc 61 03 38 71 93 53 58
88 d8 08 41 95 7c 1a ff 8b cc b4 d0 d8 61 44 40 67 cc 1a 01 fd 1f c4 45 95 ea 7e 15 c9 08
2e b6 63 84 00
EGRESS_PKT:
a1 5e fe 11 00 00 00 00 00 00 00 00 00 00 04 00 0c 04 00 41 01 02 00 00 00 00 00 00 00 00 00
00 00 00 00 00 00 04 00 00 00 00 00 00 00 02 00 3a 30 3a 30 1d 10 a8 c0 00 00 00 00 00 00
00 00 00 00 00 00 01 00 00 00 27 1d a8 c0 00 00 00 00 00 00 00 00 00 00 00 00 01 00 00 00
a4 00 01 00 00
Feature Data
------------------------------------
TOUCH : fp_proc_packet
core_id: 2
DSCP: 48
------------------------------------
TOUCH : fp_proc_packet2
core_id: 2
DSCP: 48
------------------------------------
TOUCH : fp_ip_forward
core_id: 2
DSCP: 48
------------------------------------
TOUCH : fp_ipsec_decrypt
core_id: 2
DSCP: 48
------------------------------------
FP_TRACE_FEAT_IPSEC_DATA:
src_ip : 192.168.29.39
src_port : 3784
dst_ip : 192.168.16.29
dst_port : 3784
isBFD : 1
core_id: 2
DSCP: 48
------------------------------------
TOUCH : fp_send_pkt
core_id: 2
DSCP: 48
------------------------------------
TOUCH : fp_hw_x86_pkt_free
core_id: 2
DSCP: 48
------------------------------------
TOUCH : fp_proc_remote_bfd_
core_id: 2
DSCP: 48
------------------------------------
TOUCH : BFD_ECHO_REPLY
core_id: 2
DSCP: 48
------------------------------------
TOUCH : fp_hw_x86_pkt_free
core_id: 2
DSCP: 48
出力BFDパケットも同様の方法でキャプチャされます。これらの結果は、エコー要求か応答かにかかわらず、特定のタイプを識別します。
vedge# debug packet-trace condition vpn 0 destination-ip 192.168.29.39
vedge# debug packet-trace condition start
vedge# debug packet-trace condition stop
vedge# show packet-trace statistics
packet-trace statistics 0
 source-ip             192.168.16.29
 source-port           3784
 destination-ip        192.168.29.39
 destination-port      3784
 source-interface      loop0.0
 destination-interface ge0_0
 decision              FORWARD
 duration              15
packet-trace statistics 1
 source-ip             192.168.16.29
 source-port           3784
 destination-ip        192.168.29.39
 destination-port      3784
 source-interface      loop0.0
 destination-interface ge0_0
 decision              FORWARD
 duration              66
packet-trace statistics 2
 source-ip             192.168.16.29
 source-port           3784
 destination-ip        192.168.29.39
 destination-port      3784
 source-interface      loop0.0
 destination-interface ge0_0
 decision              FORWARD
 duration              17

vedge# show packet-trace details 0
==========================================================================================================================
Pkt-id           src_ip(ingress_if)            dest_ip(egress_if)           Duration           Decision           Protocol
==========================================================================================================================
0         192.168.16.29:3784 (loop0.0)   192.168.29.39:3784 (ge0_0)           15 us             FORWARD              17
INGRESS_PKT:
45 c0 00 4f 00 00 40 00 ff 11 cc 48 c0 a8 10 1d c0 a8 1d 27 0e c8 0e c8 00 3b 00 00 80 c0 07
00 00 00 00 01 00 00 00 01 00 0f 42 40 00 0f 42 40 00 0f 42 40 01 00 0c 01 00 00 1d 3b b1
c9 89 d7 03 00 0f c0 a8 10 1d 30 3a c0 a8 1d 27 30 3a a3 96 07 3b 47 1c 60 d1 d5 76 4c 72
78 1f 9a 0d 00
EGRESS_PKT:
00 50 56 84 3c b5 00 50 56 84 79 be 08 00 45 c0 00 96 ab 40 40 00 3f 11 e0 c1 c0 a8 10 1d c0
a8 1d 27 30 3a 30 3a 00 82 00 00 a0 00 01 01 00 00 5c 3d 88 9a c7 28 23 1b e6 18 ea fe 73
1b b9 e3 79 bf d9 f4 72 41 96 c1 47 07 44 56 77 5a a2 fb 43 59 c1 97 59 47 62 21 77 d4 f4
47 8b 30 b0 00
Feature Data
------------------------------------
TOUCH : fp_send_bfd_pkt
core_id: 0
DSCP: 48
------------------------------------
TOUCH : BFD_ECHO_REPLY
core_id: 0
DSCP: 48
------------------------------------
TOUCH : fp_ipsec_loopback_f
core_id: 0
DSCP: 48
------------------------------------
TOUCH : fp_send_pkt
core_id: 0
DSCP: 48
------------------------------------
TOUCH : fp_ip_forward
core_id: 2
DSCP: 48
------------------------------------
TOUCH : fp_send_ip_packet
core_id: 2
DSCP: 48
------------------------------------
TOUCH : fp_send_pkt
core_id: 2
DSCP: 48
------------------------------------
TOUCH : fp_hw_x86_pkt_free
core_id: 2
DSCP: 48
vedge# show packet-trace details 1
==========================================================================================================================
Pkt-id           src_ip(ingress_if)            dest_ip(egress_if)           Duration           Decision           Protocol
==========================================================================================================================
1         192.168.16.29:3784 (loop0.0)   192.168.29.39:3784 (ge0_0)           66 us             FORWARD              17
INGRESS_PKT:
45 c0 00 56 00 00 40 00 ff 11 cc 41 c0 a8 10 1d c0 a8 1d 27 0e c8 0e c8 00 42 00 00 80 c0 07
00 00 00 00 01 00 00 00 01 00 0f 42 40 00 0f 42 40 00 0f 42 40 01 00 0c 00 00 00 1d b8 35
a8 09 88 03 00 0f c0 a8 10 1d 30 3a c0 a8 1d 27 30 3a 04 00 07 01 00 05 a6 38 ff 7e 06 1e
da 23 19 d5 00
EGRESS_PKT:
00 50 56 84 3c b5 00 50 56 84 79 be 08 00 45 c0 00 9d ab 40 40 00 3f 11 e0 ba c0 a8 10 1d c0
a8 1d 27 30 3a 30 3a 00 89 00 00 a0 00 01 01 00 00 5c 3e 2d 3b 9e 81 aa 10 26 54 7f 47 5c
d8 81 4f 23 2e 3c 39 1e 94 b2 f4 fb a4 ba 98 54 73 99 8f 2e 95 d7 69 fb 91 41 96 93 03 5b
a4 e4 e8 82 00
Feature Data
------------------------------------
TOUCH : fp_send_bfd_pkt
core_id: 0
DSCP: 48
------------------------------------
TOUCH : BFD_ECHO_REQUEST
core_id: 0
DSCP: 48
------------------------------------
TOUCH : fp_ipsec_loopback_f
core_id: 0
DSCP: 48
------------------------------------
TOUCH : fp_send_pkt
core_id: 0
DSCP: 48
------------------------------------
TOUCH : fp_ip_forward
core_id: 2
DSCP: 48
------------------------------------
TOUCH : fp_send_ip_packet
core_id: 2
DSCP: 48
------------------------------------
TOUCH : fp_send_pkt
core_id: 2
DSCP: 48
------------------------------------
TOUCH : fp_hw_x86_pkt_free
core_id: 2
DSCP: 48
関連情報
更新履歴
| 改定 | 発行日 | コメント |
|---|---|---|
2.0 |
28-Sep-2022
|
初版リリース |
1.0 |
13-Jun-2019
|
初版 |
 フィードバック