- Preface
- Chapter 1: Overview
- Chapter 2: Getting Started
- Chapter 3: Configuring Security Solutions
- Chapter 4: Performing System Tasks
- Chapter 5: Adding and Using Maps
- Chapter 6: Monitoring Wireless Devices
- Chapter 7: Managing WCS User Accounts
- Chapter 8: Configuring Mobility Groups
- Chapter 9: Configuring Access Points
- Chapter 10: Configuring Controllers and Switches
- Chapter 11: Managing Clients
- Chapter 12: Using Templates
- Chapter 13: Mobility Services
- Chapter 14: Performing Maintenance Operations
- Chapter 15: Configuring Hybrid REAP
- Chapter 16: Alarms and Events
- Chapter 17: Running Reports
- Chapter 18: Administrative Tasks
- Chapter 19: Tools Menu
- Chapter 20: Virtual Domains
- Chapter 21: Google Earth Maps
- Appendix A: Troubleshooting and Best Practices
- Appendix B: WCS and End User Licenses
- Appendix C: Conversion of a WLSE Autonomous Deployment to a WCS Controller Deployment
- Index
Managing Clients
You can look at the client's association history and statistical information in several ways on the Cisco WCS GUI. With WCS 7.0 you can view client session related information and determine client presence, usage patterns, and historical session data. You can also use these tools to analyze and troubleshoot client issues. The information can be used in addition to maps to assess which areas experience inconsistent coverage and which areas have the potential to drop coverage.
Client Tab
You should use the Client tab (see Figure 11-1) on the WCS home page as the main client health monitor. Unlike the historical data retrieved from the device periodically and stored in the WCS Client Detail page, this trend data can be collected whenever you chose to refresh the dashboard with the current network status. It can be customized and acts as a main client health monitor where you can get overall client information. You can see how many client devices are connected to your network as well as where and how these devices have accessed your network. You can also see which clients are authenticated or excluded.

Note ![]() When you click the Client Tab from the WCS home page, it takes longer than average to load the data.
When you click the Client Tab from the WCS home page, it takes longer than average to load the data.
Figure 11-1 Client Tab
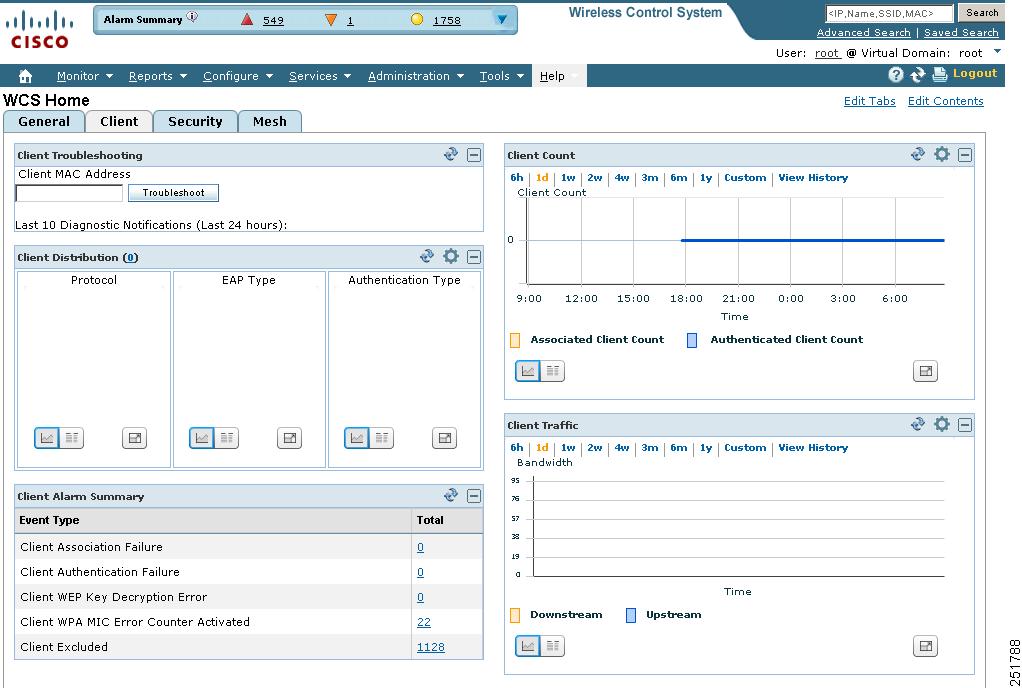
Use the Edit Content link to choose the components you want to have appear on the Client tab. You can choose the component from the Available Components list and then click to add it to the left or right column. For more information on using the Edit Content link, refer to the "Editing Content" section. For example, if you wanted to see the client count in both the General and Client dashboards, you could add the same component to both.
To return to the original client tab before customization, click Edit Tabs and choose the Reset to Factory Default button.
Client Distribution
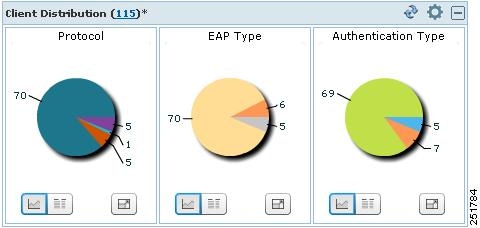
This component (see Figure 11-2) shows how many clients are on your network presently. You can see how clients are distributed by protocol, EAP type, and authentication type.
•![]() Protocol—Represents radio bands such as 802.11a/n, 802.11b/g/n, and so on
Protocol—Represents radio bands such as 802.11a/n, 802.11b/g/n, and so on
•![]() EAP-Type—Represents types such as EAP-FAST, PEAP, and so on
EAP-Type—Represents types such as EAP-FAST, PEAP, and so on
•![]() Authentication Type—Represents types such as WPA (TKIP), WPA2 (AES), open, and so on
Authentication Type—Represents types such as WPA (TKIP), WPA2 (AES), open, and so on
You can choose to display this information in table form or in a pie chart. The pie charts are clickable. If you hover over a particular portion of the pie chart, a heading and percentage appears, and you can then click the pie chart piece to open a filtered list. When you click the number represented by Client Distribution, you get a list of clients represented by this number (the same page that you see when you choose Monitor > Clients). You can filter the data that is displayed in client distribution by clicking the Component Options icon and choosing either controller IP, SSID, or floor area.
Figure 11-2 Client Distribution
Note ![]() The asterisk next to the Client Distribution count indicates that the component has been customized. If you reset to the default page, the asterisk is cleared.
The asterisk next to the Client Distribution count indicates that the component has been customized. If you reset to the default page, the asterisk is cleared.
Client Protocol Distribution
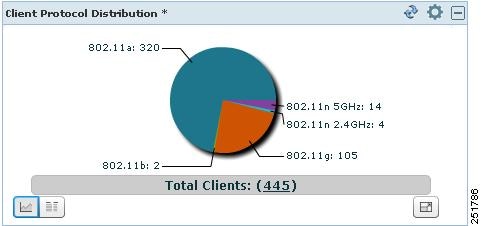
This component (see Figure 11-3) shows the current client count distribution by protocols. It shows the subtotal of each radio band (802.11a/n and 802.11b/g/n) distribution and the total client count. You can choose to display this information in table form or in a pie chart. When you click the number represented by Total Clients, you get a list of clients represented by this number (the same page that you see when you choose Monitor > Clients). You can filter the data that is displayed in client count by clicking the Component Options icon and choosing either controller IP, SSID, or floor area.
Figure 11-3 Client Protocol Distribution
Client Count
This component (see Figure 11-4) shows the trend of associated and authenticated client counts in a given period of time. You can choose to display the information in table form or in a pie chart. It shows the minimum, average, and maximum number of clients. You can filter the data that is displayed in client count by clicking the Component Options icon and choosing either controller IP, SSID, or floor area.
Figure 11-4 Client Count
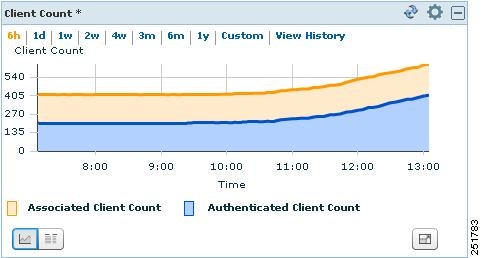
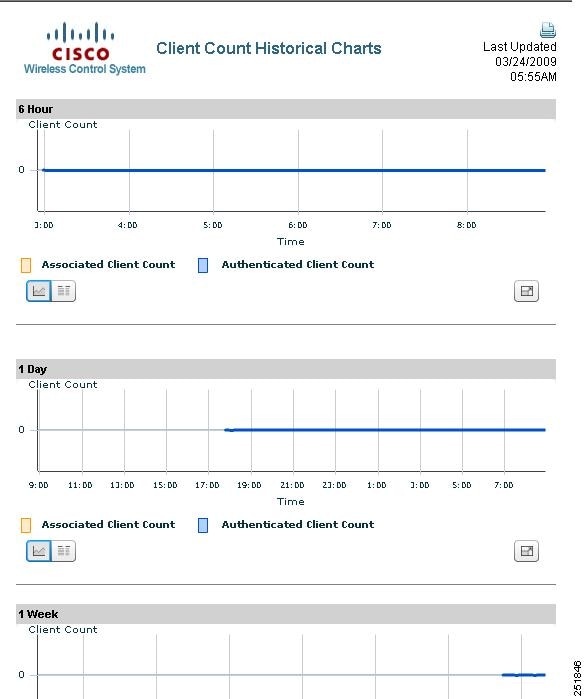
If you click View History, Client Count Historical Charts appear for the various time frames (see Figure 11-5). The Client Count Historical Charts show the client count over the last hour, last 6 hours, last day, last week, last month, and last year. The blue line shows the authenticated client count and the orange line shows the associated client count. The upper right-hand corner shows when the chart was last updated.
Figure 11-5 View History
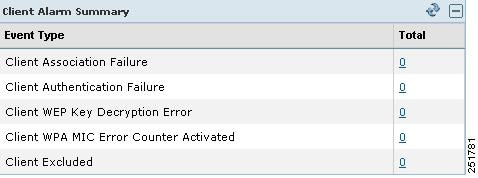
Client Alarm Summary
This component (see Figure 11-6) shows the five most recent client alarms providing the following data:
•![]() Client Association Failure
Client Association Failure
•![]() Client Authentication Failure
Client Authentication Failure
•![]() Client WEP Key Decryption Error
Client WEP Key Decryption Error
•![]() Client WPA MIC Error Counter Activated
Client WPA MIC Error Counter Activated
•![]() Client Excluded
Client Excluded
Click the number in Total column to open the Events page (the same page that you see when you choose Monitor > Events.
Figure 11-6 Client Alarm Summary
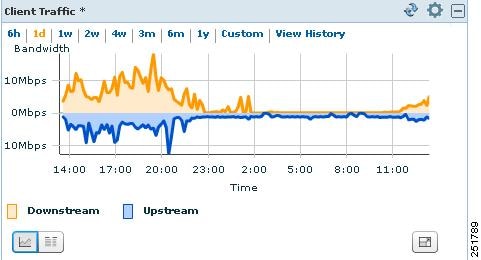
Client Traffic
Controllers keep counters for the number of bytes transferred and received for each client. WCS reads the number every 15 minutes and then calculates the difference, comparing the prior polling. This client traffic data is then aggregated every hour, every day, and every week (see Figure 11-7). It shows the average and maximum values in megabytes per second for both downstream and upstream traffic. You can display the information in table form or in a pie chart. When generating the chart based on the floor, WCS adds up all client traffic on this floor. You can filter the data that is displayed in client traffic by clicking the Component Options icon and choosing either controller IP, SSID, or floor area.
Figure 11-7 Client Traffic
If you click View History, Client Traffic Historical Charts appear for the various time frames (see Figure 11-5). The Client Traffic Historical Charts show the client traffic over the last 6 hours, last day, last week, last month, and last year. The blue line shows the authenticated client count and the orange line shows the associated client count. The upper right-hand corner shows when the chart was last updated.
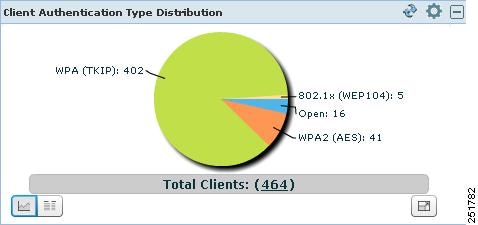
Client Authentication Type Distribution
This component (see Figure 11-8) shows the number of clients for each authentication type. You can choose to display this information in table form or in a pie chart. When you click the number represented by Total Clients, you get a list of clients represented by this number (the same page that you see when you choose Monitor > Clients). You can filter the data that is displayed in client authentication type distribution by clicking the Component Options icon and choosing either controller IP, SSID, or floor area.
Note ![]() Only the current authentication types are shown. Obsolete types are not displayed.
Only the current authentication types are shown. Obsolete types are not displayed.
Figure 11-8 Client Authentication Type Distribution
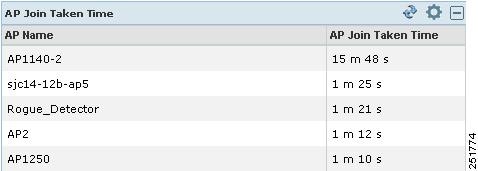
AP Join Taken Time
This component (see Figure 11-9) shows how long it took each access point to join the controller. You can restrict the number of access points to display by clicking the Component Options icon and choosing the items per page.
Figure 11-9 AP Join Taken Time
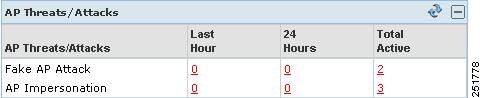
AP Threats/Attacks
This component (see Figure 11-10) shows the type and number of attacks and threats that have occurred in the last hour, last 24 hours, and the total active.
Figure 11-10 AP Threats/Attacks
Client Detail Page
This section describes how to view client properties, client association history, client statistics, client session information, and so on. The Client Detail page shows the association history graph to represent the time-based data. The information will help you identify, diagnose, and resolve client issues. Follow these steps to open the Client Detail page.
Note ![]() To view complete details on the Monitor > Client details screen and to perform operations such as Radio Measurement, users in User Defined groups need permission for Monitor Clients, View Alerts & Events, Configure Controllers, and Client Location.
To view complete details on the Monitor > Client details screen and to perform operations such as Radio Measurement, users in User Defined groups need permission for Monitor Clients, View Alerts & Events, Configure Controllers, and Client Location.
Step 1 ![]() Choose Monitor > Clients.
Choose Monitor > Clients.
Step 2 ![]() Choose a hyperlink from the Client Username column to view client details. The Monitor > Client > Client Details page appears (see Figure 11-11). This data is displayed in both table and chart form.
Choose a hyperlink from the Client Username column to view client details. The Monitor > Client > Client Details page appears (see Figure 11-11). This data is displayed in both table and chart form.
Figure 11-11 Client Details Page
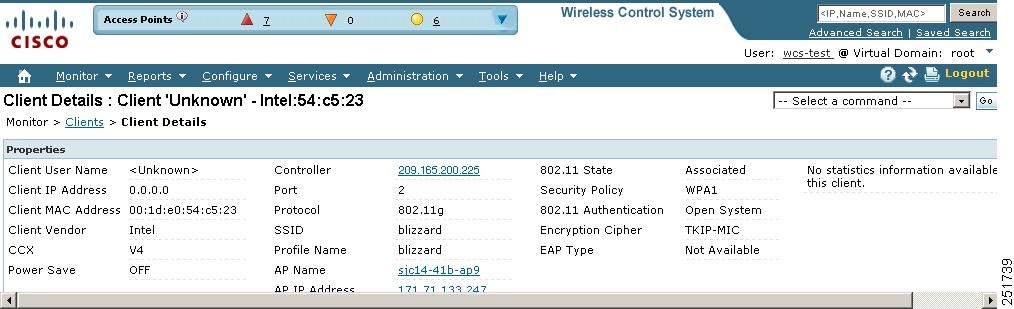
The Client Details page includes the following information:
•![]() Client Identity and Device Information—Username, Client MAC address, Client IP address, Client host name, Vendor, CCX Version, and power save.
Client Identity and Device Information—Username, Client MAC address, Client IP address, Client host name, Vendor, CCX Version, and power save.
•![]() Association Information—Protocol, SSID, Profile, VLAN ID, Interface, Associated AP name, Associated AP MAC address, Associated AP IP address, Associated controller name, Associated controller IP, First seen time, Last seen time, and Current associated status.
Association Information—Protocol, SSID, Profile, VLAN ID, Interface, Associated AP name, Associated AP MAC address, Associated AP IP address, Associated controller name, Associated controller IP, First seen time, Last seen time, and Current associated status.
•![]() Security Information—Security policy, 802.11 authentication, Cipher, and EAP type.
Security Information—Security policy, 802.11 authentication, Cipher, and EAP type.
•![]() Statistic Information—RF quality, SNR, RSSI, Throughput, Data rate, Bytes sent and received, Packets sent and received, and retries.
Statistic Information—RF quality, SNR, RSSI, Throughput, Data rate, Bytes sent and received, Packets sent and received, and retries.
•![]() Historical Charts—Client association chart and RF quality, SNR and RSSI, Bytes sent and received, Packets sent and received.
Historical Charts—Client association chart and RF quality, SNR and RSSI, Bytes sent and received, Packets sent and received.
•![]() Events—Client association failure, Client authentication failure, Client WEP key decryption error, client WPA MIC error counter activated, Client decrypt error occurred, Client excluded, AP disassociated from controller, and AP crash.
Events—Client association failure, Client authentication failure, Client WEP key decryption error, client WPA MIC error counter activated, Client decrypt error occurred, Client excluded, AP disassociated from controller, and AP crash.
•![]() Client Location—A small map showing the current client location.
Client Location—A small map showing the current client location.
•![]() CCXv5—Basic CCXv5 client information if appropriate.
CCXv5—Basic CCXv5 client information if appropriate.
•![]() Client Sessions—The details of the client session stated during the selected time range.
Client Sessions—The details of the client session stated during the selected time range.
Enabling Automatic Client Troubleshooting
On the Settings > Client page, you can enable automatic client troubleshooting on a diagnostic channel. This feature is available only for Cisco Compatible Extension clients version 5.
Follow these steps to enable automatic client troubleshooting.
Step 1 ![]() Choose Administration > Settings.
Choose Administration > Settings.
Step 2 ![]() From the left sidebar menu, choose Client.
From the left sidebar menu, choose Client.
Step 3 ![]() Select the Automatically troubleshoot client on diagnostic channel check box.
Select the Automatically troubleshoot client on diagnostic channel check box.
Note ![]() When the check box is selected, WCS processes the diagnostic association trap. When it is not selected, WCS raises the trap, but automated troubleshooting is not initiated.
When the check box is selected, WCS processes the diagnostic association trap. When it is not selected, WCS raises the trap, but automated troubleshooting is not initiated.
Step 4 ![]() Click Save.
Click Save.
Client Details from Access Point Page
You can also view the client information from the access point page. Choose Monitor > Access Points. Click an access point URL from the column to see details about that access point. Click the Current Associated Clients tab.
Running Client Reports
You can run client reports such as busiest clients, client count, client sessions, client summary, throughput, unique clients and v5 clients statistics from the Report Launch pad. See the "Creating and Running a New Report" section
Client Troubleshooting
You can begin troubleshooting several ways: by entering a MAC address in the Client tab dashboard, by using the search function, or by clicking the Troubleshooting icon within the Client MAC Address column on the Monitor > Clients page. Any method provides all the information necessary to troubleshoot historical client issues. You can monitor the status of the connection, verify the user's current and past locations, and troubleshoot client connectivity problems. You may want to use the client troubleshooting option if a user experiences repeated connectivity issues. The Client Details page shows SNR over time, RSSI over time, client reassociations, client reauthentications, and any RRM events. An administrator can correlate reassociations and reauthentications and determine if the problem was with the network or client.
Troubleshooting from the Client Tab Dashboard
If you enter a client MAC address and click the Troubleshoot button (see Figure 11-12), the same Client Details page as shown in Figure 11-1 appears.
Figure 11-12 Client Tab Troubleshooting
The following client MAC address formats are supported:
•![]() 0123.45ab.cdef
0123.45ab.cdef
•![]() 01:23:45:ab:cd:ef
01:23:45:ab:cd:ef
•![]() 012345abcdef
012345abcdef
•![]() 01-23-45-ab-cd-ef
01-23-45-ab-cd-ef
•![]() 01.23.45.ab.cd.ef
01.23.45.ab.cd.ef
•![]() Partial MACAddress(00:aa,22:dd:aa)
Partial MACAddress(00:aa,22:dd:aa)
Note ![]() If the client is not currently associated, most of the information will not appear.
If the client is not currently associated, most of the information will not appear.
Troubleshooting Using the Search Feature
Client search is the primary method for you to locate clients. For a detailed description of the search feature, refer to the "Using the Search Feature" section. Follow these steps to troubleshoot a client using the search feature.
Step 1 ![]() Choose Monitor > Clients.
Choose Monitor > Clients.
Step 2 ![]() In the Quick Search area, type the MAC address of the client and click Search. The Search Results page appears (see Figure 11-13).
In the Quick Search area, type the MAC address of the client and click Search. The Search Results page appears (see Figure 11-13).
Figure 11-13 Search Results Page
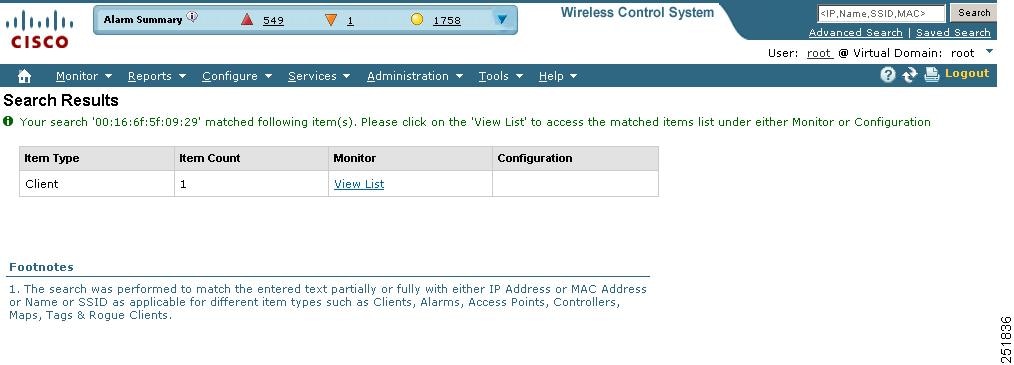
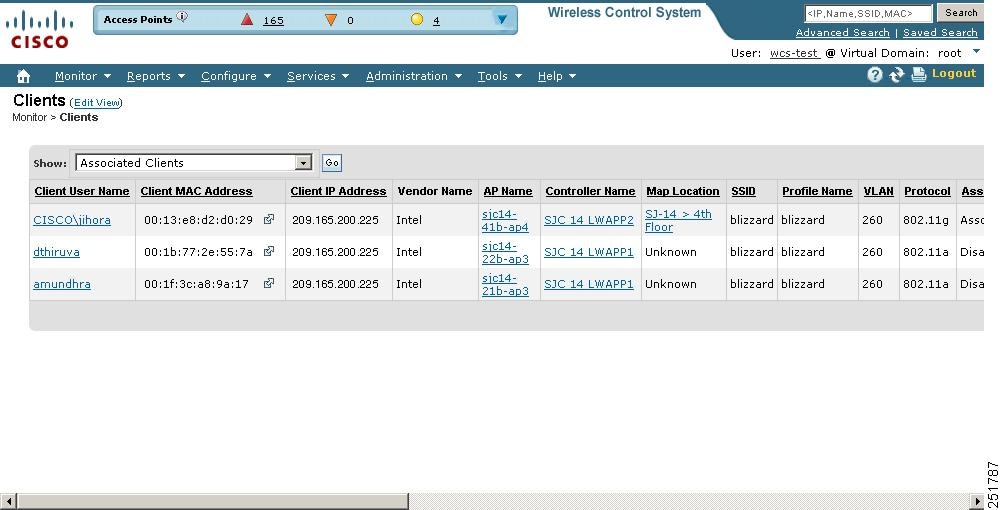
Step 3 ![]() Click View List to see the clients that matched the search criteria in the Clients page. The Monitor > Clients page appears (see Figure 11-14).
Click View List to see the clients that matched the search criteria in the Clients page. The Monitor > Clients page appears (see Figure 11-14).
Figure 11-14 Clients Page
|
|
|
|---|---|
Client Username |
The username of the client used for authentication. Clicking the client username displays detailed information about the client such as client properties, association history, and client status and performance statistics. |
Client IP Address |
The IP address of the client. |
Client MAC Address |
The MAC address of the client. The following MAC address formats are supported: • • • • • • |
Vendor Name |
The client's vendor information. |
AP Name |
The name of the access point to which the client is associated. Clicking the AP name displays information in the Monitor > Access Points page. |
Controller Name |
The IP address of the controller to which the client is registered. Clicking the controller name displays information in the Monitor > Controllers > System > Summary page. |
Map Location |
The physical location of the client (such as building, floor, and so on). Clicking the map location displays information in the Monitor > Maps page. |
SSID |
The SSID assigned to this WLAN. The access points broadcast the SSID on this WLAN. Different WLANs can use the same SSID as long as the Layer 2 security has a different value. |
Profile Name |
The profile name of the WLAN that the client is associated to or is trying to associate to. |
VLAN |
The client has successfully joined an access point for the given SSID. VLAN is the reverse lookup of the interface used by the WLAN on the controller side. |
Protocol |
Indicates whether the 802.11a/n or 802.11b/g/n protocol is being used. |
Association |
The state of the client. May be one of the following: • • • • • • • • |
Association Time |
The date and time that the status of the client last changed. |
Session Length |
The length of time the client has been in the current state. |
Authentication Type |
The 802.11authentication algorithm that is in use. |
Traffic (MB) |
The amount of client traffic (in MBs) for both inbound and outbound. |
Avg Session Throughput (kbps) |
The throughput averages across a session. |
Link Test |
Runs a link test of the client. See the "Enabling Automatic Client Troubleshooting" section section for further information. |
Automated Test Ran |
Indicates whether or not an automated test has been run. |
Authenticated |
Indicates whether the client has been authenticated. |
CCX |
Indicates the Cisco Compatible Extension version, if the client supports it. |
Client Host Name |
Specifies the client host name. |
Controller IP Address |
Clicking a controller IP address displays information from the Monitor > Controllers > System > Summary page. |
Port |
The port on the controller to which the client is connected. |
E2E |
Indicates whether E2E is supported. |
Encryption Cipher |
Encryption settings. |
Client IP Address |
The IP address of the client. |
The Monitor > Clients Page displays the following information:
Step 4 ![]() Click the troubleshooting icon to the right of the Client MAC Address that you want to troubleshoot. The Troubleshooting Client page appears (see Figure 11-15). If you are troubleshooting a Cisco Compatible Extension v5 client, your Troubleshooting Client page has additional tabs like the page referenced in Figure 11-19.
Click the troubleshooting icon to the right of the Client MAC Address that you want to troubleshoot. The Troubleshooting Client page appears (see Figure 11-15). If you are troubleshooting a Cisco Compatible Extension v5 client, your Troubleshooting Client page has additional tabs like the page referenced in Figure 11-19.
Note ![]() If you receive a message that the client does not seem to be connected to any access point, you must reconnect the client and click Refresh.
If you receive a message that the client does not seem to be connected to any access point, you must reconnect the client and click Refresh.
Figure 11-15 Troubleshooting Client Page
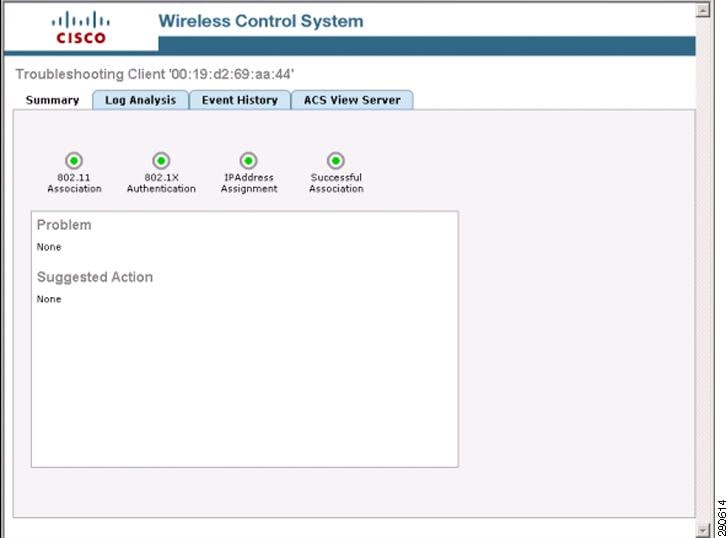
The summary page briefly describes the problem and recommends a course of action.
Note ![]() Some Cisco Compatible Extension features do not function properly when you use a web browser other than Mozilla Firefox 3.0 or later or Internet Explorer 7.0 or later on a Windows workstation.
Some Cisco Compatible Extension features do not function properly when you use a web browser other than Mozilla Firefox 3.0 or later or Internet Explorer 7.0 or later on a Windows workstation.
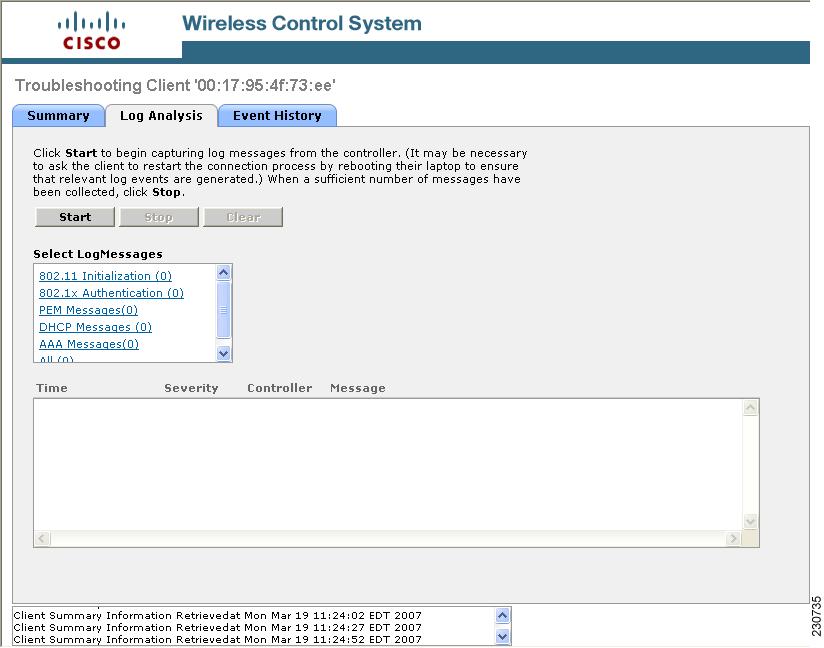
Step 5 ![]() To view log messages logged against the client, click the Log Analysis tab (see Figure 11-16).
To view log messages logged against the client, click the Log Analysis tab (see Figure 11-16).
Step 6 ![]() To begin capturing log messages about the client from the controller, click Start. To stop log message capture, click Stop. To clear all log messages, click Clear.
To begin capturing log messages about the client from the controller, click Start. To stop log message capture, click Stop. To clear all log messages, click Clear.
Note ![]() Log messages are captured for ten minutes and then stopped automatically. A user must click Start to continue.
Log messages are captured for ten minutes and then stopped automatically. A user must click Start to continue.
Step 7 ![]() To select log messages to display, click one of the links under Select Log Messages (the number between parentheses indicates the number of messages). The messages appear in the box. The message includes the following information:
To select log messages to display, click one of the links under Select Log Messages (the number between parentheses indicates the number of messages). The messages appear in the box. The message includes the following information:
•![]() A status message
A status message
•![]() The controller time
The controller time
•![]() A severity level of info or error (errors are displayed in red)
A severity level of info or error (errors are displayed in red)
•![]() The controller to which the client is connected
The controller to which the client is connected
Figure 11-16 Log Analysis Tab
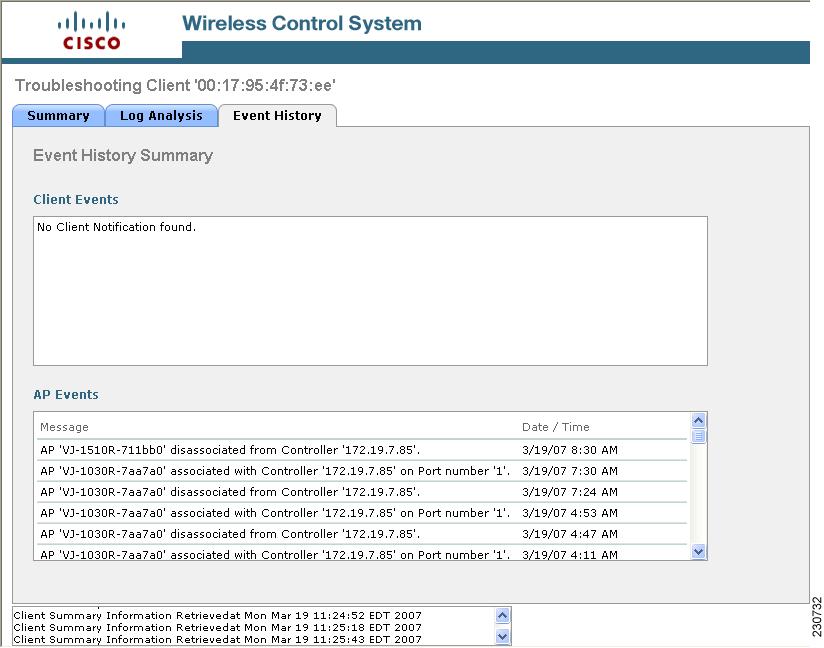
Step 8 ![]() To display a summary of the client's event history, click the Event History tab (see Figure 11-17).
To display a summary of the client's event history, click the Event History tab (see Figure 11-17).
Note ![]() If an access point that the client is associated to has Media Session Snooping enabled within the WLAN configuration, any Session Initiation Protocol (SIP) errors that are detected appear in the AP Events list.
If an access point that the client is associated to has Media Session Snooping enabled within the WLAN configuration, any Session Initiation Protocol (SIP) errors that are detected appear in the AP Events list.
This page displays client and access point events that occurred within the last 24 hours.
Figure 11-17 Event History Tab
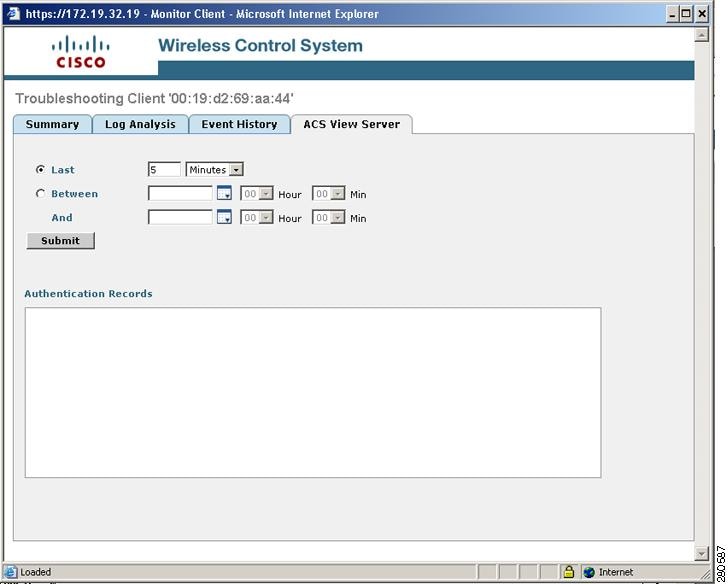
Step 9 ![]() If you click the ACS View Server tab, you can interact with the Cisco Access Control (ACS) System View Server (see Figure 11-18). You must have View Server credentials established before you can access this tab. (The tab will show the server list as empty if no view servers are configured.) See the "Configuring ACS View Server Credentials" section for steps on establishing credentials.
If you click the ACS View Server tab, you can interact with the Cisco Access Control (ACS) System View Server (see Figure 11-18). You must have View Server credentials established before you can access this tab. (The tab will show the server list as empty if no view servers are configured.) See the "Configuring ACS View Server Credentials" section for steps on establishing credentials.
This server provides WCS with aggregated client status information from multiple ACS servers. The client status information allows you to further troubleshoot client issues and determine whether they are related to authentication or authorization. Enter the date and time ranges to retrieve the historical authentication and authorization information and click Submit. The results of the query are displayed in the Authentication Records portion of the page and is used as a filter for the userid logged into the client.
Figure 11-18 ACS View Server Page
Step 10 ![]() (Optional) If Cisco Compatible Extension Version 5 clients are available, you can click a Test Analysis tab as shown in Figure 11-19.
(Optional) If Cisco Compatible Extension Version 5 clients are available, you can click a Test Analysis tab as shown in Figure 11-19.
Figure 11-19 Test Analysis Tab
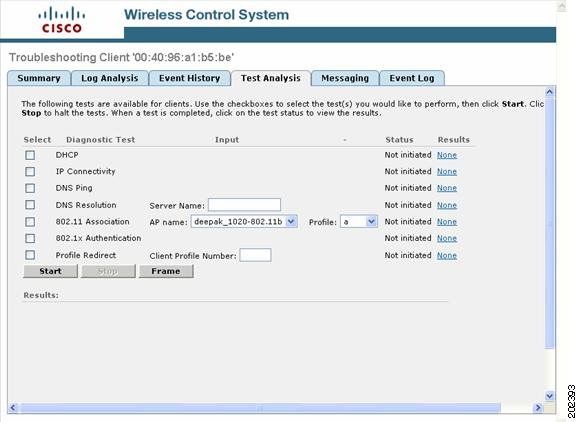
The Test Analysis tab allows you to run a variety of diagnostic tests on the client. Click the check box for the applicable diagnostic test, enter any appropriate input information and click Start. The following diagnostic tests are available:
•![]() DHCP—Executes a complete DHCP Discover/Offer/Request/ACK exchange to determine that the DHCP is operating properly between the controller and the client.
DHCP—Executes a complete DHCP Discover/Offer/Request/ACK exchange to determine that the DHCP is operating properly between the controller and the client.
•![]() IP Connectivity—Causes the client to execute a ping test of the default gateway obtained in the DHCP test in order to verify that IP connectivity exists on the local subnet.
IP Connectivity—Causes the client to execute a ping test of the default gateway obtained in the DHCP test in order to verify that IP connectivity exists on the local subnet.
•![]() DNS Ping—Causes the client to execute a ping test of the DNS server obtained in the DHCP test in order to verify that IP connectivity exists to the DNS server.
DNS Ping—Causes the client to execute a ping test of the DNS server obtained in the DHCP test in order to verify that IP connectivity exists to the DNS server.
•![]() DNS Resolution—Causes the DNS client to attempt to resolve a network name known to be resolvable in order to verify that name resolution is functioning correctly.
DNS Resolution—Causes the DNS client to attempt to resolve a network name known to be resolvable in order to verify that name resolution is functioning correctly.
•![]() 802.11 Association—Directs an association to be completed with a specific access point to in order to verify that the client is able to associate properly with a designated WLAN.
802.11 Association—Directs an association to be completed with a specific access point to in order to verify that the client is able to associate properly with a designated WLAN.
•![]() 802.1X Authentication—Directs an association and 802.1X authentication to be completed with a specific access point in order to verify that the client is able to properly complete an 802.1x authentication.
802.1X Authentication—Directs an association and 802.1X authentication to be completed with a specific access point in order to verify that the client is able to properly complete an 802.1x authentication.
•![]() Profile Redirect—At any time, the diagnostic system may direct the client to activate one of the client's configured WLAN profiles and to continue operation under that profile.
Profile Redirect—At any time, the diagnostic system may direct the client to activate one of the client's configured WLAN profiles and to continue operation under that profile.
Note ![]() To run the profile diagnostic test, the client must be on the diagnostic channel. This test uses the profile number as an input. To indicate a wildcard redirect, enter 0. With this redirect, the client is asked to disassociate from the diagnostic channel and to associate with any profile. You can also enter a valid profile ID. Because the client is on the diagnostic channel when the test is run, only one profile is returned in the profile list. You should use this profile ID in the profile redirect test (when wildcard redirecting is not desired).
To run the profile diagnostic test, the client must be on the diagnostic channel. This test uses the profile number as an input. To indicate a wildcard redirect, enter 0. With this redirect, the client is asked to disassociate from the diagnostic channel and to associate with any profile. You can also enter a valid profile ID. Because the client is on the diagnostic channel when the test is run, only one profile is returned in the profile list. You should use this profile ID in the profile redirect test (when wildcard redirecting is not desired).
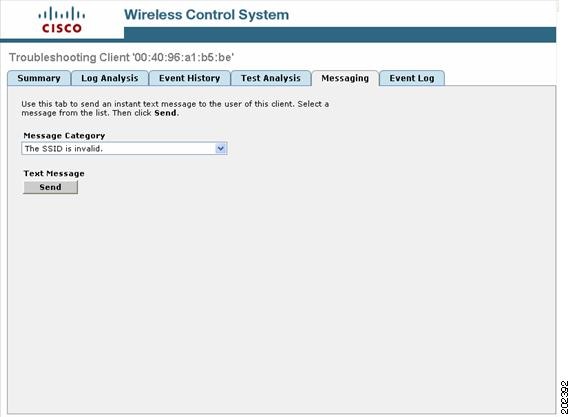
Step 11 ![]() (Optional) If Cisco Compatible Extension Version 5 clients are available, a Messaging tab as shown in Figure 11-20 appears. Use this tab to send an instant text message to the user of this client. From the Message Category drop-down list, choose a message and click Send.
(Optional) If Cisco Compatible Extension Version 5 clients are available, a Messaging tab as shown in Figure 11-20 appears. Use this tab to send an instant text message to the user of this client. From the Message Category drop-down list, choose a message and click Send.
Figure 11-20 Messaging Tab
Step 12 ![]() Close the Troubleshooting Client page.
Close the Troubleshooting Client page.
 Feedback