Prometheus and Grafana

Introduction

CPS system, application statistics and Key Performance Indicators (KPI) are collected by the system and are displayed using a browser-based graphical metrics tool. This chapter provides a high-level overview of the tools CPS uses to collect and display these statistics.

Prometheus

Prometheus is an application that is used to actively gather statistics and trigger alerts from the running virtual machines and application services. The CPS vDRA cluster deploys the following Prometheus services on each control node and on the master node:

  • Prometheus Hi-Res – this instance of the Prometheus service is monitoring the system at 5 second intervals with 48-hour history

  • Prometheus Trending – this instance of the Prometheus service is monitoring the system at 20 second intervals with 30-day history

  • Prometheus Planning – this instance of the Prometheus service is monitoring the system at 120 second intervals with 365-day history

Internally, the Prometheus servers scrape statistics from target statistics sources on a regular basis. The following target data sources are included:
  • Host Node Exporter for Host VM statistics.

  • Mongo DB Exporter for Database statistics.

  • Application Statistics.

In addition to scrapping, statistics in the Prometheus servers can be configured using the Management CLI alert rule command to trigger alerts on error conditions. In this scenario, a user defines the alert rule and the configuration for that rule is pushed into the Prometheus servers. It can generate SNMPv2 and SNMPv3 alarm based on the NMS destination configured in the system. You can configure multiple SNMP destination (SNMPv2, SNMPv3) to receive the alarms at multiple NMS.


Note

Currently, SNMP get and walk facility is not supported.


For more information on Prometheus, refer https://prometheus.io/.

Prometheus Queries

The CPS vDRA supports exposing of Prometheus API queries on OAM network using HAProxy. vDRA allows operators to fetch necessary statistics from the system through the Prometheus API and further analyze in a single consolidated view. The following functions are supported:

  • vDRA data gets pulled from Prometheus API and loaded directly into system for visualization. This includes data from the following three data stores:

    • Prometheus Hi-Res

    • Prometheus Trending

    • Prometheus Planning

  • The Maximum TPS that is required for enabling these queries at required intervals are:

    • TPS: The TPS value is 160K.

    • Intervals: one minute and five minutes

  • GET queries: GET /api/v1/query

  • TLS or HTTPS-based authentication

Following statistics are collected from target sources and are available through Prometheus APIs:

  • Host Node Exporter for Host VM statistics

  • Mongo DB Exporter for Database statistics

  • Application Statistics

Configuring HAProxy

To expose the Prometheus data to external users, you should modify HAProxy configurations on haproxy-common containers.

Set up HAProxy configurations to accept incoming requests on port 443. HAProxy then checks their URL paths or Prometheus and then forwards them to the correct backend.

The frontend and backend settings are segregated based on the URLs that are used for querying and the backend data stores respectively.

For example, different configurations are considered for frontend of Prometheus hi-res data where the backend is the Prometheus hi-res data store. Similarly, different configurations are used for Prometheus planning and trending data stores.

The following endpoint evaluates an instant query at a single point in time: GET /api/v1/query

Example 1:
curl -v -k -u 
admin:admin https://172.18.63.223/trending_prometheus
/api/v1/query_range?query="sum((docker_service_up%7Bcontainer_name%
20%3D~%20%22diameter-endpoint-s.*%22%7D%3D%3D2)%2F2)
&start=1639029600&end=1639029915&step=15"
Example 2:
curl -v -k -u
admin:admin https://172.18.63.223/trending_prometheus
/api/v1/query_range?query="sum((docker_service_up
%7Bcontainer_name%20%3D~%20%22binding-s.*%22%7D%3D%3D2)%2F2)&
start=1639029675&end=1639029990&step=15"

Exposing Prometheus Hi-res, Trending, and Planning Data

Use the following table details to expose Prometheus Hi-res, trending, and planning data.


Note

Installer IP refers to the virtual IP of OAM servers (master/control-0/control-1) that are exposed to external users. The Query field is provided with the required Prometheus queries.

Prometheus Service

Description

URL

Authentication

Prometheus

- Hi-res data

This instance of the Prometheus service monitors the system at 5 second intervals with 48-hour history.

"https://installer/hi_res_prometheus

/api/v1/query_range?query="" "

HTTPS or TLS-based authentication is supported.

Prometheus

- Trending

This Prometheus service monitors the system at 20 second intervals with 30-day history.

https://installer/trending_prometheus

/api/v1/query_range?query=” ”

HTTPS or TLS-based authentication is supported.

Prometheus

- Planning

This Prometheus service monitors the system at 120 second intervals with 365-day history.

https://installer/planning_prometheus

/api/v1/query_range?query=” ”

HTTPS or TLS-based authentication is supported,

Grafana

Grafana is a third-party metrics dashboard and graph editor provided with CPS 7.0 and higher. Grafana provides a graphical or text-based representation of statistics and counters collected in the Prometheus database.


Note

After the DRA Director (DD) failover/reboot, the TPS values in Grafana dashboards takes approx. 5 minutes to fetch and display the latest updated values. Until the values are updated, Grafana displays the old data.


Additional Grafana Documentation

This chapter provides information about the CPS implementation of Grafana. For more information about Grafana, or access the general Grafana documentation, refer to: http://docs.grafana.org.

Data Source Supported

The CPS implementation uses the Prometheus data source and does not use Graphite for queries. This requires the definition of queries to use the Prometheus query format as defined in https://prometheus.io/docs/querying/basics/.


Note

After changing respective KPI panel's width to 24 (which is maximum), you can get all the spikes captured for 6 hours duration. So, if tou need to analyse longevity report for 12 hours or more, you can grep data by grouping in 6 hours interval.


Note

If the control VM that hosts Grafana goes down, then the Prometheus data also not available during that downtime after the same control VM (hosting Grafana) is back. This results in some missing data. As a workaround, you can add the Prometheus datasource of other control VM in Grafana UI that was up during that downtime and view the missing statistics.


Note

The top command output must not be compared with the Grafana CPU statistics panel display.


Manage Grafana Users


Note

In Grafana, admin users can invite new users by email or a link. However, this is not supported in CPS vDRA.


Perform the following to add a new Grafana:

  1. Enter config mode

    scheduler# config
    Entering configuration mode terminal
    scheduler(config)# 
    
  2. Enter the aaa authentication command to create the user:

    scheduler(config)# aaa authentication users user test2 gid 100 uid 9000 homedir / password testpassword ssh_keydir /
    scheduler(config-user-test2)# commit
    scheduler(config-user-test2)# exit
    

    Note

    The gid, uid, homedir and ssh_keydir are required but not used by the application.

Add User To A Viewer Operational Group

In config mode, add the user to the “oper” group and commit as follows:

scheduler(config)# nacm groups group oper user-name test2 
scheduler(config-group-oper)# commit

Add User To A Grafana Editor Group

In config mode, add the user to the “grafana-editor” group and commit as follows:

scheduler(config)# nacm groups group grafana-editor user-name test2 
scheduler(config-group-grafana-editor)# commit

Add User To A Grafana Admin Group

In config mode, add the user to the “grafana-admin” group and commit as follows:

scheduler(config)# nacm groups group grafana-admin user-name test2 
scheduler(config-group-grafana-admin)# commit

Change A Grafana Users Password

In the Management CLI, issue the aaa authentication users user change-password command as follows:

scheduler# aaa authentication users user test2 change-password 
Value for 'old-password' (<string>): ************
Value for 'new-password' (<string>): ********
Value for 'confirm-password' (<string>): ********
scheduler# 
System message at 2017-03-08 21:17:18...
Commit performed by system via system using system.

Specify Access Restrictions for a Group

For more information, see the nacm rule-list command.

Connect to Grafana

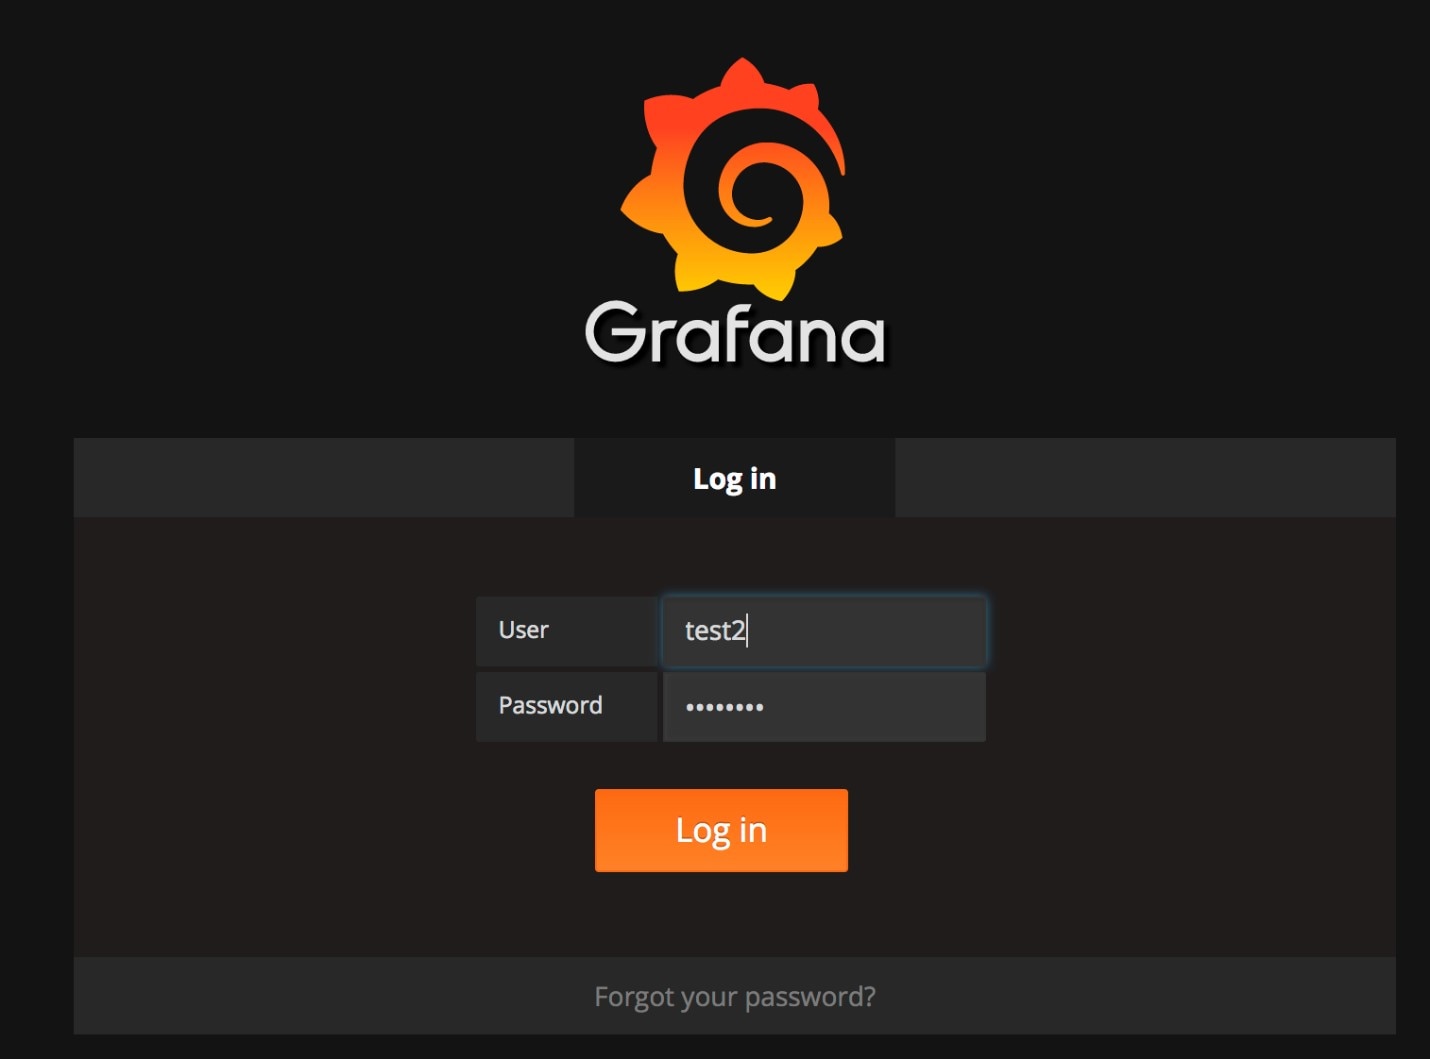
Use the following URL to access Grafana and enter the user name and password:

https://<masterip>/grafana/
Figure 1. Grafana Login

Attention

DRA is using the Grafana login page maintained as a part of Grafana code base. By default, when you open a web page in a new tab by clicking on a link with target="_blank", you allow an attacker to redirect users clicking such a link to another web page. The issue is that the redirect concerns the initial tab (your web page), not the newly opened window. Also, the redirect is done without any warning. This can be used as a very effective phishing method. This kind of phishing method is called (reverse) tab nabbing. This issue of target="_blank" attribute is present in Grafana 5.2.3 used by DRA.

If you have to use target="_blank" attribute, you must also add : rel="noopener". This attribute sets the window.opener value to null (forbids any URL change on the referring page). The rel="noopenener" attribute has been added in the latest version of Grafana for fixing this issue.

This is not a security vulnerability in CPS product. CPS uses Grafana in a controlled environment and no tab nabbing is possible.


Grafana Roles

The following types of user roles are supported:

  • Admin: An admin user can view, update and create dashboards. Also, the admin can edit and add data sources and organization users.

  • Viewer: A viewer can only view dashboards and cannot not save or create them.

  • Editor: An editor can view, update and create dashboards.