Operations Overview
The Operation page enables you to access various interfaces and perform operations, maintenance, and troubleshooting activities. It assists system administrators and network engineers to operate and monitor the Policy Server.
The documentation set for this product strives to use bias-free language. For the purposes of this documentation set, bias-free is defined as language that does not imply discrimination based on age, disability, gender, racial identity, ethnic identity, sexual orientation, socioeconomic status, and intersectionality. Exceptions may be present in the documentation due to language that is hardcoded in the user interfaces of the product software, language used based on RFP documentation, or language that is used by a referenced third-party product. Learn more about how Cisco is using Inclusive Language.
The Operation page enables you to access various interfaces and perform operations, maintenance, and troubleshooting activities. It assists system administrators and network engineers to operate and monitor the Policy Server.
DRA monitoring page under operations includes the following options:
DRA Peer Monitoring
DRA Binding Monitoring
DRA SLF Bindings
DRA Relay Connection
Grafana
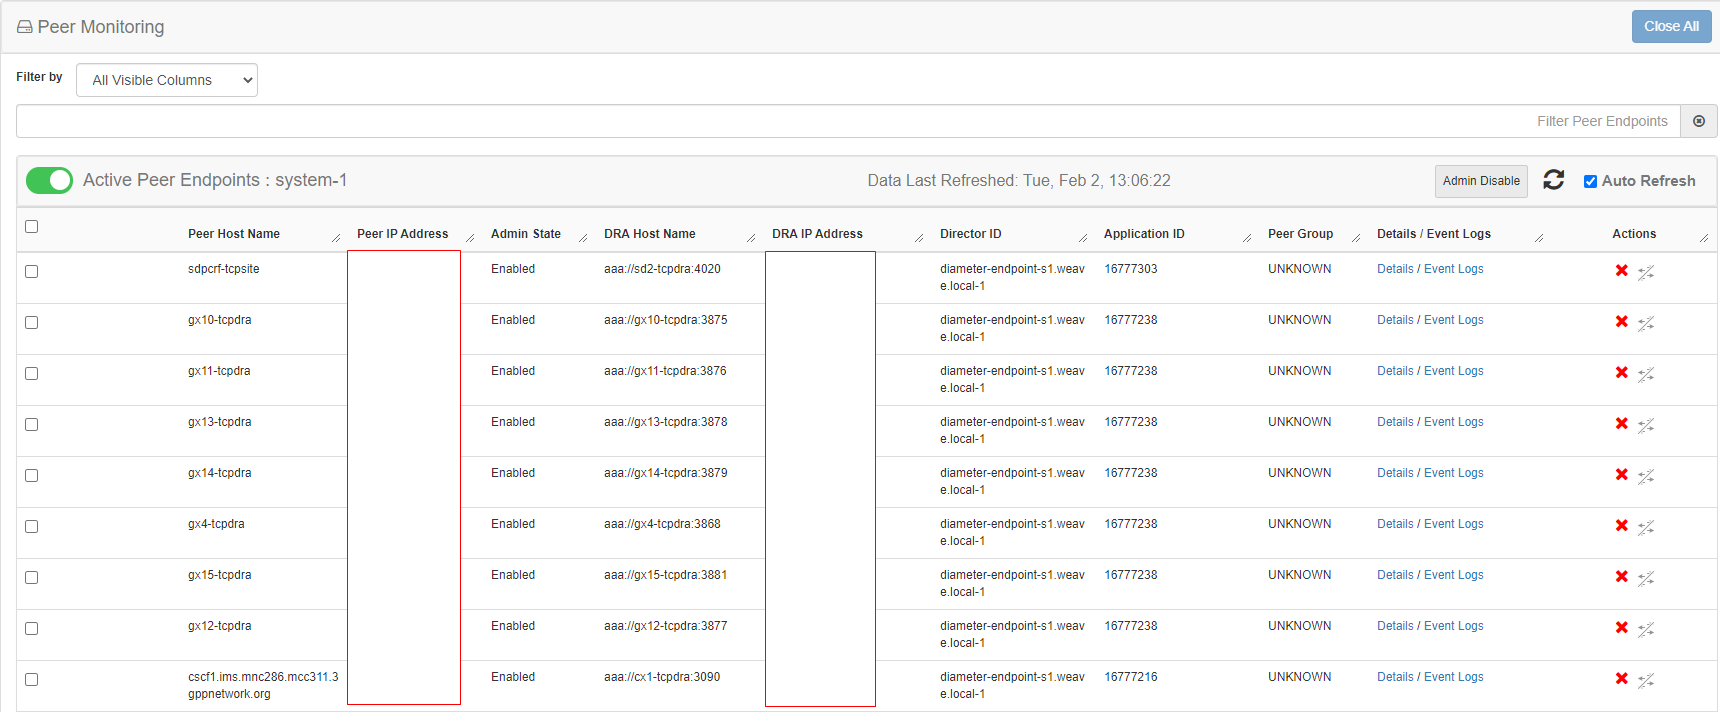
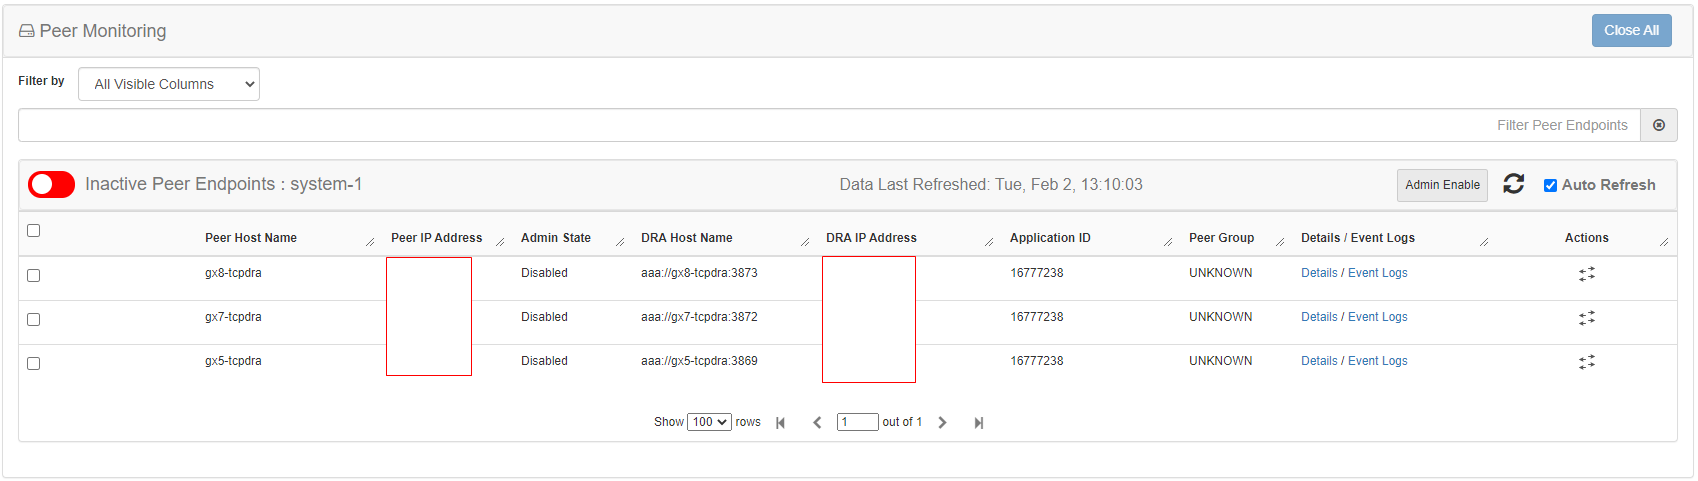
DRA peer monitoring page displays the active peer endpoints (by default) for the cluster node. You can click the toggle for active/inactive peers to view the active or inactive peer endpoints.
The active and inactive peer monitoring screens have resize option for each column. You can use the scrollbar to view multiple values.
When the page is loaded, the Auto-refresh checkbox is enabled by default which refreshes peers data every 30 seconds. You can stop this functionality by disabling the checkbox. After every refresh, the Data Last Refreshed field is updated with the locale time.
You can use the filter option to filter active and inactive peer endpoints. You can also view all event logs and peer details for specific active or inactive peer endpoints of the cluster node.
Pagination support is provided in active and inactive peer endpoints table data. A number of rows per page drop-down is displayed below each table which contains the different set of numbers indicating the number of rows which can be shown per page. This option enables you to perform the following tasks:
Select the number of rows to be displayed in each page.
Specify the page to which you want to navigate.
You can use the Close All option to close all the displayed popups. By default the Close All option is disabled. If you have many popups open, the Close All option gets enabled.
| Step 1 |
In CPS DRA, navigate to DRA Peer Monitoring. |
||||||||||||||||||||||||||||||||||||||||||||
| Step 2 |
Select the Filter by drop-down and click on any one of the following data options displayed:
|
||||||||||||||||||||||||||||||||||||||||||||
| Step 3 |
Enter a value in the Filter Peer Endpoints option. |
||||||||||||||||||||||||||||||||||||||||||||
| Step 4 |
Click Toggle for Active Peers to view filtered active peer endpoints or Toggle for Inactive Peers to view filtered inactive peer endpoints. Under Active Peer Endpoints:
Under Inactive Peer Endpoints:
The following tables describe the details displayed under Peer Endpoints section:
You can use the refresh option provided next to the toggle for active/inactive peer endpoints to refresh the table data. You can enable the Auto-refresh checkbox to refresh data every 30 seconds. The Data Last Refreshed field displays time when data is fetched from server. |
| Step 1 |
In CPS DRA, navigate to DRA Peer Monitoring. |
||||||||||||||||||||||
| Step 2 |
Click Toggle for Active Peers to view active peer endpoints or Toggle for Inactive Peers to view inactive peer endpoints. |
||||||||||||||||||||||
| Step 3 |
To view details of a particular peer, click Details. 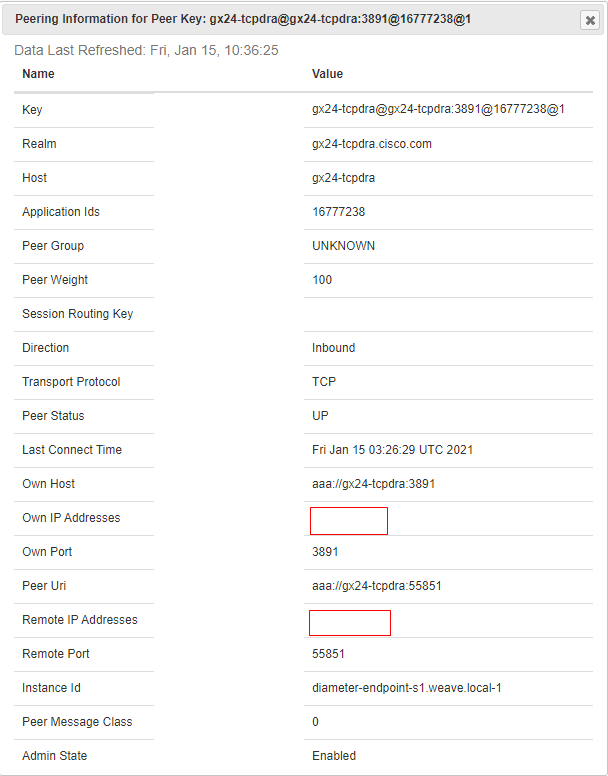
The following details are displayed:
If the Auto-refresh checkbox is enabled, the Data Last Refreshed field is displayed at the top of the Details dialog box of the selected peer. When you select Details modal, the Data Last refreshed field displays the time at which peers data was last refreshed. If the aAuto-refresh is performed when modal is opened, Data Last refreshed time in the modal is not updated and you have to re-open the modal to view the updated data. |
| Step 1 |
In CPS DRA, navigate to DRA Peer Monitoring. |
| Step 2 |
Click Toggle for Active Peers to view active peer endpoints or Toggle for Inactive Peers to view inactive peer endpoints. |
| Step 3 |
To view event logs of a particular peer, click Event Logs. The Peer Status Logs is displayed. If the Auto-refresh checkbox is enabled, the Data Last Refreshed field is displayed at the top of the Event Logs dialog box of the selected peer. When you select Event Logs modal, the Data Last Refreshed field displays the time at which modal is opened. The data is not updated when the modal is opened. You have to re-open the modal to get the updated data. Event log data is independent of auto refresh data. |
CPS vDRA stores bindings in the mongo database. A binding database is needed to map search keys to PCRF binding information. Each binding has a search key and binding data associated with it.
You can access CPS vDRA binding information based on the following supported search keys:
IMSI
IMSI + APN
MSISDN
MSISDN + APN
IPv6
IPv4
Perform the following steps to view DRA binding details:
| Step 1 |
In CPS DRA, navigate to DRA Binding Monitoring. |
||||||||||||||
| Step 2 |
To view CPS vDRA binding information for a supported search key, click on any one of the following options displayed in the DRA Binding page:
|
||||||||||||||
| Step 3 |
Enter the required value. The search button is enabled which when clicked displays the following binding details:
|
| Step 1 |
In CPS DRA, navigate to DRA Binding Monitoring. |
||||||||||||||||||||||||||||
| Step 2 |
Select a supported search key and provide an input value in the search input field. |
||||||||||||||||||||||||||||
| Step 3 |
Click Search. CPS vDRA Bindings is displayed with two links for Gx Session ID and Details in each row. |
||||||||||||||||||||||||||||
| Step 4 |
To view Gx session details, click Gx Session ID.
|
| Step 1 |
In CPS DRA, navigate to DRA Binding Monitoring. |
||||||||||||||
| Step 2 |
Select a supported search key and provide an input value in the search input field. |
||||||||||||||
| Step 3 |
Click Search. CPS vDRA Bindings is displayed with two links for Gx Session ID and Details in each row. |
||||||||||||||
| Step 4 |
To view details, click Details. The following details are displayed in a details popup:
|
This section describes how to view SLF Bindings details.
Perform the following steps to view SLF binding details:
|
In CPS DRA, navigate to DRA SLF Monitoring.
|
| Step 1 |
Select Subscriber ID. |
||||||||||||||
| Step 2 |
Enter a valid subscriber ID. |
||||||||||||||
| Step 3 |
Click Search.
|
||||||||||||||
| Step 4 |
Click Details.
|
| Step 1 |
Select IMSI. |
||||||||||||||
| Step 2 |
Enter a valid IMSI. |
||||||||||||||
| Step 3 |
Click Search.
|
||||||||||||||
| Step 4 |
Click Details.
|
| Step 1 |
Select MSISDN. |
||||||||||||||
| Step 2 |
Enter a valid MSISDN. |
||||||||||||||
| Step 3 |
Click Search.
|
||||||||||||||
| Step 4 |
Click Details.
|
You can monitor different relay connections to remote DRAs using the DRA Relay Connection option.
Perform the following steps to view relay connections:
| Step 1 |
Navigate to DRA Relay Connection. |
||||||||||||||||||
| Step 2 |
Select the Filter by drop down and click on any one of the following data options displayed:
|
||||||||||||||||||
| Step 3 |
Enter a value in the Filter Relay Connections field. |
||||||||||||||||||
| Step 4 |
Click Toggle for Active Relays to view filtered active relay endpoints or Toggle for Inactive Relays to view filtered inactive relay endpoints. The following table describes the details displayed under Relay Connections:
You can check the Auto-refresh checkbox to refresh data every 30 seconds. The Data Last Refreshed field displays time when data is fetched from server |
Perform the following steps to view relay details:
| Step 1 |
Navigate to DRA Relay Connection. |
||||||||||||||||||||||||
| Step 2 |
Click Toggle for Active Relays to view filtered active relay endpoints or Toggle for Inactive Relays to view filtered inactive relay endpoints. |
||||||||||||||||||||||||
| Step 3 |
To view details of a particular relay connection, click Details. The following details are displayed:
If the Auto-refresh checkbox is checked, the Data Last Refreshed field is displayed at the top of the Details dialog box of the selected peer. When you select the Details modal, the Data Last Refreshed field displays the time at which data was last refreshed. If the Auto-refresh is performed when the modal is opened, Data Last refreshed time in the modal is not updated and you have to reopen the modal to view the updated data. |
Perform the following steps to view relay event logs:
| Step 1 |
Navigate to DRA Relay Connection. |
| Step 2 |
Click Toggle for Active Relays to view filtered active relay endpoints or Toggle for Inactive Relays to view filtered inactive relay endpoints. |
| Step 3 |
To view event logs of a particular relay connection, click Event Logs. The Event Logs for Relay Key is displayed. If the Auto-refresh checkbox is enabled, the Data Last Refreshed field is displayed at the top of the Event Logs dialog box of the selected peer. When you select Event Logs modal, the Data Last Refreshed field displays the time at which modal is opened. The data is not updated when the modal is opened. You have to re-open the modal to get the updated data. Event log data is independent of auto refresh data. |
You can access the Grafana interface under DRA Monitoring to monitor installation. It is a third-party metrics dashboard and graph editor. Grafana provides a graphical or text-based representation of statistics and counters collected in the Prometheus database.
 Note |
After the DRA Director (DD) failover/reboot, the TPS values in Grafana dashboards takes approx. 5 minutes to fetch and display the latest updated values. Until the values are updated, Grafana displays the old data. |
For more information about Grafana in vDRA, refer to the Prometheus and Grafana chapter in the CPS vDRA Operations Guide.
API information option enables you to view API related information:
Service Orchestration API: to manage Policy Builder data
Select the link to view the documentation and usage examples.
 Feedback