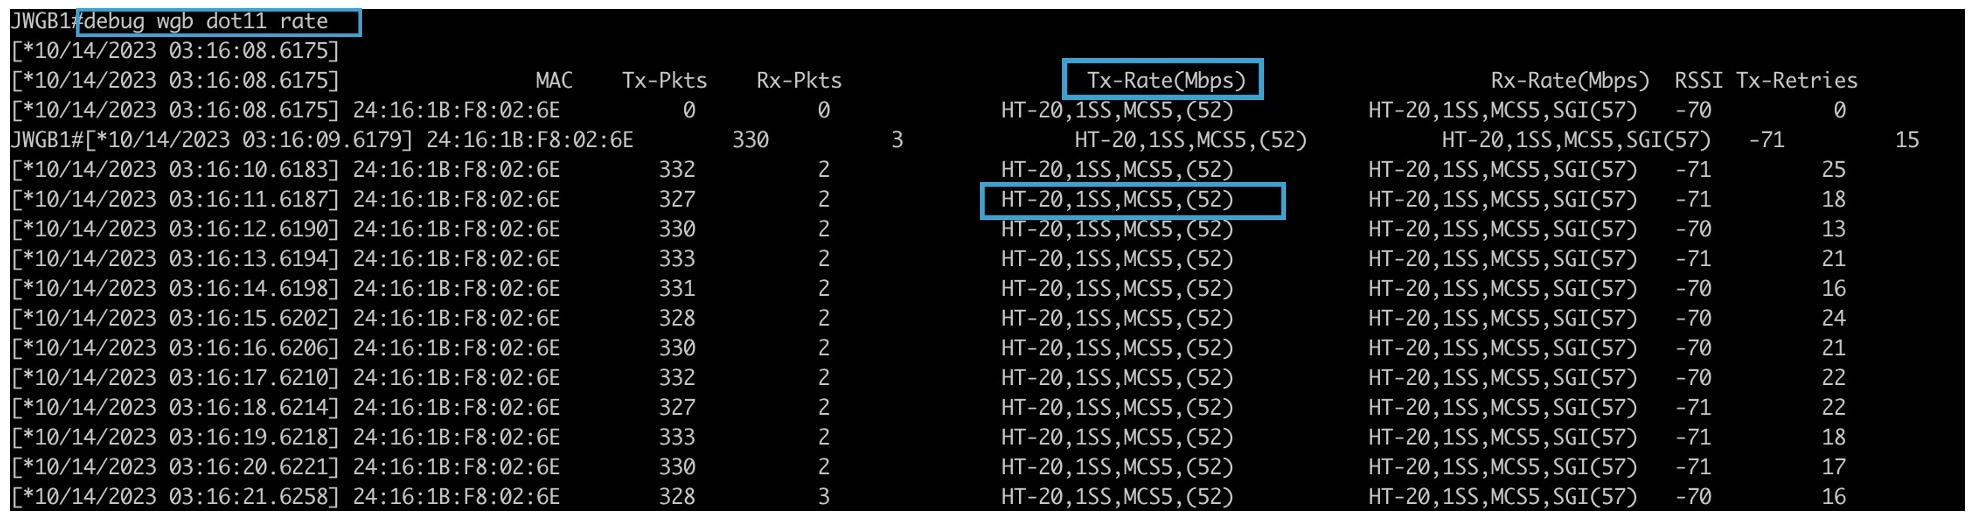
The debug wgb dot11 rate command displays debugging information related to data rates negotiated. It helps troubleshoot connectivity, performance,
or roaming issues by showing how the WGB selects and uses data rates when communicating with the access point.
Device# debug wgb dot11 rate

[*03/13/2023 18:00:08.7814]                MAC    Tx-Pkts    Rx-Pkts                    Tx-Rate(Mbps)                    Rx-Rate(Mbps)  RSSI   SNR Tx-Retries
[*03/13/2023 18:00:08.7814] FC:58:9A:17:C2:51          0          0       HE-20,2SS,MCS6,GI0.8 (154)       HE-20,3SS,MCS4,GI0.8 (154)   -30    62          0
[*03/13/2023 18:00:09.7818] FC:58:9A:17:C2:51          0          0       HE-20,2SS,MCS6,GI0.8 (154)       HE-20,3SS,MCS4,GI0.8 (154)   -30    62          0
In this example, FC:58:9A:17:C2:51 is the parent AP radio MAC.
The show interfaces dot11Radio slot-idstatistics command displays detailed statistics for a wireless radio interface. It provides information such as transmitted and received
packets, errors, retries, signal quality, and other performance metrics. This is useful for monitoring the health of the radio
interface, identifying connectivity issues, and troubleshooting wireless performance.
Device# show interfaces dot11Radio 1 statistics

Dot11Radio Statistics:
        DOT11 Statistics (Cumulative Total/Last 5 Seconds):
RECEIVER                                TRANSMITTER
Host Rx K Bytes:        965570/0        Host Tx K Bytes:       1611903/0
Unicasts Rx:            379274/0        Unicasts Tx:           2688665/0
Broadcasts Rx:         3166311/0        Broadcasts Tx:               0/0
Beacons Rx:          722130099/1631     Beacons Tx:          367240960/784
Probes Rx:           588627347/2224     Probes Tx:            78934926/80
Multicasts Rx:         3231513/0        Multicasts Tx:           53355/0
Mgmt Packets Rx:     764747086/1769     Mgmt Packets Tx:     446292853/864
Ctrl Frames Rx:        7316214/5        Ctrl Frames Tx:              0/0
RTS received:                0/0        RTS transmitted:             0/0
Duplicate frames:            0/0        CTS not received:            0/0
MIC errors:                  0/0        WEP errors:            2279546/0
FCS errors:                  0/0        Retries:                896973/0
Key Index errors:            0/0        Tx Failures:              8871/0
                                        Tx Drops:                    0/0

Rate Statistics for Radio::
[Legacy]:
6 Mbps:
 Rx Packets:     159053/0            Tx Packets:      88650/0
                                     Tx Retries:       2382/0
9 Mbps:
 Rx Packets:         43/0            Tx Packets:         23/0
                                     Tx Retries:         71/0
12 Mbps:
 Rx Packets:          1/0            Tx Packets:        119/0
                                     Tx Retries:        185/0
18 Mbps:
 Rx Packets:          0/0            Tx Packets:          5/0
                                     Tx Retries:        134/0
24 Mbps:
 Rx Packets:        235/0            Tx Packets:      20993/0
                                     Tx Retries:       5048/0
36 Mbps:
 Rx Packets:          0/0            Tx Packets:        781/0
                                     Tx Retries:        227/0
54 Mbps:
 Rx Packets:        133/0            Tx Packets:       9347/0
                                     Tx Retries:       1792/0

[SU]:
M0:
 Rx Packets:          7/0            Tx Packets:          0/0
                                     Tx Retries:          6/0
M1:
 Rx Packets:       1615/0            Tx Packets:      35035/0
                                     Tx Retries:       3751/0
M2:
 Rx Packets:      15277/0            Tx Packets:     133738/0
                                     Tx Retries:      22654/0
M3:
 Rx Packets:      10232/0            Tx Packets:       1580/0
                                     Tx Retries:      21271/0
M4:
 Rx Packets:     218143/0            Tx Packets:     190408/0
                                     Tx Retries:      36444/0
M5:
 Rx Packets:     399283/0            Tx Packets:     542491/0
                                     Tx Retries:     164048/0
M6:
 Rx Packets:    3136519/0            Tx Packets:     821537/0
                                     Tx Retries:     329003/0
M7:
 Rx Packets:    1171128/0            Tx Packets:     303414/0
                                     Tx Retries:     154014/0


Beacons missed: 0-30s 31-60s 61-90s 90s+
                     2      0      0    0
The show wgb dot11 uplink latency command displays latency statistics for the Workgroup Bridge (WGB) uplink connection to the access point (AP). It helps measure
the time taken for frames to traverse from the WGB to the AP, providing insight into wireless link performance and potential
delay issues.
AP# show wgb dot11 uplink latency

Latency Group Total Packets Total Latency Excellent(0-8) Very Good(8-16) Good (16-32 ms) Medium (32-64ms) Poor (64-256 ms) Very Poor (256+ ms)
        AC_BK             0             0              0               0               0                0                0                   0
        AC_BE          1840       4243793           1809              10              14                7                0                   0
        AC_VI             0             0              0               0               0                0                0                   0
        AC_VO            24         54134             24               0               0                0                0                   0
The show wgb dot11 uplink command displays information about the Workgroup Bridge (WGB) uplink to the access point (AP). It provides details such as
the associated SSID, BSSID, channel, signal strength, data rates, authentication type, and overall status of the uplink connection.
This is useful for verifying connectivity and monitoring the WGB’s wireless link to the AP.
AP# show wgb dot11 uplink

HE Rates: 1SS:M0-11 2SS:M0-11
Additional info for client 8C:84:42:92:FF:CF
RSSI: -24
PS  : Legacy (Awake)
Tx Rate: 278730 Kbps
Rx Rate: 410220 Kbps
VHT_TXMAP: 65530
CCX Ver: 5
Rx Key-Index Errs: 0
              mac     intf TxData TxUC TxBytes TxFail TxDcrd TxCumRetries MultiRetries MaxRetriesFail RxData RxBytes RxErr                 TxRt(Mbps)                 RxRt(Mbps)   LER PER stats_ago
8C:84:42:92:FF:CF wbridge1   1341 1341  184032      0      0          543           96              0    317   33523     0 HE-40,2SS,MCS6,GI0.8 (309) HE-40,2SS,MCS9,GI0.8 (458) 27272   0  1.370000
Per TID packet statistics for client 8C:84:42:92:FF:CF
Priority Rx Pkts Tx Pkts Rx(last 5 s) Tx (last 5 s)
       0      35    1314            0             8
       1       0       0            0             0
       2       0       0            0             0
       3       0       0            0             0
       4       0       0            0             0
       5       0       0            0             0
       6     182      24            1             0
       7       3       3            0             0
Rate Statistics:
Rate-Index    Rx-Pkts    Tx-Pkts Tx-Retries
         0         99          3          0
         4          1          1          9
         5         21         39         35
         6         31        185         64
         7         26        124         68
         8         28        293         82
         9         77        401        151
        10         32        140         97
        11          2        156         37


 Feedback