System and Message Logging

System and Message Logging

System logging allows controllers to log their system events to up to three remote syslog servers. The controller sends a copy of each syslog message as it is logged to each syslog server configured on the controller. Being able to send the syslog messages to multiple servers ensures that the messages are not lost due to the temporary unavailability of one syslog server. Message logging allows system messages to be logged to the controller buffer or console.

For more information about system messages and trap logs, see http://www.cisco.com/c/en/us/support/wireless/wireless-lan-controller-software/products-system-message-guides-list.html.

This section contains the following subsections:

Configuring System and Message Logging (GUI)

Procedure


Step 1

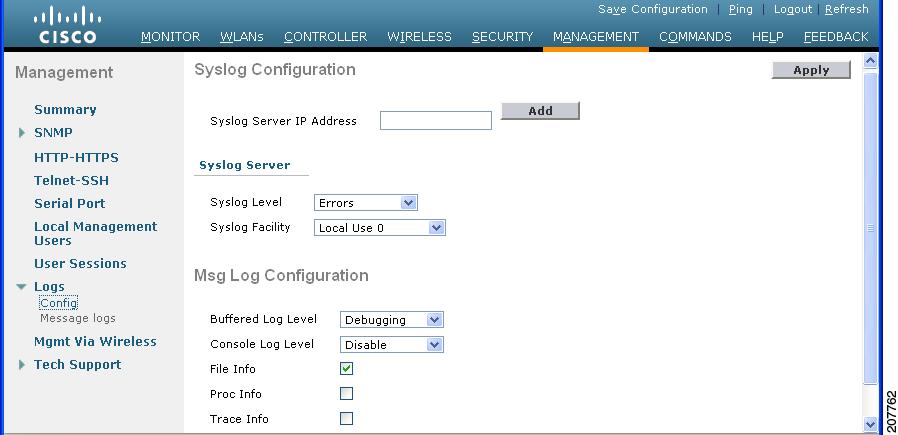
Choose Management > Logs > Config. The Syslog Configuration page appears.

Figure 1. Syslog Configuration Page

Step 2

In the Syslog Server IP Address (IPv4/IPv6) text box, enter the IPv4/IPv6 address of the server to which to send the syslog messages and click Add. You can add up to three syslog servers to the controller. The list of syslog servers that have already been added to the controller appears below this text box.

Note 

If you want to remove a syslog server from the controller, click Remove to the right of the desired server.

Step 3

To set the severity level for filtering syslog messages to the syslog servers, choose one of the following options from the Syslog Level drop-down list:

  • Emergencies = Severity level 0
  • Alerts = Severity level 1 (default value)

  • Critical = Severity level 2

  • Errors = Severity level 3

  • Warnings = Severity level 4

  • Notifications = Severity level 5

  • Informational = Severity level 6

  • Debugging = Severity level 7

If you set a syslog level, only those messages whose severity is equal to or less than that level are sent to the syslog servers. For example, if you set the syslog level to Warnings (severity level 4), only those messages whose severity is between 0 and 4 are sent to the syslog servers.

Note 

If you have enabled logging of debug messages to the logging buffer, some messages from application debug could be listed in message log with severity that is more than the level set. For example, if you execute the debug client mac-addr command, the client event log could be listed in message log even though the message severity level is set to Errors.

Step 4

To set the facility for outgoing syslog messages to the syslog servers, choose one of the following options from the Syslog Facility drop-down list:

  • Kernel = Facility level 0

  • User Process = Facility level 1

  • Mail = Facility level 2

  • System Daemons = Facility level 3

  • Authorization = Facility level 4

  • Syslog = Facility level 5 (default value)

  • Line Printer = Facility level 6

  • USENET = Facility level 7
  • Unix-to-Unix Copy = Facility level 8
  • Cron = Facility level 9
  • FTP Daemon = Facility level 11
  • System Use 1 = Facility level 12
  • System Use 2 = Facility level 13
  • System Use 3 = Facility level 14
  • System Use 4 = Facility level 15
  • Local Use 0 = Facility level 16
  • Local Use 2 = Facility level 17
  • Local Use 3 = Facility level 18
  • Local Use 4 = Facility level 19
  • Local Use 5 = Facility level 20
  • Local Use 5 = Facility level 21
  • Local Use 5 = Facility level 22
  • Local Use 5 = Facility level 23
Step 5

Click Apply.

Step 6

To set the severity level for logging messages to the controller buffer and console, choose one of the following options from both the Buffered Log Level and Console Log Level drop-down lists:

  • Emergencies = Severity level 0
  • Alerts = Severity level 1
  • Critical = Severity level 2
  • Errors = Severity level 3 (default value)
  • Warnings = Severity level 4
  • Notifications = Severity level 5
  • Informational = Severity level 6
  • Debugging = Severity level 7
  • Disable— This option is available only for Console Log level. Select this option to disable console logging.

If you set a logging level, only those messages whose severity is equal to or less than that level are logged by the controller. For example, if you set the logging level to Warnings (severity level 4), only those messages whose severity is between 0 and 4 are logged.

Step 7

Select the File Info check box if you want the message logs to include information about the source file. The default value is enabled.

Step 8

Select the Trace Info check box if you want the message logs to include traceback information. The default is disabled.

Step 9

Click Apply.

Step 10

Click Save Configuration.


Viewing Message Logs (GUI)

To view message logs using the controller GUI, choose Management > Logs > Message Logs. The Message Logs page appears.


Note

To clear the current message logs from the controller, click Clear.


Configuring System and Message Logging (CLI)

Procedure


Step 1

Enable system logging and set the IP address of the syslog server to which to send the syslog messages by entering this command:

config logging syslog host server_IP_address

You can add up to three syslog servers to the controller.

Note 

To remove a syslog server from the controller by entering this command:
config logging syslog host server_IP_address delete

Step 2

Set the severity level for filtering syslog messages to the syslog server by entering this command:

config logging syslog level severity_level

where severity_level is one of the following:

  • emergencies = Severity level 0
  • alerts = Severity level 1
  • critical = Severity level 2
  • errors = Severity level 3
  • warnings = Severity level 4
  • notifications = Severity level 5
  • informational = Severity level 6
  • debugging = Severity level 7
Note 

As an alternative, you can enter a number from 0 through 7 for the severity_level parameter.

Note 

If you set a syslog level, only those messages whose severity is equal to or less than that level are sent to the syslog server. For example, if you set the syslog level to Warnings (severity level 4), only those messages whose severity is between 0 and 4 are sent to the syslog server.

Step 3

Set the severity level for filtering syslog messages for a particular access point or for all access points by entering this command:

config ap logging syslog level severity_level {Cisco_AP | all}

where severity_level is one of the following:

  • emergencies = Severity level 0
  • alerts = Severity level 1
  • critical = Severity level 2
  • errors = Severity level 3
  • warnings = Severity level 4
  • notifications = Severity level 5
  • informational = Severity level 6
  • debugging = Severity level 7
    Note 

    If you set a syslog level, only those messages whose severity is equal to or less than that level are sent to the access point. For example, if you set the syslog level to Warnings (severity level 4), only those messages whose severity is between 0 and 4 are sent to the access point.

Step 4

Set the facility for outgoing syslog messages to the syslog server by entering this command:

config logging syslog facility facility-code

where facility-code is one of the following:

  • ap = AP related traps.

  • authorization = Authorization system. Facility level = 4.

  • auth-private = Authorization system (private). Facility level = 10.
  • cron = Cron/at facility. Facility level = 9.
  • daemon = System daemons. Facility level = 3.
  • ftp = FTP daemon. Facility level = 11.
  • kern = Kernel. Facility level = 0.
  • local0 = Local use. Facility level = 16.
  • local1 = Local use. Facility level = 17.
  • local2 = Local use. Facility level = 18.
  • local3 = Local use. Facility level = 19.
  • local4 = Local use. Facility level = 20.
  • local5 = Local use. Facility level = 21.
  • local6 = Local use. Facility level = 22.
  • local7 = Local use. Facility level = 23.
  • lpr = Line printer system. Facility level = 6.
  • mail = Mail system. Facility level = 2.
  • news = USENET news. Facility level = 7.
  • sys12 = System use. Facility level = 12.
  • sys13 = System use. Facility level = 13.
  • sys14 = System use. Facility level = 14.
  • sys15 = System use. Facility level = 15.
  • syslog = The syslog itself. Facility level = 5.
  • user = User process. Facility level = 1.
  • uucp = Unix-to-Unix copy system. Facility level = 8.
Step 5

Configure the syslog facility for AP using the following command:

config logging syslog facility AP

where AP can be:

  • associate= Associated sys log for AP

  • disassociate=Disassociate sys log for AP

Step 6

Configure the syslog facility for an AP or all APs by entering this command:

config ap logging syslog facility facility-level {Cisco_AP | all}

where facility-level is one of the following:

  • auth = Authorization system
  • cron = Cron/at facility
  • daemon = System daemons
  • kern = Kernel
  • local0 = Local use
  • local1 = Local use
  • local2 = Local use
  • local3 = Local use
  • local4 = Local use
  • local5 = Local use
  • local6 = Local use
  • local7 = Local use
  • lpr = Line printer system
  • mail = Mail system
  • news = USENET news
  • sys10 = System use
  • sys11 = System use
  • sys12 = System use
  • sys13 = System use
  • sys14 = System use
  • sys9 = System use
  • syslog = Syslog itself
  • user = User process
  • uucp = Unix-to-Unix copy system
Step 7

Configure the syslog facility for client by entering this command:

config logging syslog facility client {assocfail | associate | authentication | authfail | deauthenticate | disassociate | excluded} {enable | disable}

where:

  • assocfail : 802.11 association fail syslog for clients.

  • authentication : Authentication success syslog for clients

  • authfail : 802.11 authentication fail syslog for clients

  • deauthenticate : 802.11 deauthentication syslog for clients

  • disassociate : 802.11 disassociation syslog for clients

  • excluded : Excluded syslog for clients

Step 8

Configure transmission of syslog messages over IPSec by entering this command:

config logging syslog ipsec {enable | disable}

Step 9

Configure transmission of syslog messages over transport layer security (TLS) by entering this command:

config logging syslog tls {enable | disable}

Enabling syslog over TLS on the controller enables the feature for all syslog hosts defined in the controller. You can define up to three syslog hosts per controller. The controller transmits messages concurrently to all the configured syslog hosts.

Check if the controller has an active TLS connection to the syslog server by entering the show logging command. The following is a sample output:

- syslog over tls................................ Enabled
  - Host 0....................................... 209.165.200.224
    - TLS auth status............................ connected
    - packets sent............................... 3879
    - packets dropped............................ 2
  - Host 1.......................................
  - Host 2.......................................
Caution 

Issue: Some messages are not transmitted to the syslog server even though it is reachable.

Analysis: This issue occurs because syslog over TLS is enabled in the controller, multiple syslog hosts are defined in the controller, the number of syslog messages generated are high, and one of the syslog hosts is not reachable over TLS.

Step 10

Set the severity level for logging messages to the controller buffer and console by entering these commands:

  • config logging buffered severity_level

  • config logging console severity_level

where severity_level is one of the following:

  • emergencies = Severity level 0

  • alerts = Severity level 1

  • critical = Severity level 2

  • errors = Severity level 3

  • warnings = Severity level 4

  • notifications = Severity level 5

  • informational = Severity level 6

  • debugging = Severity level 7

    Note 

    As an alternative, you can enter a number from 0 through 7 for the severity_level parameter.

Note 

If you set a logging level, only those messages whose severity is equal to or less than that level are logged by the controller. For example, if you set the logging level to Warnings (severity level 4), only those messages whose severity is between 0 and 4 are logged.

Step 11

Save debug messages to the controller buffer, the controller console, or a syslog server by entering these commands:

  • config logging debug buffered {enable | disable}

  • config logging debug console {enable | disable}

  • config logging debug syslog {enable | disable}

    By default, the console command is enabled, and the buffered and syslog commands are disabled.

Step 12

To cause the controller to include information about the source file in the message logs or to prevent the controller from displaying this information by entering this command:

config logging fileinfo {enable | disable}

The default value is enabled.

Step 13

Configure the controller to include process information in the message logs or to prevent the controller from displaying this information by entering this command:

config logging procinfo {enable | disable}

The default value is disabled.

Step 14

Configure the controller to include traceback information in the message logs or to prevent the controller from displaying this information by entering this command:

config logging traceinfo {enable | disable}

The default value is disabled.

Step 15

Enable or disable timestamps in log messages and debug messages by entering these commands:

  • config service timestamps log {datetime | disable}

  • config service timestamps debug {datetime | disable}

    where

    • datetime = Messages are timestamped with the standard date and time. This is the default value.

    • disable = Messages are not timestamped.

Step 16

Save your changes by entering this command:

save config


Viewing System and Message Logs (CLI)

To see the logging parameters and buffer contents, enter this command:

show logging

Viewing Access Point Event Logs

Information About Access Point Event Logs

Access points log all system messages (with a severity level greater than or equal to notifications) to the access point event log. The event log can contain up to 1024 lines of messages, with up to 128 characters per line. When the event log becomes filled, the oldest message is removed to accommodate a new event message. The event log is saved in a file on the access point flash, which ensures that it is saved through a reboot cycle. To minimize the number of writes to the access point flash, the contents of the event log are written to the event log file during normal reload and crash scenarios only.

Viewing Access Point Event Logs (CLI)

Use these CLI commands to view or clear the access point event log from the controller:

  • To see the contents of the event log file for an access point that is joined to the controller, enter this command:

    show ap eventlog Cisco_AP

    Information similar to the following appears:

    
    AP event log download has been initiated
    Waiting for download to complete
    
    AP event log download completed.
     ======================= AP Event log Contents =====================
    *Sep 22 11:44:00.573: %CAPWAP-5-CHANGED: CAPWAP changed state to IMAGE
    *Sep 22 11:44:01.514: %LINEPROTO-5-UPDOWN: Line protocol on Interface Dot11Radio0, changed state to down
    *Sep 22 11:44:01.519: %LINEPROTO-5-UPDOWN: Line protocol on Interface Dot11Radio1, changed state to down
    *Sep 22 11:44:53.539: *** Access point reloading. Reason: NEW IMAGE DOWNLOAD ***
    *Mar 1 00:00:39.078: %CAPWAP-3-ERRORLOG: Did not get log server settings from DHCP.
    *Mar 1 00:00:42.142: %CDP_PD-4-POWER_OK: Full power - NEGOTIATED inline power source
    *Mar 1 00:00:42.151: %LINK-3-UPDOWN: Interface Dot11Radio1, changed state to up
    *Mar 1 00:00:42.158: %LINK-3-UPDOWN: Interface Dot11Radio0, changed state to up
    *Mar 1 00:00:43.143: %LINEPROTO-5-UPDOWN: Line protocol on Interface Dot11Radio1, changed state to up
    *Mar 1 00:00:43.151: %LINEPROTO-5-UPDOWN: Line protocol on Interface Dot11Radio0, changed state to up
    *Mar 1 00:00:48.078: %CAPWAP-3-ERRORLOG: Could Not resolve CISCO-CAPWAP-CONTROLLER
    *Mar 1 00:01:42.144: %CDP_PD-4-POWER_OK: Full power - NEGOTIATED inline power source
    *Mar 1 00:01:48.121: %CAPWAP-3-CLIENTERRORLOG: Set Transport Address: no more AP manager IP addresses remain
    *Mar 1 00:01:48.122: %CAPWAP-5-CHANGED: CAPWAP changed state to JOIN
    *Mar 1 00:01:48.122: %LINK-5-CHANGED: Interface Dot11Radio0, changed state to administratively down
    *Mar 1 00:01:48.122: %LINK-5-CHANGED: Interface Dot11Radio1, changed state to administratively down

    
  • To delete the existing event log and create an empty event log file for a specific access point or for all access points joined to the controller, enter this command:

    clear ap-eventlog {specific Cisco_AP | all}

Using the Debug Facility

The debug facility enables you to display all packets going to and from the controller CPU. You can enable it for received packets, transmitted packets, or both. By default, all packets received by the debug facility are displayed. However, you can define access control lists (ACLs) to filter packets before they are displayed. Packets not passing the ACLs are discarded without being displayed.

Each ACL includes an action (permit, deny, or disable) and one or more fields that can be used to match the packet. The debug facility provides ACLs that operate at the following levels and on the following values:

  • Driver ACL

    • NPU encapsulation type

    • Port

  • Ethernet header ACL

    • Destination address

    • Source address

    • Ethernet type

    • VLAN ID

  • IP header ACL

    • Source address

    • Destination address

    • Protocol

    • Source port (if applicable)

    • Destination port (if applicable)

  • EoIP payload Ethernet header ACL

    • Destination address

    • Source address

    • Ethernet type

    • VLAN ID

  • EoIP payload IP header ACL

    • Source address

    • Destination address

    • Protocol

    • Source port (if applicable)

    • Destination port (if applicable)

  • CAPWAP payload 802.11 header ACL

    • Destination address

    • Source address

    • BSSID

    • SNAP header type

  • CAPWAP payload IP header ACL

    • Source address

    • Destination address

    • Protocol

    • Source port (if applicable)

    • Destination port (if applicable)

At each level, you can define multiple ACLs. The first ACL that matches the packet is the one that is selected.

This section contains the following subsection:

Configuring the Debug Facility (CLI)

Procedure


Step 1

To enable the debug facility, enter this command:

  • debug packet logging enable {rx | tx | all} packet_count display_size

    where

    • rx displays all received packets, tx displays all transmitted packets, and all displays both transmitted and received packets.

    • packet_count is the maximum number of packets to log. You can enter a value between 1 and 65535 packets, and the default value is 25 packets.

    • display_size is the number of bytes to display when printing a packet. By default, the entire packet is displayed.

      Note 

      To disable the debug facility, enter this command: debug packet logging disable .

  • debug packet logging acl driver rule_index action npu_encap port

    where

    • rule_index is a value between 1 and 6 (inclusive).

    • action is permit, deny, or disable.

    • npu_encap specifies the NPU encapsulation type, which determines how packets are filtered. The possible values include dhcp, dot11-mgmt, dot11-probe, dot1x, eoip-ping, iapp, ip, lwapp, multicast, orphan-from-sta, orphan-to-sta, rbcp, wired-guest, or any.

    • port is the physical port for packet transmission or reception.

  • Use these commands to configure packet-logging ACLs:

    debug packet logging acl eth rule_index action dst src type vlan

    where

    • rule_index is a value between 1 and 6 (inclusive).

    • action is permit, deny, or disable.

    • dst is the destination MAC address.

    • src is the source MAC address.

    • type is the two-byte type code (such as 0x800 for IP, 0x806 for ARP). This parameter also accepts a few common string values such as “ip” (for 0x800) or “arp” (for 0x806).

    • vlan is the two-byte VLAN ID.

  • debug packet logging acl ip rule_index action src dst proto src_port dst_port

    where

    • proto is a numeric or any string recognized by getprotobyname(). The controller supports the following strings: ip, icmp, igmp, ggp, ipencap, st, tcp, egp, pup, udp, hmp, xns-idp, rdp, iso-tp4, xtp, ddp, idpr-cmtp, rspf, vmtp, ospf, ipip, and encap.

    • src_port is the UDP/TCP two-byte source port (for example, telnet, 23) or “any.” The controller accepts a numeric or any string recognized by getservbyname(). The controller supports the following strings: tcpmux, echo, discard, systat, daytime, netstat, qotd, msp, chargen, ftp-data, ftp, fsp, ssh, telnet, smtp, time, rlp, nameserver, whois, re-mail-ck, domain, mtp, bootps, bootpc, tftp, gopher, rje, finger, www, link, kerberos, supdup, hostnames, iso-tsap, csnet-ns, 3com-tsmux, rtelnet, pop-2, pop-3, sunrpc, auth, sftp, uucp-path, nntp, ntp, netbios-ns, netbios-dgm, netbios-ssn, imap2, snmp, snmp-trap, cmip-man, cmip-agent, xdmcp, nextstep, bgp, prospero, irc, smux, at-rtmp, at-nbp, at-echo, at-zis, qmtp, z3950, ipx, imap3, ulistserv, https, snpp, saft, npmp-local, npmp-gui, and hmmp-ind.

    • dst_port is the UDP/TCP two-byte destination port (for example, telnet, 23) or “any.” The controller accepts a numeric or any string recognized by getservbyname(). The controller supports the same strings as those for the src_port .

  • debug packet logging acl eoip-eth rule_index action dst src type vlan

  • debug packet logging acl eoip-ip rule_index action src dst proto src_port dst_port

  • debug packet logging acl lwapp-dot11 rule_index action dst src bssid snap_type

    where

    • bssid is the Basic Service Set Identifier.

    • snap_type is the Ethernet type.

  • debug packet logging acl lwapp-ip rule_index action src dst proto src_port dst_port

    Note 

    To remove all configured ACLs, enter this command: debug packet logging acl clear-all .

Step 2

To configure the format of the debug output, enter this command:

debug packet logging format {hex2pcap | text2pcap}

The debug facility supports two output formats: hex2pcap and text2pcap. The standard format used by IOS supports the use of hex2pcap and can be decoded using an HTML front end. The text2pcap option is provided as an alternative so that a sequence of packets can be decoded from the same console log file.
Figure 2. Sample Hex2pcap Output. This figure shows an example of hex2pcap output.

Figure 3. Sample Text2pcap Output. This figure shows an example of text2pcap output.

Step 3

To determine why packets might not be displayed, enter this command:

debug packet error {enable | disable}
Step 4

To display the status of packet debugging, enter this command:

show debug packet

Information similar to the following appears:


Status........................................... disabled
Number of packets to display..................... 25
Bytes/packet to display.......................... 0
Packet display format............................ text2pcap

Driver ACL:
      [1]: disabled
      [2]: disabled
      [3]: disabled
      [4]: disabled
      [5]: disabled
      [6]: disabled
   Ethernet ACL:
      [1]: disabled
      [2]: disabled
      [3]: disabled
      [4]: disabled
      [5]: disabled
      [6]: disabled
   IP ACL:
      [1]: disabled
      [2]: disabled
      [3]: disabled
      [4]: disabled
      [5]: disabled
      [6]: disabled
   EoIP-Ethernet ACL:
      [1]: disabled
      [2]: disabled
      [3]: disabled
      [4]: disabled
      [5]: disabled
      [6]: disabled
   EoIP-IP ACL:
      [1]: disabled
      [2]: disabled
      [3]: disabled
      [4]: disabled
      [5]: disabled
      [6]: disabled
   LWAPP-Dot11 ACL:
      [1]: disabled
      [2]: disabled
      [3]: disabled
      [4]: disabled
      [5]: disabled
      [6]: disabled
   LWAPP-IP ACL:
      [1]: disabled
      [2]: disabled
      [3]: disabled
      [4]: disabled
      [5]: disabled
      [6]: disabled?