Trace Levels
Support personnel who debug the Unified Communication solution need not know the details of trace levels across Unified Communication solution applications. If debugging a problem requires more detailed debug information, three levels of trace setting exist that can map internally to a particular application or application component. The intent is not to revamp existing trace setting values but to map the levels to the relevant and existing trace settings for a particular component. Use the following defined trace levels with the Diagnostic Framework Portico and the Unified System CLI tools.
The following trace levels are defined for the Unified Communication solution:
|
Trace Level |
Trace Value |
Description |
|---|---|---|
|
Default |
0 |
Default install, should have no or minimal performance impact |
|
Warning |
1 |
Log more detailed (plus default level) trace messages, small performance impact |
|
Error |
2 |
Log more detailed (plus warning and default level) trace messages, medium performance impact |
|
Debug |
3 |
Log most detailed (plus error and warning and default level) trace messages, high performance impact. |
 Note |
If you have enabled the debug trace levels, disable them after collecting the logs to avoid an unnecessary performance impact to your solution. |
If the trace level does not match any of the defined levels, it displays custom (99).
Most EMSTraceMasks are based on this registry key: HKLM\SOFTWARE\Cisco Systems, Inc.\ICM\<Instance>\<Component>\EMS\CurrentVersion\Library\Processes\<process>\EMSTraceMask
Get and Set trace level and collect trace files are supported only for the following processes.
Note |
If the trace mask is the same for multiple levels, the GetTraceLevel returns the highest level. For example, GetTraceLevel returns Level 3 for Logger/baimport. |
Trace–All Nodes
You can set trace levels on these processes:
|
Process |
Level 0 (Default - Error) |
Level 1 (Warning) |
Level 2 (Informational) |
Level 3 (Debug) |
|---|---|---|---|---|
|
NM |
0x00 |
0x0F |
0x0F |
0xFF |
|
NMM |
0x00 |
0x0F |
0x0F |
0xFF |
The Diagnostic Framework does not support the Administrator Workstation.
Trace–Administration and Data Server (Previously Known as the Distributor Administrator Workstation)
You can set trace levels on these processes for the Administration and Data Server:
|
Process |
Level 0 (Default - Error) |
Level 1 (Warning) |
Level 2 (Informational) |
Level 3 (Debug) |
|---|---|---|---|---|
|
CONFIGLOGGER |
0x00 |
0x0F |
0xFF |
0xFFF |
|
CMSNODE |
0x00 |
0x00 |
0x00 |
0xFFFFFFFF |
|
CMS_JSERVER |
0x00 |
0x00 |
0x00 |
0xFFFFFFFF |
|
REPLICATION |
0x00 |
0x0F |
0xFF |
0xFFF |
|
RTCLIENT |
0x00 |
0x0F |
0xFF |
0xFFF |
|
RTDIST |
0x00 |
0x0F |
0xFF |
0xFFF |
|
UPDATEAW |
0x00 |
0x0F |
0xFF |
0xFFF |
|
ISEMAN |
0x00 |
0x00 |
0x00 |
0x01 |
Note |
The minimum and default trace level for the CMS, CMSJServer and ISE components is 2. |
Trace–Router
You can set trace levels on these processes for the Router:
|
Process |
Level 0 (Default - Error) |
Level 1 (Warning) |
Level 2 (Informational) |
Level 3 (Debug) |
Notes |
|---|---|---|---|---|---|
|
APPGW |
0x00 |
0x01 |
0x07 |
0x3F |
— |
|
CCAGENT |
0x00 |
0x03 |
0x0F |
0xFF |
— |
|
DBAGENT |
0x00 |
0x01 |
0xFF |
0xFF |
— |
|
DBWORKER |
0x00 |
0x01 |
0xFF |
0xFF |
— |
|
MDSPROC |
0x00 |
0x07 |
0xFF |
0xFF |
— |
|
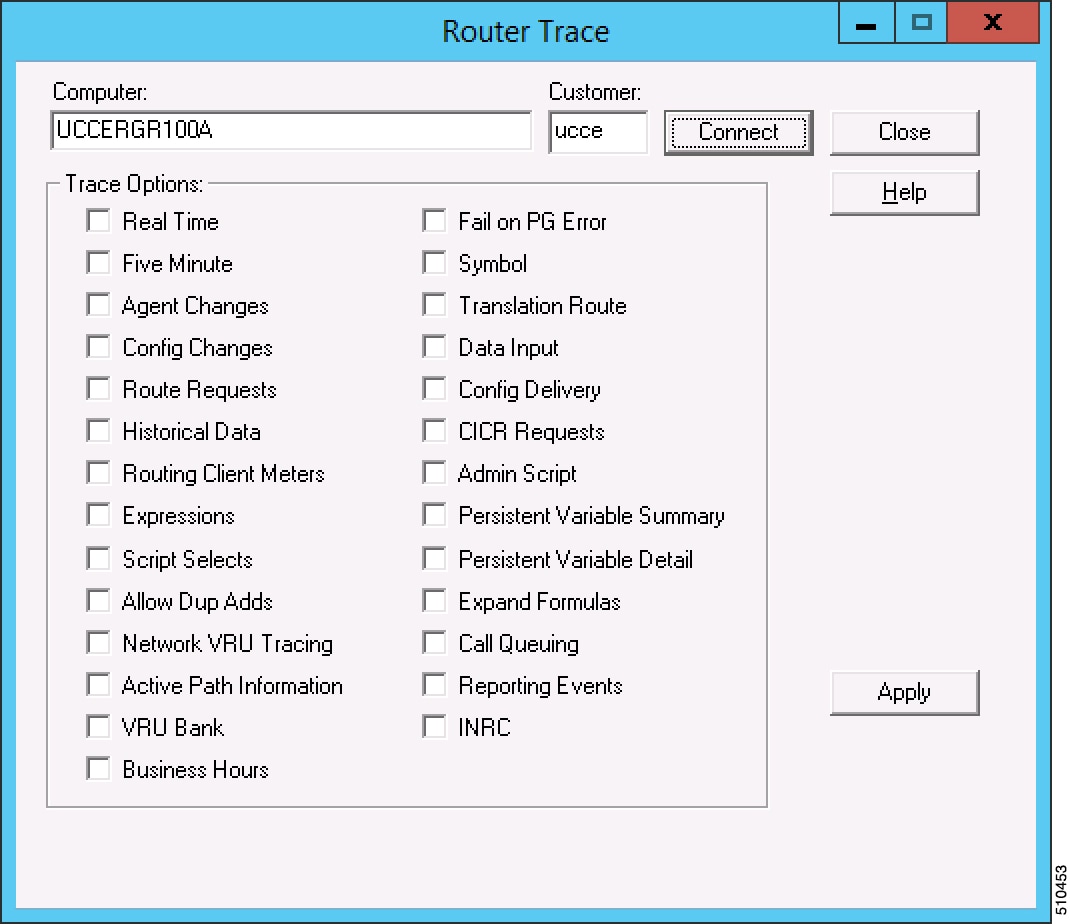
ROUTER * |
Turn off everything |
Route Requests |
- Network VRU - Trans Route - VRU Bank - CIC Request - Script Select |
- Call Queuing - Agent changes - Call Type Real Time |
Use RTRTRACE or RTRTEST Note: If you restart the Router process, the settings return to the default level. |
|
RTSVR |
0x00 |
0x0F |
0xFF |
0xFFF |
— |
Trace–Logger
You can set trace levels on these processes for the Logger:
|
Process |
Level 0 (Default - Error) |
Level 1 (Warning) |
Level 2 (Informational) |
Level 3(Debug) |
|---|---|---|---|---|
|
BAIMPORT |
0xFF EMSUserData = 0xFFFF |
0xFF EMSUserData = 0xFFFF |
0xFF EMSUserData = 0xFFFF |
0xFF EMSUserData = 0xFFFF |
|
CAMPAIGN MANAGER |
0xFF EMSUserData = 0xFFFF |
0xFF EMSUserData = 0xFFFF |
0xFF EMSUserData = 0xFFFF |
0xFF EMSUserData = 0xFFFF |
|
CONFIGLOGGER |
0x00 |
0x0F |
0xFF |
0xFFF |
|
CSFS |
0x00 |
0x00 |
0x00 |
0xFF |
|
CW2KFEED |
0x00 |
0x00 |
0x00 |
0x07 |
|
DTP |
0x00 |
0x04 |
0x06 |
0x0F |
|
HISTLOGGER |
0x00 |
0x0F |
0xFFF |
0xFFF |
|
RECOVERY |
0x00 |
0x0F |
0xFFF |
0xFFF |
|
REPLICATION |
0x00 |
0x0F |
0xFFF |
0xFFF |
Trace–Peripheral Gateway
You can set trace levels on these processes for the PG:
|
Process |
Level 0 (Default - Error) |
Level 1 (Warning) |
Level 2 (Informational) |
Level 3 (Debug) |
|---|---|---|---|---|
|
JTAPIGW * |
JT_JTAPI_EVENT_ USED JT_TPREQUESTS JT_PIM_EVENT JT_ROUTE_ MESSAGE |
JT_CONNECTION *CONF* |
JT_JTAPI* JT_HEX JT_ROUTE* JT_TERM* JT_LOW* |
JT* |
|
MDSPROC |
0x00 |
0x07 |
0x0F |
0xFF |
|
MSGIS |
0x00 |
0x00 |
0x00 |
0x3F |
|
OPC ** |
Default, cstacerEMSTraceMask = 0x40 |
agent, inrcmsg, closedcalls, tpmsg, routing EMSTraceMask = 0x40 Note: Remove "default" tracing set in Default(0) level, but include cstacer. |
Calls, NCT, simplified EMSTraceMask = 0x40Note:Remove "default" tracing set in Default(0) level, but include Level 1. |
Missingdata, halfhour EMSTraceMask = 0x40Note: Remove "default" tracing set in Default(0) level, but include Level 2. |
|
PGAGENT |
0x00 |
0x03 |
0x0F |
0xFF |
|
EAGTPIM * |
tp* precall *event csta* call_object teld_agent_state opcrequest |
periph* jtapi_dialed* |
autoconfig* teld* call_match_timing timer* |
lock* universal* service* threadid jtapi* |
|
VRUPIM |
EMSTraceMask= 0x0 EMSUserData= 0x71f7e0 |
EMSTraceMask= 0x0 EMSUserData= 0x71f7e0 00000000000000000000 00000000000000000000 00000000000000000000 000000000180 |
EMSTraceMask= 0x0 EMSUserData= 0x71f7e0 00000000000000000000 00000000000000000000 00000000000000000000 000000000180 |
EMSTraceMask= 0x0EMSUserData= 0xf1fff0 0000000000000000000 0000000000000000000 0000000000000000000 000000000000180 |
|
ACMIPIM |
EMSUserData = (hex) 01, 7f, 46, 00, 00, 00, 00, 00, 00, 00, 00, 01, 00, 00, 00, 00, 00, 3f, ff, ff, ff, 67, cf, d7, fd, ef, ff, ff, ff, ff, ff, ff, ff, ff, ff, ff, f0, fa For reference, this is the default + all_peripherals |
EMSUserData = (hex) f5, 7f, 46, 00, 00, 00, 00, 00, 00, 00, 00, 01, 00, 00, 00, 00, 00, 3f, ff, ff, ff, 67, cf, d7, fd, ef, ff, ff, ff, ff, ff, ff, ff, ff, ff, ff, f0, fa For reference this is level 0 + timer events |
EMSUserData = (hex) f5, 7f, c6, 00, 00, 00, 00, 00, 00, 00, 00, 01, 00, 00, 00, 00, 00, 3f, ff, ff, ff, 67, cf, d7, fd, ef, ff, ff, ff, ff, ff, ff, ff, ff, ff, ff, f0, fa For reference this is level 1 + Monitor Item traversal |
EMSUserData = (hex) f5, 7f, f6, 00, 00, 00, 00, 01, ff, ff, fe, c1, 00, 00, 00, 00, 00, 3f, ff, ff, ff, 67, cf, df, fd, ef, ff, ff, ff, ff, ff, ff, ff, ff, ff, ff, ff, fe For reference this is level 2 + locks + socket data |
|
MRPIM |
EMSUserData = 0x00 Procmon: > trace mr* /off |
EMSUserData = 0x40 Procmon: > trace mr* /off > trace mr_msg_comm_session /on |
EMSUserData = 0x58 Procmon: > trace mr* /off > trace mr_msg_comm_session /on > trace mr_*_mr /on |
EMSUserData = 0x5F Procmon: > trace mr* /off > trace mr_msg_comm_session /on > trace mr_*_mr /on > trace mr_*_inrc /on > trace mr_*_csta /on |
|
Avaya Aura PIM ( Symposium) |
Default |
Default |
Default |
Tpcsta*, call*, csta* |
|
AAS |
Default |
EMS_TRACE_GENERAL |
EMS_TRACE_CONAPI EMS_TRACE_SEI |
EMS_TRACE_AASDRIVER EMS_TRACE_MSL |
|
Aspect PIM |
Default |
Default |
Default |
Tpcsta*, call*, csta*, app*, pim*, rtb* |
|
Avaya ECSPIM |
Default |
Default |
Default |
Bri*, agent*, call*, csta*, cms*, tp*, 3pdc*, route*, cv* |
|
Avaya TAESPIM |
Default |
Default |
Default |
agent*, call*, csta*, cms*, tp*, monitor*, route*, value*, tsapi* |
|
CTISRVR |
0x000000f0 |
0x000000f6 |
0x000000fe |
0x000000ff |
|
CTIOS SERVER NODE |
0x00060A0F |
0x00240A2F |
0x00260A2F |
0x002E0A2F |
|
BADIALER |
EMSTraceMask= 0x0000003f EMSUserData= 0xFFFF |
EMSTraceMask= 0x0000003f EMSUserData= 0xFFFF |
EMSTraceMask= 0x0000007f EMSUserData= 0xFFFF |
EMSTraceMask= 0x0000007f EMSUserData= 0xFFFF |
Trace–Web Setup
You can set trace levels on the Web Setup process.
|
Process |
Level 0 (Default - Error) |
Level 1 (Warning) |
Level 2 (Informational) |
Level 3 (Debug) |
|---|---|---|---|---|
|
Web Setup |
EMERGENCY |
CRITICAL |
WARNING |
DEBUG |
Websetup uses log4j.net for logging. Websetup uses a XML file (log4j.xml) through which you can set the trace levels. The XML file also contains other information you require for logging.
You can find the log4j.xml file here: <InstallDrive>:\icm\tomcat\webapps\setup\WEB-INF\classes\log4j.xml
Trace–Diagnostic Framework
You can set trace levels on the Diagnostic Framework.
|
Process |
Level 0 (Default - Error) |
Level 1 (Warning) |
Level 2 (Informational) |
Level 3 (Debug) |
Notes |
|---|---|---|---|---|---|
|
Diagnostic Framework |
Info |
Info |
Info |
Debug |
When the Diagnostic Framework receives a request for its own trace level, if the trace level is at Info, Level 2 is returned. When the Diagnostic Framework receives a request to be set for Level 0, Level 1, or Level 2, the trace level is set to Info.
Trace–SADLib
You can set trace levels on SADLib.
|
Process |
Trace Level |
Trace Value |
Description |
|---|---|---|---|
|
SADLib |
0 |
NO |
No logs are generated. |
|
1 |
WARNING |
The Warning and Error logs are generated. |
|
|
2 |
INFO |
The Warning, Error, and Info logs are generated. |
|
|
3 |
DEBUG |
The Warning, Error, Info, and Debug logs are generated. |
 Feedback