- Preface
- Introduction to Cisco EnergyWise Orchestrator
- Managing Administrative Groups
- Security and Permissions in the Orchestrator System
- Managing and Viewing Devices
- Managing Policies
- Waking Computers
- Viewing Reports
- Getting Diagnostic Information from Event Logs
- Sustainability Dashboard
- Troubleshooting
- Important Notice
- About the Sustainability Dashboard
- General Steps for Installing, Configuring, and Deploying the Dashboard
- System Components
- Tasks, Roles, and Required Skills
- Configuring and Deploying the Dashboard
Sustainability Dashboard
•![]() About the Sustainability Dashboard
About the Sustainability Dashboard
•![]() General Steps for Installing, Configuring, and Deploying the Dashboard
General Steps for Installing, Configuring, and Deploying the Dashboard
•![]() Tasks, Roles, and Required Skills
Tasks, Roles, and Required Skills
•![]() Configuring and Deploying the Dashboard
Configuring and Deploying the Dashboard
•![]() Sustainability Dashboard Reports
Sustainability Dashboard Reports
About the Sustainability Dashboard
The Sustainability Dashboard, an integrated component of Orchestrator, is an interactive reporting tool that shows how much energy and carbon emissions is saved as a result of enforcing PC power management policies.
The dashboard can be customized around your Green-IT strategy, only reporting specific energy or green metrics that matter.
Figure 9-1 Sustainability Dashboard

The dashboard displays charts and summary reports based on data collected in the Orchestrator database. Users seeing the dashboard can change chart views by selecting different filters for date ranges or grouping structures.
Sustainability Dashboard key features:
•![]() Interactive flash and browser-based interface for accessing energy reports so that customers can easily see how much money and energy Orchestrator saves.
Interactive flash and browser-based interface for accessing energy reports so that customers can easily see how much money and energy Orchestrator saves.
•![]() Customizable chart objects to fit specific customer needs, with full control over the layout, chart presentation, and content displayed by the Dashboard.
Customizable chart objects to fit specific customer needs, with full control over the layout, chart presentation, and content displayed by the Dashboard.
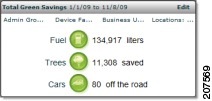
•![]() Green Savings presents the positive environmental impact of savings by reporting in carbon equivalent units, such as CO2, fuel, or cars off the road.
Green Savings presents the positive environmental impact of savings by reporting in carbon equivalent units, such as CO2, fuel, or cars off the road.
•![]() Embeddable chart objects for sharing the positive impact of Green IT initiatives with key stakeholders and colleagues.
Embeddable chart objects for sharing the positive impact of Green IT initiatives with key stakeholders and colleagues.
•![]() Energy-savings reports based on geographical location, business unit, or both.
Energy-savings reports based on geographical location, business unit, or both.
•![]() Increased data accuracy from entering specific regional energy rates and per-PC wattage information.
Increased data accuracy from entering specific regional energy rates and per-PC wattage information.
•![]() The data displayed in the Sustainability Dashboard is aggregated, summarized data. You run a summarization process to make data available to the dashboard. For details, see the "Data Summarization Process Overview" section on page 7-1.
The data displayed in the Sustainability Dashboard is aggregated, summarized data. You run a summarization process to make data available to the dashboard. For details, see the "Data Summarization Process Overview" section on page 7-1.
General Steps for Installing, Configuring, and Deploying the Dashboard
Step 1 ![]() Run the Sustainability Dashboard setup program (OrchestratorDashboardSetup.exe) on a computer with IIS 6.0 or later.
Run the Sustainability Dashboard setup program (OrchestratorDashboardSetup.exe) on a computer with IIS 6.0 or later.
For details, see "Installing the Sustainability Dashboard" in the Cisco EnergyWise Orchestrator Installation Guide.
Step 2 ![]() Set account permissions in the SQL Server to allow IIS communication with the Server.
Set account permissions in the SQL Server to allow IIS communication with the Server.
You need to create a new login and a new user for the IIS user account in the SQL Server and give the account permission to access Orchestrator database.
The IIS computer and SQL Server computer must be in the same domain. To support delegation (for remote IIS access), the server must run as a domain administrator, local system, or network service account (not as a local account). The network service account must have read and write access to the Orchestrator database.
See the "Configuring and Deploying the Dashboard" section for details.
Step 3 ![]() (Optional) Determine the metadata that you want to import for grouping, configuring the database tables, and importing the data. By default, the dashboard groups data by Orchestrator administrative groups. Contact Cisco technical support for information on implementing metadata with the dashboard.
(Optional) Determine the metadata that you want to import for grouping, configuring the database tables, and importing the data. By default, the dashboard groups data by Orchestrator administrative groups. Contact Cisco technical support for information on implementing metadata with the dashboard.
See the "Metadata and Summary Tables Used by the Dashboard" section for details.
Step 4 ![]() Open the dashboard in your local browser, and click the Global Settings tab to set the values for the settings used to calculate report data for the dashboard.
Open the dashboard in your local browser, and click the Global Settings tab to set the values for the settings used to calculate report data for the dashboard.
The global settings determine the default values for the data summarization process and energy calculations. We recommend that you set these values before you run the summarization process for the first time to get the most accurate and uniform report results over time.
See the "Viewing the Sustainability Dashboard" section for details.
Step 5 ![]() Run the summarization process (summarization.exe) to create the aggregated data that the dashboard uses for reports.
Run the summarization process (summarization.exe) to create the aggregated data that the dashboard uses for reports.
Step 6 ![]() Open the IIS web site dashboard in your web browser, and verify that the data is appearing in the dashboard.
Open the IIS web site dashboard in your web browser, and verify that the data is appearing in the dashboard.
See the "Viewing the Sustainability Dashboard" section for details.
Step 7 ![]() Determine the security and location for dashboard access on your intranet.
Determine the security and location for dashboard access on your intranet.
•![]() Copy the DashboardApp.swf file that displays the dashboard to the appropriate computer (if necessary).
Copy the DashboardApp.swf file that displays the dashboard to the appropriate computer (if necessary).
•![]() Determine the method that you want to use to pass tokens between the SWF file and the dashboard API.
Determine the method that you want to use to pass tokens between the SWF file and the dashboard API.
•![]() Create or modify a wrapper page for the dashboard with the appropriate server-side and client-side code to communicate with the dashboard API.
Create or modify a wrapper page for the dashboard with the appropriate server-side and client-side code to communicate with the dashboard API.
Step 8 ![]() Deploy DashboardApp.swf in a page on your intranet, and share the URL with users.
Deploy DashboardApp.swf in a page on your intranet, and share the URL with users.
See the "Deploying the DashboardApp.swf File" section and the "Code Sample" section for details.
System Components
The Sustainability Dashboard installation program installs these components:
•![]() All files required for displaying the Sustainability Dashboard, including the dashboard SWF file.
All files required for displaying the Sustainability Dashboard, including the dashboard SWF file.
•![]() The dashboard API (ASP.NET, hosted in IIS). Any client in your organization that needs access to the dashboard must be able to access the API Server on the IIS computer.
The dashboard API (ASP.NET, hosted in IIS). Any client in your organization that needs access to the dashboard must be able to access the API Server on the IIS computer.
The following Orchestrator and Sustainability Dashboard components are required to deploy the dashboard on an intranet:
Tasks, Roles, and Required Skills
Depending on your organization size and structure, different roles can be required for the installation, configuration, and deployment of the dashboard.
Configuring and Deploying the Dashboard
•![]() Viewing the Sustainability Dashboard
Viewing the Sustainability Dashboard
•![]() Global Settings for Dashboard Reports
Global Settings for Dashboard Reports
•![]() Metadata and Summary Tables Used by the Dashboard
Metadata and Summary Tables Used by the Dashboard
•![]() Deploying the DashboardApp.swf File
Deploying the DashboardApp.swf File
Considerations
•![]() Setting global values to use during the summarization process and also when displaying the dashboard.
Setting global values to use during the summarization process and also when displaying the dashboard.
•![]() Optionally, adding organization metadata to the Orchestrator database to include in the summarization process.
Optionally, adding organization metadata to the Orchestrator database to include in the summarization process.
•![]() Creating a web page for the dashboard and deploying the dashboard on your intranet.
Creating a web page for the dashboard and deploying the dashboard on your intranet.
•![]() Original and updated weighted average baseline energy use. The CPU and Display baselines that you use for the dashboard global settings determine how energy and cost savings are calculated.
Original and updated weighted average baseline energy use. The CPU and Display baselines that you use for the dashboard global settings determine how energy and cost savings are calculated.

Note ![]() For details, see the "Establishing the Baseline Level of Energy Usage" and "Generating the Baseline Numbers for Future Energy-Savings Reports" chapters in the Cisco EnergyWise Orchestrator Installation Guide. Contact Cisco EnergyWise Orchestrator Technical Support if you need assistance with determining your baseline energy use values.
For details, see the "Establishing the Baseline Level of Energy Usage" and "Generating the Baseline Numbers for Future Energy-Savings Reports" chapters in the Cisco EnergyWise Orchestrator Installation Guide. Contact Cisco EnergyWise Orchestrator Technical Support if you need assistance with determining your baseline energy use values.
•![]() Orchestrator server and database setup diagram and descriptions (computers, network topology).
Orchestrator server and database setup diagram and descriptions (computers, network topology).
•![]() Intranet network topology (particularly relating to Orchestrator).
Intranet network topology (particularly relating to Orchestrator).
•![]() Intranet presentation technology that your organization uses (such as SharePoint, static HTML, PHP, ASP.NET).
Intranet presentation technology that your organization uses (such as SharePoint, static HTML, PHP, ASP.NET).
•![]() Intranet authentication/identity management technology (such as public/none, custom, Windows).
Intranet authentication/identity management technology (such as public/none, custom, Windows).
•![]() Implementation plan for the dashboard on your intranet (such as home page, portal, existing reporting page, or dashboard).
Implementation plan for the dashboard on your intranet (such as home page, portal, existing reporting page, or dashboard).
Viewing the Sustainability Dashboard
When you first open the Sustainability Dashboard, you see a preview based on the settings on the Dashboard Preview tab.
Tabs available to administrators:
•![]() Dashboard Preview displays the dashboard based on current Global Settings and the dashboard XML configuration file that is selected.
Dashboard Preview displays the dashboard based on current Global Settings and the dashboard XML configuration file that is selected.
The Dashboard Preview includes options for selecting the configuration file that is displayed for the dashboard and for selecting the parts of the interface to be shown or hidden in the dashboard preview.

When you select options to hide various parts of the console interface, you can share the URL for the dashboard so that others can see these selected parameters. For example:
http://sustain.yourCompany.local/dashboard-preview.aspx?config_id=Default&
hide_panel=on&hide_tabs=on&hide_header_title=on
Two default configurations are provided: Default and Two Time Period.
–![]() For details on the Default configuration, see the "Charts in the Default Configuration" section.
For details on the Default configuration, see the "Charts in the Default Configuration" section.
–![]() For details on the Two Time Period configuration, see the "Two Time Period Configuration" section.
For details on the Two Time Period configuration, see the "Two Time Period Configuration" section.
•![]() Dashboard Configuration provides options for creating, editing, deleting, and previewing the result of XML configuration files. For details on using the configuration editor and customizing the dashboard, contact Cisco Orchestrator Technical Support.
Dashboard Configuration provides options for creating, editing, deleting, and previewing the result of XML configuration files. For details on using the configuration editor and customizing the dashboard, contact Cisco Orchestrator Technical Support.
•![]() Filter Builder provides a way to generate XML code to specify administrative groups, business units, locations, device families, and date ranges set for a custom dashboard filter. For details on using the Filter Builder, contact Cisco EnergyWise Orchestrator Technical Support.
Filter Builder provides a way to generate XML code to specify administrative groups, business units, locations, device families, and date ranges set for a custom dashboard filter. For details on using the Filter Builder, contact Cisco EnergyWise Orchestrator Technical Support.
•![]() Global Settings determine the default values for data summarization, baseline calculations, and energy calculations. For more details, see the "Global Setting Options" section.
Global Settings determine the default values for data summarization, baseline calculations, and energy calculations. For more details, see the "Global Setting Options" section.
•![]() Baseline Report provides tools for generating Data Availability and Baseline reports.
Baseline Report provides tools for generating Data Availability and Baseline reports.
The Data Availability report shows the number of clients reporting to the server each day during the specified period of time.
For more details, see the "Gathering Data for and Creating Initial Power Management Policies" chapter in the Cisco EnergyWise Orchestrator Installation Guide and the "Data Availability Report" section.
The Baseline report generates the baseline number for the average rate of energy use for the PC CPU and display during the specified 2-week period. Baseline numbers are used in future system-health and energy-savings reports.
For details, see the "Gathering Data for and Creating Initial Power Management Policies" chapter in the Cisco EnergyWise Orchestrator Installation Guide and "Baseline Report" section.
Open the Sustainability Dashboard
In your web browser, enter the URL for the web site on the computer where you installed the dashboard, such as http://hostname/website/API/default.aspx:
hostname = computer hosting the dashboard.
website = name of the web site specified during installation.
For example:
http://localhost/dashboard/api or http://myPCname.myDomain.local/dashboard/api
If the dashboard does not appear, follow the steps in the "Troubleshooting" section.
If Windows Firewall is enabled on the Orchestrator server, make sure that TCP port 80 is added to the exceptions list. For details, see the "Configuring Windows Firewall To Allow Server Access to Web Components" section on page 3-6.
Preview the Dashboard Configuration
Step 1 ![]() In your web browser, enter the URL for the web site on the computer where you installed the dashboard, such as http://localhost/dashboard/api.
In your web browser, enter the URL for the web site on the computer where you installed the dashboard, such as http://localhost/dashboard/api.
If the dashboard does not appear, follow the steps in the "Troubleshooting" section.
Step 2 ![]() Click the Dashboard Preview tab in the Sustainability Dashboard.
Click the Dashboard Preview tab in the Sustainability Dashboard.
Note ![]() Use the links in the dashboard interface to go to chart views, settings, and the main dashboard. Browser application buttons do not function within the dashboard application.
Use the links in the dashboard interface to go to chart views, settings, and the main dashboard. Browser application buttons do not function within the dashboard application.
Change the Configuration Settings for Report Data
The default values defined in the Global Settings tab of the Sustainability Dashboard determine the default values for the data summarization process and the energy calculations. We recommend that you set these values before you run the summarization process for the first time so that you get the most accurate and uniform report results over time.
For details, see the "Global Setting Options" section.
For details on customizing the dashboard charts and layout, contact Cisco EnergyWise Orchestrator Technical Support.
Step 1 ![]() In your web browser, enter the URL for the web site on the computer where you installed the dashboard, such as http://localhost/dashboard/api.
In your web browser, enter the URL for the web site on the computer where you installed the dashboard, such as http://localhost/dashboard/api.
If the Administrator Console does not appear, follow the steps in the "Troubleshooting" section.
Step 2 ![]() Click the Global Settings tab in the Sustainability Dashboard.
Click the Global Settings tab in the Sustainability Dashboard.
Troubleshooting
Sustainability Dashboard: ASP.NET is Not Registered in IIS
If the Sustainability Dashboard does not open, make sure that the correct version of ASP.NET on the computer is properly registered with IIS.
This issue can occur when
•![]() IIS was installed after the NET framework on the computer and multiple versions of ASP.NET are on the computer. Aspnet_regiis.exe must be run to create the correct IIS script mapping for the Sustainability Dashboard application.
IIS was installed after the NET framework on the computer and multiple versions of ASP.NET are on the computer. Aspnet_regiis.exe must be run to create the correct IIS script mapping for the Sustainability Dashboard application.
•![]() The 32-bit version of the .NET framework was installed on a computer running a 64-bit operating system.
The 32-bit version of the .NET framework was installed on a computer running a 64-bit operating system.
You can run the ASP NET IIS Registration Tool (Aspnet_regiis.exe) to
•![]() Display the status of all installed versions of ASP NET.
Display the status of all installed versions of ASP NET.
•![]() Register the ASP.NET version that is coupled with an application.
Register the ASP.NET version that is coupled with an application.
•![]() Create client-script directories and perform other configuration operations.
Create client-script directories and perform other configuration operations.
This tool is available on MSDN at ASP.NET IIS Registration.
This command line installs the ASP.NET version that is associated with the ASP.NET IIS Registration tool and updates the script maps of all ASP.NET applications. Note that only the applications that are currently mapped to an earlier version of ASP.NET are affected. Be sure to run this command line from the correct location:
<.NET installDir>\aspnet_regiis.exe -i
For example:
C:\WINDOWS\Microsoft.NET\Framework\v2.0.50727>aspnet_regiis.exe -i
Sustainability Dashboard: Virtual Directory Not Configured as an Application
If you are running IIS 7.0 and ASP.NET is enabled, but the Sustainability Dashboard does not open, you might need to configure the virtual directory for the dashboard web site as an application in IIS.
Step 1 ![]() In IIS Manager under Web Sites or Sites (depending on your version of IIS), expand the Dashboard web site, right-click the API directory, and click Convert to Application.
In IIS Manager under Web Sites or Sites (depending on your version of IIS), expand the Dashboard web site, right-click the API directory, and click Convert to Application.
Step 2 ![]() Click the Dashboard web site icon, and under Actions, click Enable.
Click the Dashboard web site icon, and under Actions, click Enable.
Administrator Console: Correct Version of ASP.NET Not Enabled in IIS
If the Sustainability Dashboard does not open when you try to see it and multiple versions of ASP.NET are installed on your computer where you installed the dashboard API, you might need to select the correct version of ASP.NET in IIS manager.
To see the Administrator Console from the IIS web site, ASP.NET version 2.0.50727 must be enabled in IIS.
Step 1 ![]() In IIS Manager under Web Sites or Sites (depending on your version of IIS), right-click the Dashboard web site, and then click Properties.
In IIS Manager under Web Sites or Sites (depending on your version of IIS), right-click the Dashboard web site, and then click Properties.
Step 2 ![]() In the Default Web Site Properties dialog box, click the ASP.NET tab, and for the ASP.NET version, select 2.0.50727.
In the Default Web Site Properties dialog box, click the ASP.NET tab, and for the ASP.NET version, select 2.0.50727.
Step 3 ![]() Click OK.
Click OK.
Global Settings for Dashboard Reports
The default values in the Global Settings tab of the Sustainability Dashboard determine the default values for the data summarization process and energy calculations.
For accurate and uniform report results over time, set these values before you run the summarization process in Orchestrator for the first time.
If you change a setting, the updated values do not appear in your dashboard reports until you run the summarization process again.
Because data is summarized on an incremental basis after the first time you run the process, only data that is collected and reported on from the time of the change reflects the new values. Historical data is still based on the old values. To reset summarization data and then resummarize the data based on the new settings, see Reset summarization data.
Changes to Global Settings values affect summarized data:
•![]() Energy cost per kWh and currency
Energy cost per kWh and currency
•![]() CO2 kilogram emissions per kWh
CO2 kilogram emissions per kWh
•![]() CO2 kilogram equivalent of one car saved
CO2 kilogram equivalent of one car saved
•![]() CO2 kilogram equivalent of one tree saved
CO2 kilogram equivalent of one tree saved
•![]() CO2 kilogram equivalent of 1 liter of gas saved
CO2 kilogram equivalent of 1 liter of gas saved
•![]() Watt consumption values: CPU On, CPU Off, CPU Suspend, CPU Hibernate, Display On, Display Suspend, Display Off
Watt consumption values: CPU On, CPU Off, CPU Suspend, CPU Hibernate, Display On, Display Suspend, Display Off
Note ![]() Accurate data reporting depends on accurate baseline energy use values. Accuracy also depends on when the summarization process was last run and the number of clients reporting to Orchestrator at that time.
Accurate data reporting depends on accurate baseline energy use values. Accuracy also depends on when the summarization process was last run and the number of clients reporting to Orchestrator at that time.
Global Setting Options
|
|
|
|---|---|
Baseline Energy |
A baseline value represents the base energy usage of PCs and monitors before using Orchestrator power management policies. The baseline value is the most important default global setting, as it is used in calculations to determine energy and cost savings. Enter the energy usage value from the baseline data collection phase. If you do not have separate values for CPU and Display, enter the sum of the CPU and Display values in the CPU field, and enter 0 in the Display field.
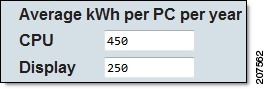
Use only the actual baseline number. Setting this number to another value that is not based on real data results in inaccurate report information. Note |
Energy Costs |
Specify the cost per kWh based on the utilities used. These values determine the cost of energy consumed and the amount of money saved. The cost/kWh should be the weighted value averaged across all utilities.
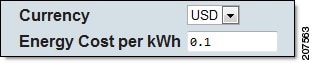
If you do not change this value on the global settings page before running the summarization process for the first time, the summarization uses an energy rate default value of 0.1 kWh/USD. |
CO2 Emissions |
Enter the appropriate conversion factor values to show the environmental impact of power management. The default display units are provided. Authoritative carbon equivalent values are available from the Environmental Protection (Calculations).
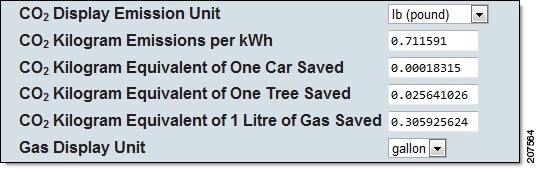
Links to reference information and calculators: • |
CPU and Monitor Watt Consumption |
These default values can be used for CPUs and monitors that do not have device-specific wattage assignments.
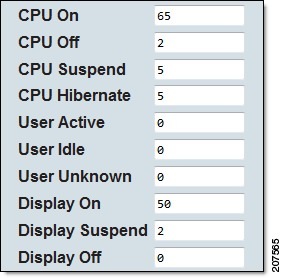
The default values are weighted averages for different CPU and monitor states. The values are based on client data collected over time and represent a typical, modern (4 years old or less) PC used for business. If you have device-specific wattage assignments based on specific watt measurements of different devices (using a watt meter such as the WattsUp Pro, Brultech EML-2020, or Kill-A-Watt meter), you can enter those values. |
Default Data Values
Default values used for Global Settings in the Sustainability Dashboard:
How Dashboard Data is Calculated
Links to www.epa.gov
•![]() Green Power Partnership Tools and Calculators
Green Power Partnership Tools and Calculators
•![]() Clean Energy Calculations and References
Clean Energy Calculations and References
•![]() Greenhouse Gas Equivalencies Calculator
Greenhouse Gas Equivalencies Calculator
Passenger Vehicles Per Year
To determine annual greenhouse gas (GHG) emissions per passenger vehicle:
•![]() Vehicle miles traveled (VMT) is divided by average gas mileage to determine gallons of gasoline consumed per vehicle per year.
Vehicle miles traveled (VMT) is divided by average gas mileage to determine gallons of gasoline consumed per vehicle per year.
•![]() Gallons of gasoline consumed is multiplied by carbon dioxide per gallon of gasoline to determine carbon dioxide emitted per vehicle per year.
Gallons of gasoline consumed is multiplied by carbon dioxide per gallon of gasoline to determine carbon dioxide emitted per vehicle per year.
•![]() Carbon dioxide emissions are divided by the ratio of carbon dioxide emissions to total vehicle greenhouse gas emissions to account for vehicle methane and nitrous oxide emissions.
Carbon dioxide emissions are divided by the ratio of carbon dioxide emissions to total vehicle greenhouse gas emissions to account for vehicle methane and nitrous oxide emissions.
For more information, visit the EPA website: http://www.epa.gov/cleanenergy/energy-resources/refs.html
Sample Calculation
Note ![]() Due to rounding, the calculations return approximate values.
Due to rounding, the calculations return approximate values.
8.81(10-3 metric tons CO2/gallon gasoline)
* 11,856 VMT car/truck average
* 1/19.7 miles per gallon car/truck average
* 1 CO2, CH4, and N2O / 0.971 CO2
= 5.46 metric tons CO2E /vehicle/year
Gallons of Gasoline Consumed
Average heat content of conventional motor gasoline is 5.22 million btu per barrel (EPA 2007).
Average carbon coefficient of motor gasoline is 19.33 kg carbon per million btu (EPA 2007).
Fraction oxidized to CO2 is 100 percent (IPCC 2006).
Carbon dioxide emissions per barrel of gasoline are determined by multiplying heat content times the carbon coefficient times the fraction oxidized times the ratio of the molecular weight ratio of carbon dioxide to carbon (44/12). A barrel equals 42 gallons.
Sample Calculation
Note ![]() Due to rounding, the calculations return approximate values.
Due to rounding, the calculations return approximate values.
22 mmbtu/barrel
* 19.33 kg C/mmbtu
* 1 barrel/42 gallons
* 44 g CO2/12 g C
* 1 metric ton/1000 kg
= 8.81*10-3 metric tons CO2/gallon
Number of Tree Seedlings Grown For 10 Years
A medium growth coniferous tree, planted in an urban setting and allowed to grow for 10 years, sequesters 23.2 lbs of carbon.
Sample Calculation
Note ![]() Due to rounding, the calculations return approximate values.
Due to rounding, the calculations return approximate values.
2 lbs C/tree
* (44 units CO2 / 12 units C)
* 1 metric ton / 2204.6 lbs
= 0.039 metric ton CO2 per urban tree planted
Metadata and Summary Tables Used by the Dashboard
By default, the Sustainability Dashboard reports energy savings and consumption based on administrative groups created in Orchestrator.
The dashboard can show this information based on other dimensions, such as business unit (organizational structure, department) and location (geography,location-specific utility rate).
To use these optional reporting views, you need to import this information (metadata), preferably before running the summarization process for the first time. The approach you take for importing metadata into Sustainability Dashboard summary tables depends on how your desktop infrastructure is organized.
•![]() Number of business units and physical locations
Number of business units and physical locations
•![]() Number and name of utilities that provide electricity
Number and name of utilities that provide electricity
•![]() Descriptions of standard hardware profiles (from CECA or implementation process)
Descriptions of standard hardware profiles (from CECA or implementation process)
•![]() Description of any available metadata sources (IP addresses, Active Directory structures, LDAP directory trees, other management system, spreadsheets)
Description of any available metadata sources (IP addresses, Active Directory structures, LDAP directory trees, other management system, spreadsheets)
Note ![]() For assistance setting up and importing metadata in the database, contact Cisco EnergyWise Orchestrator Technical Support.
For assistance setting up and importing metadata in the database, contact Cisco EnergyWise Orchestrator Technical Support.
Database Tables Used by the Sustainability Dashboard
The tables used by the dashboard are in the Orchestrator database. Some of the tables are used internally. You can populate other tables to customize your dashboard configuration.
The summary tables used by the Sustainability Dashboard correlate data between administrative groups, business units, and locations.
Note ![]() For assistance setting up and importing metadata in the Orchestrator database, contact Cisco EnergyWise Orchestrator Technical Support.
For assistance setting up and importing metadata in the Orchestrator database, contact Cisco EnergyWise Orchestrator Technical Support.
Collection Tables
The Sustainability Dashboard uses the Collection table to identify grouping structures for report data from clients. The Collection table is a way to structure data to fit your needs.
A collection has an ID, a name, and a type (such as business unit or location).
Strategies for Determining Your Collections
In determining the collections you might need and the metadata you will need to import:
•![]() Top-down—The existing organizational structures do you use and the data collection process for those structures
Top-down—The existing organizational structures do you use and the data collection process for those structures
•![]() Bottom-up—The available data that can be leveraged for reports
Bottom-up—The available data that can be leveraged for reports
Large organizations can use the IP address, LDAP, or computer name to assign clients to a business unit or a location.
•![]() IP address— IP addresses often have some relationship to a physical location. If you create a collection based on IP address, you need to determine how the IP addresses map to a physical location (such as building numbers or cubical numbers). Use the system that you have in place to map IP address to location.
IP address— IP addresses often have some relationship to a physical location. If you create a collection based on IP address, you need to determine how the IP addresses map to a physical location (such as building numbers or cubical numbers). Use the system that you have in place to map IP address to location.
•![]() LDAP directory tree—The LDAP often reflects various geographic or organizational boundaries or an internal IT structure.
LDAP directory tree—The LDAP often reflects various geographic or organizational boundaries or an internal IT structure.
•![]() Computer—If your organization keeps track of each computer and who it belongs to, you can use this to determine the grouping for different sets of clients.
Computer—If your organization keeps track of each computer and who it belongs to, you can use this to determine the grouping for different sets of clients.
Deploying the DashboardApp.swf File
There are several different options for how you deploy the dashboard, depending on how accessible or public you want the dashboard to be.
•![]() Intranet URL with IP address
Intranet URL with IP address
•![]() Intranet with permissions
Intranet with permissions
•![]() Embedded in a SharePoint site as a web part - use a web part for embedding Flash or use JavaScript in SharePoint Designer Source view (not Design View).
Embedded in a SharePoint site as a web part - use a web part for embedding Flash or use JavaScript in SharePoint Designer Source view (not Design View).
If you need ID management for dashboard access, use the same system that you use for your intranet to make the dashboard secure and to authorize users to access the dashboard.
Note ![]() For assistance with deploying the dashboard on your intranet, please contact Cisco EnergyWise Orchestrator Technical Support.
For assistance with deploying the dashboard on your intranet, please contact Cisco EnergyWise Orchestrator Technical Support.
API Tokens and Security
The dashboard uses a token-based security model. If you are deploying the dashboard in your intranet, you need to copy the DashboardApp.swf file from the IIS computer to the computer that hosts your intranet and create a wrapper page for the SWF file. You also need to provide code to use the API tokens for authentication.
Figure 9-2 Service-Level Sequence Diagram
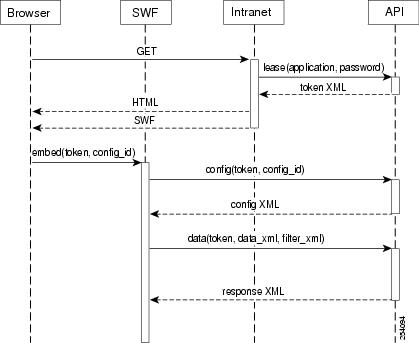
When the dashboard is installed, there are no default security restrictions. The SWF file must reference the computer that hosts the API.
Note ![]() All client computers needing to display the dashboard must have network connectivity to the computer hosting the API.
All client computers needing to display the dashboard must have network connectivity to the computer hosting the API.
When the dashboard loads on a client computer, it makes an API call using the Lease method to get the named XML configuration. The Lease method generates security tokens. If you are displaying the dashboard on your intranet, your intranet needs to acquire and pass the tokens to the dashboard on each client.
The DashboardApp.swf file needs this information:
•![]() The location of the API (computer name or domain name)
The location of the API (computer name or domain name)
•![]() Code that dynamically generates the token or a static Lease method call.
Code that dynamically generates the token or a static Lease method call.
•![]() The specific name of the XML configuration file that serves as the template for the dashboard, for example, config-id: "Default".
The specific name of the XML configuration file that serves as the template for the dashboard, for example, config-id: "Default".
The SWF file references swfobject (http://code.google.com/p/swfobject and also needs to reference the computer that hosts the API.
A web developer needs to edit a PHP, HTML, SharePoint, or ASP.NET page to dynamically generate a token using the Lease method or to manually generate the token and paste it in the code.
Note ![]() For assistance with deploying the dashboard on your intranet, contact Cisco EnergyWise Orchestrator Technical Support.
For assistance with deploying the dashboard on your intranet, contact Cisco EnergyWise Orchestrator Technical Support.
By default, tokens expire after 1 hour. If you use static HTML to display the dashboard, you need to change the expiration time to never expire. You can change the expiration time in the timeout_mri element in the Application table in the Orchestrator database.
A token that you paste into a static HTML page never expires after you set this property in Orchestrator database. Therefore, this practice is less secure.
Code Sample
This topic is a simple example of ASP.NET code that could be used in a wrapper page that facilitates server-side and client-side communication between the SWF file and the API.
Note ![]() For assistance with deploying the dashboard on your intranet, please contact Cisco EnergyWise Orchestrator Technical Support.
For assistance with deploying the dashboard on your intranet, please contact Cisco EnergyWise Orchestrator Technical Support.
ASP.NET example code that could be used in a wrapper page that facilitates server-side and client-side communication between the SWF file and the API.
This example code dynamically requests a token through Sustainability Dashboard web service:
<%@ Page Language="C#" %>
<%
string application = "dashboard";
// must match a row in the Application table of your Orchestrator database
string password = "green";
string config_id = Request["config_id"];
if (String.IsNullOrEmpty(config_id)) config_id = "default";
string api_prefix = "http://sustain.mycompany.local/api.asmx/";
string token;
System.Net.WebRequest request = System.Net.WebRequest.Create(api_prefix +
"lease" + "?" + "application=" + HttpUtility.UrlEncode(application) + "&" + "password=" +
HttpUtility.UrlEncode(password));
System.Net.WebResponse response = request.GetResponse();
// TODO: check for and handle error
System.Xml.XmlReader xmlReader =
System.Xml.XmlReader.Create(response.GetResponseStream());
xmlReader.ReadStartElement();
token = xmlReader.ReadContentAsString();
response.Close();
%>
This example code creates an HTML layout in which the dashboard appears on the page:
<!DOCTYPE HTML PUBLIC "-//W3C//DTD HTML 4.01//EN"
"http://www.w3.org/TR/html4/strict.dtd">
<html>
<head>
<title>Green Portal</title>
<script type="text/javascript"
src="http://ajax.googleapis.com/ajax/libs/swfobject/2/swfobject.js">
</script>
<script type="text/javascript" src="resizeswf.js"></script>
<style type="text/css">
html, body, #resizeContainer, #dashboard { height: 100%; overflow-y: hidden; }
</style>
</head>
<body>
<img style="float: right;" src="http://www.mycompany.com/greenportal/logo.gif">
<h2>Green Portal</h2>
<div id="resizeContainer">
<div id="dashboard">
<a href="http://www.adobe.com/go/getflashplayer">
   <img src="http://www.adobe.com/images/shared/download_buttons/get_flash_player.gif"
alt="Get Adobe Flash player" /></a>
</div>
</div>
<script type="text/javascript" defer="defer">
// <![CDATA[
// NOTE: Typically you would copy the DashboardApp.swf to the current
// directory and not need an absolute URL
The example code embeds the SWF file in the wrapper page:
swfobject.embedSWF(
"http://sustain.mycompany.local/dashboard/DashboardApp.swf","dashboard",
"100%", "100%","9","http://sustain.mycompany.local/dashboard/expressInstall.swf",
// URL provided is the location of Dashboard SWF
// "dashboard" is the id of div that will be replaced by the dashboard
// "100%","100%" is the width and height of the dashboard
// "9" is the minimum Flash Player version
{
api_prefix: "<%= api_prefix %>",
api_token: "<%= token %>",
config_id: "<%= config_id %>",
locale: navigator.browserLanguage
},
{ menu: "false" },
{ id: "DashboardApp", name: "DashboardApp"}
);
window.onresize = resizeswf;
resizeswf();
<script>
</body>
</html>
Chart Types and Filters
•![]() Charts in the Default Configuration
Charts in the Default Configuration
•![]() Viewing Energy Savings for PCs
Viewing Energy Savings for PCs
•![]() Two Time Period Configuration
Two Time Period Configuration
•![]() Display Members of Data Groups
Display Members of Data Groups
Charts in the Default Configuration
The Default configuration of the dashboard provides charts with different views on energy usage and savings. For details on customizing the charts and layout of the dashboard, contact Cisco EnergyWise Orchestrator Technical Support.
The Sustainability Dashboard reports on energy savings and cost based on the baseline values and displays charts and summary reports based on summarized data from your Orchestrator database.
The data that users see in the dashboard is determined by the data in the Orchestrator database, when the summarization process was last executed, the number of clients reporting to date, the energy use baseline value (determined during Orchestrator implementation), and how you are currently enforcing power management.
Report types available by default in the Sustainability Dashboard:
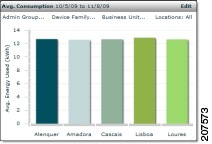
•![]() Gauge—Gauge display that shows power consumption levels during power management enforcement compared to baseline power consumption levels measured before enforcement
Gauge—Gauge display that shows power consumption levels during power management enforcement compared to baseline power consumption levels measured before enforcement
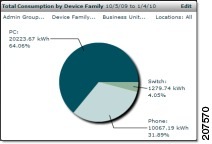
•![]() Pie—Pie chart that shows power consumption levels by device family
Pie—Pie chart that shows power consumption levels by device family
•![]() Summary—Text report with summary figures and text
Summary—Text report with summary figures and text
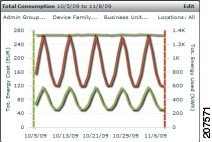
•![]() Time Series—Time-series line chart with dates on the horizontal axis
Time Series—Time-series line chart with dates on the horizontal axis
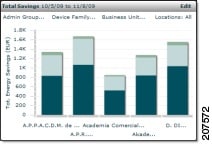
•![]() Category Series—Column or bar chart that can include stacked data
Category Series—Column or bar chart that can include stacked data
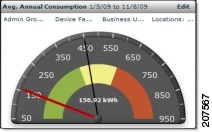
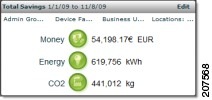
Viewing Energy Savings for PCs
The Default configuration for the dashboard shows data for PCs only in the Average Annual Consumption gauge and all device families with data available in the following charts: Total Savings summary chart, Total Energy Savings summary chart, Total Consumption pie chart, Total Consumption line chart, Total Savings stacked bar chart, and Average Consumption stacked bar chart.
To display savings only for PCs in all charts, select the PC option under Devices Families in Filter Settings. To display only PC data by default, edit the Default configuration file. For details, see the "Editing the Default Configuration File To Show Data For PCs Only" section.
Step 1 ![]() In the Sustainability Dashboard administrator console, click the Dashboard Preview tab.
In the Sustainability Dashboard administrator console, click the Dashboard Preview tab.
If it is not already selected, select Default as the configuration, and then click Load.
Step 2 ![]() For each chart in which you want to display PC data only, click Edit in the chart.
For each chart in which you want to display PC data only, click Edit in the chart.
Step 3 ![]() In Filter Settings, click Device Families.
In Filter Settings, click Device Families.
Step 4 ![]() Clear all of the device types except for PC.
Clear all of the device types except for PC.
Figure 9-3 Clear Device Types
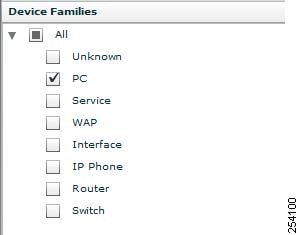

Tip ![]() A fast way to do this is to clear All and select PC.
A fast way to do this is to clear All and select PC.
Step 5 ![]() Click Update.
Click Update.
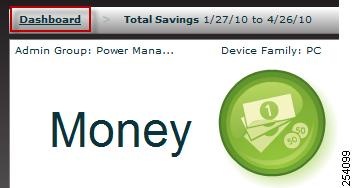
Step 6 ![]() Click the Dashboard link in the top left corner of the chart to display the dashboard with the updated data.
Click the Dashboard link in the top left corner of the chart to display the dashboard with the updated data.
Figure 9-4 Dashboard
Editing the Default Configuration File To Show Data For PCs Only
To only display PC data, add the <collections> element to the configuration file within the <filter> element in the XML code of the default configuration file.
Step 7 ![]() In the Sustainability Dashboard administrator console, click the Dashboard Configuration tab.
In the Sustainability Dashboard administrator console, click the Dashboard Configuration tab.
Step 8 ![]() Under Available Configurations, for Default, click Edit.
Under Available Configurations, for Default, click Edit.
Step 9 ![]() Scroll to each filter section in the XML code and paste the following code just before the </filter> element end:
Scroll to each filter section in the XML code and paste the following code just before the </filter> element end:
<collections>
  <collection_type name="device_family">
    <collection collection_id="1">
      <name>PC</name>
    </collection>
  </collection_type>
</collections>
For example, where you see:
<filter>
  <date_range range_id="latest_4_weeks" />
</filter>
You would paste the collections element just before the </filter> element end with the following result:
<filter>
  <date_range range_id="latest_4_weeks" />
  <collections>
    <collection_type name="device_family">
      <collection collection_id="1">
        <name>PC</name>
      </collection>
    </collection_type>
  </collections>
</filter>
Step 10 ![]() Click Save in the XML window (or Save & Preview).
Click Save in the XML window (or Save & Preview).
Step 11 ![]() Click the Dashboard Preview tab to display the updated Default configuration.
Click the Dashboard Preview tab to display the updated Default configuration.
You might need to select Default as the configuration and then click Load.
Two Time Period Configuration
The Two Time Period report configuration shows average annualized consumption, average annualized savings, and total consumption for PCs during the latest 4 weeks compared to the baseline period.
Configure the Baseline Date Range for the Two Time Period Report
To show the Two Time Period data, update the baseline row in the NamedDateRange table of the EnterprisePowerManagmentDB database.
Note ![]() By default, the Device Families filter is set to display data only for PCs. If someone viewing the dashboard selects another type of device under Device Families (Service, Access Point, Interface, Phone, Router, Switch), the gauge returns the values for those device types. The gauge needle will be close to zero (because many EnergyWise devices consume a fraction of power that a PC consumes).
By default, the Device Families filter is set to display data only for PCs. If someone viewing the dashboard selects another type of device under Device Families (Service, Access Point, Interface, Phone, Router, Switch), the gauge returns the values for those device types. The gauge needle will be close to zero (because many EnergyWise devices consume a fraction of power that a PC consumes).
Step 1 ![]() Connect to the Orchestrator database server.
Connect to the Orchestrator database server.
Step 2 ![]() Click New Query.
Click New Query.
Step 3 ![]() In the SQL Editor toolbar, select EnterprisePowerManagementDB from the drop-down list of available databases.
In the SQL Editor toolbar, select EnterprisePowerManagementDB from the drop-down list of available databases.
Step 4 ![]() Enter this SQL statement in the query window:
Enter this SQL statement in the query window:
update NamedDateRange
set StartDate = '<YYYY-MM-DD>',
    EndDate = '<YYYY-MM-DD>'
where Name = 'baseline'
where YYYY-MM-DD is a valid date.
Step 5 ![]() Replace the given date values with the values you determined to be the baseline period (from the Data Availability report). For details, see the "Gathering Data for and Creating Initial Power Management Policies" chapter in the Cisco EnergyWise Orchestrator Installation Guide.
Replace the given date values with the values you determined to be the baseline period (from the Data Availability report). For details, see the "Gathering Data for and Creating Initial Power Management Policies" chapter in the Cisco EnergyWise Orchestrator Installation Guide.
Step 6 ![]() Click Execute.
Click Execute.
Note ![]() To see the current date range settings for the baseline row, enter this SQL statement:
To see the current date range settings for the baseline row, enter this SQL statement:select * from NamedDateRangeand click Execute.
By default, the Device Families filter displays data only for PCs. If someone viewing the dashboard selects another type of device under Device Families (Service, Access Point, Interface, Phone, Router, Switch), the gauge returns the values for those device types. The gauge needle will be close to zero. (Most EnergyWise devices consume a fraction of power that a PC consumes.)
For results that are more informative, you need to create a custom gauge for a given device type and customize the ranges in the gauge to reflect the power consumption of that device type.
Change Filter Settings
Step 1 ![]() Click Edit on a chart.
Click Edit on a chart.
Step 2 ![]() Click Fixed and select a date setting in the dropdown list. Or, click Custom and select a From date and a to date.
Click Fixed and select a date setting in the dropdown list. Or, click Custom and select a From date and a to date.
Step 3 ![]() Click Update. Changes you make to the dashboard exist for the current browser session.
Click Update. Changes you make to the dashboard exist for the current browser session.
Step 4 ![]() To return to the main dashboard, click the Dashboard link near the top left of the chart or the Close link near the top right of the chart.
To return to the main dashboard, click the Dashboard link near the top left of the chart or the Close link near the top right of the chart.
Note ![]() When you are viewing the Sustainability Dashboard, use the links in the dashboard interface to navigate between chart views, settings, and the main dashboard view. Internet browser navigation buttons do not function within the dashboard application.
When you are viewing the Sustainability Dashboard, use the links in the dashboard interface to navigate between chart views, settings, and the main dashboard view. Internet browser navigation buttons do not function within the dashboard application.
Date Filter Settings
|
|
|
|---|---|
All |
Reports on data collected since Orchestrator has been installed and running. |
Current Month |
Reports on data collected between the first day of the current month through today. |
Current Quarter |
Reports on data collected between the first day of the current quarter through today. |
Current Year |
Reports on data collected between January 1 of the current year through today. |
Previous Month |
Reports on data collected between the first day though the last day of the previous month. |
Previous Quarter |
Reports on data collected between the first day data of the previous quarter though the last day of the third month in the previous quarter. |
Previous Year |
January 1 of the previous year though December 31 of the previous year. |
Latest 4 Weeks |
Includes the week that ended on the nearest previous Saturday and the 3 weeks preceding that. |
Latest 13 Weeks |
Includes the week that ended on the nearest previous Saturday and the 12 weeks preceding that. |
Latest 52 Weeks |
Includes the week that ended on the nearest previous Saturday and the 51 weeks preceding that. |
Rolling 365 Days |
Includes the previous 365 days, ending yesterday. |
Baseline |
This setting is a custom date range defined for the baseline row in the NamedDateRange table of the Orchestrator database. For details on using and configuring the baseline date setting, see Configure the the "Configuring the Baseline Date Setting" section. |
The latest date filter options report on week-based cycles to show usage patterns.
To change the default date settings for charts, you must edit the configuration file. For details on customizing Sustainability Dashboard charts and layout, contact Cisco EnergyWise Orchestrator Technical Support.
Configuring the Baseline Date Setting
The baseline date setting is a custom date range defined for the baseline row in the NamedDateRange table of the Orchestrator database.
The baseline date range is used by default in the Two Time Period configuration. To show the correct data in the Two Time Period configuration, you will need to update the baseline row.
Step 1 ![]() Connect to the Orchestrator database server.
Connect to the Orchestrator database server.
Step 2 ![]() Click New Query.
Click New Query.
Step 3 ![]() In the SQL Editor toolbar, select EnterprisePowerManagementDB (the Orchestrator database) from the drop-down list of available databases.
In the SQL Editor toolbar, select EnterprisePowerManagementDB (the Orchestrator database) from the drop-down list of available databases.
Step 4 ![]() Enter this SQL statement in the query window:
Enter this SQL statement in the query window:
update NamedDateRange set StartDate = '<YYYY-MM-DD>', EndDate = '<YYYY-MM-DD>' where Name = 'baseline'
where YYYY-MM-DD is a valid date.
Step 5 ![]() Replace the given date values with the values you determined as the baseline period (from the Data Availability report). For details, see "Selecting the 2-Week Baseline Period" in the Cisco EnergyWise Orchestrator Installation Guide.
Replace the given date values with the values you determined as the baseline period (from the Data Availability report). For details, see "Selecting the 2-Week Baseline Period" in the Cisco EnergyWise Orchestrator Installation Guide.
Step 6 ![]() Click Execute.
Click Execute.
Step 7 ![]() To see the current date range settings for the baseline row, enter this SQL statement:
To see the current date range settings for the baseline row, enter this SQL statement:
select * from NamedDateRange
and click Execute,
Date Grouping Options
The grouping options for the Total Savings and Total Consumption time series line charts provide different views of trends, based on day, week, month, or quarter.
Data Group Settings
Click Edit in a chart and select or deselect specific members of the groups. Then select or clear the checkboxes next to the member names.
•![]() Administrative Groups
Administrative Groups
•![]() Device Families (PC, Service, Interface, Access Point, Phone, Switch, Router, or Unknown)
Device Families (PC, Service, Interface, Access Point, Phone, Switch, Router, or Unknown)
•![]() Business Units (if implemented by metadata)
Business Units (if implemented by metadata)
•![]() Locations (if implemented by metadata)
Locations (if implemented by metadata)
If you import metadata and create other collections in the database, other groups might be available.
To change the default data group settings for charts, edit the configuration file. For details on customizing Sustainability Dashboard charts and layout, contact Cisco EnergyWise Orchestrator Technical Support.
Display Members of Data Groups
Step 1 ![]() Click Info on a chart to display the members of groups being used for chart, table, or gauge data.
Click Info on a chart to display the members of groups being used for chart, table, or gauge data.
Step 2 ![]() Click Done to return to chart view.
Click Done to return to chart view.
Note ![]() When you are viewing the Sustainability Dashboard (or users in your organization are viewing the deployed dashboard), use the links provided in the dashboard interface to navigate between chart views, settings, and the main dashboard. Internet browser navigation buttons do not function within the dashboard application.
When you are viewing the Sustainability Dashboard (or users in your organization are viewing the deployed dashboard), use the links provided in the dashboard interface to navigate between chart views, settings, and the main dashboard. Internet browser navigation buttons do not function within the dashboard application.
Sustainability Dashboard Reports
Data Availability Report
The Data Availability report provides information on when PC data is available for PC clients so that you can determine a baseline start and end date and generate a Baseline report.
The Data Availability report displays a table showing data for every day for which data has been reported in the specified date range and administrative group.
Figure 9-5 Data Availability Report
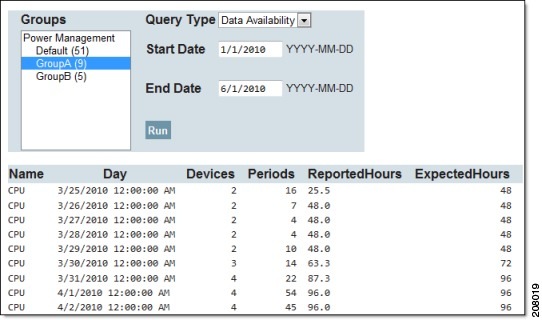
•![]() Name—Specifies whether the data is from a CPU or display.
Name—Specifies whether the data is from a CPU or display.
•![]() Day—The date for which data was reported.
Day—The date for which data was reported.
•![]() Devices—Specifies the number of devices reporting any data for a specific day (not necessarily for the entire day).
Devices—Specifies the number of devices reporting any data for a specific day (not necessarily for the entire day).
•![]() Periods—The number of periods (any continuous period) in which a CPU or display was in a particular state.
Periods—The number of periods (any continuous period) in which a CPU or display was in a particular state.
•![]() Reported Hours—Specifies the number of hours actually reported in the DeviceComponentStatePeriod table. The number might be less than the expected hours, depending on when PCs came online.
Reported Hours—Specifies the number of hours actually reported in the DeviceComponentStatePeriod table. The number might be less than the expected hours, depending on when PCs came online.
•![]() Expected Hours—The number of devices multiplied by 24 hours.
Expected Hours—The number of devices multiplied by 24 hours.
For details on determining which 2-week period is the best for calculating the baseline, see the "Selecting the 2-Week Baseline Period" chapter in the Cisco EnergyWise Orchestrator Installation Guide.
Baseline Report
The Baseline report calculates the baseline numbers for PC devices (CPU and Display) based on a specified date range. Use the date range for the values of the Average kWh per PC per year setting in the Global Settings tab.
The Baseline report presents the energy consumed by CPUs and Displays (per device and annualized) for the specified administrative group and date range, which represents the baseline period of reporting.
Figure 9-6 Baseline Report
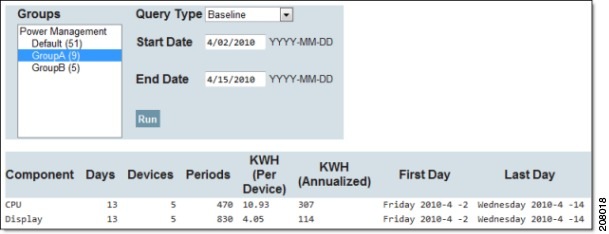
•![]() Component—The type of device (CPU or Display).
Component—The type of device (CPU or Display).
•![]() Days—The number of days in the baseline reporting period.
Days—The number of days in the baseline reporting period.
•![]() Devices—The number of devices in the reporting period.
Devices—The number of devices in the reporting period.
•![]() Periods—The number of periods in which a CPU or Display was in a particular state (any continuous period where a device was in a particular state).
Periods—The number of periods in which a CPU or Display was in a particular state (any continuous period where a device was in a particular state).
•![]() kWh (Per Device)—The calculated kWh (based on given wattages on the Global Settings page) for the component.
kWh (Per Device)—The calculated kWh (based on given wattages on the Global Settings page) for the component.
•![]() kWh (Annualized)—The kWh calculated and annualized (based on given wattages on the Global Settings page) for the component.
kWh (Annualized)—The kWh calculated and annualized (based on given wattages on the Global Settings page) for the component.
•![]() First Day—The date of the first day of the reporting period.
First Day—The date of the first day of the reporting period.
•![]() Last Day—The date of the last day of the reporting period.
Last Day—The date of the last day of the reporting period.
For details about the baseline report, see the "Generating the Baseline Numbers for Future Energy-Savings Reports" chapter in the Cisco EnergyWise Orchestrator Installation Guide.
 Feedback