- Preface
- Product Overview
- Command-Line Interfaces
- Configuring the Switch for the First Time
- Administering the Switch
- Configuring Virtual Switching Systems
- Configuring the Cisco IOS In-Service Software Upgrade Process
- Configuring the Cisco IOS XE In Service Software Upgrade Process
- Configuring Interfaces
- Checking Port Status and Connectivity
- Configuring Supervisor Engine Redundancy Using RPR and SSO on Supervisor Engine 6-E and Supervisor Engine 6L-E
- Configuring Supervisor Engine Redundancy Using RPR and SSO on Supervisor Engine 7-E, Supervisor Engine 7L-E, and Supervisor Engine 8-E
- Configuring Cisco NSF with SSO Supervisor Engine Redundancy
- Environmental Monitoring and Power Management
- Configuring Power over Ethernet
- Configuring the Catalyst 4500 Series Switch with Cisco Network Assistant
- Configuring VLANs, VTP, and VMPS
- Configuring IP Unnumbered Interface
- Configuring Layer 2 Ethernet Interfaces
- Configuring EVC-Lite
- Configuring Cisco IOS Auto Smartport Macros
- Configuring SmartPort Macros
- Configuring STP and MST
- Configuring Flex Links and MAC Address-Table Move Update
- Configuring Resilient Ethernet Protocol
- Configuring Optional STP Features
- Configuring EtherChannel and Link State Tracking
- Configuring IGMP Snooping and Filtering, and MVR
- Configuring IPv6 Multicast Listener Discovery Snooping
- Configuring 802.1Q Tunneling, VLAN Mapping, and Layer 2 Protocol Tunneling
- Configuring Cisco Discovery Protocol
- Configuring LLDP, LLDP-MED, and Location Service
- Configuring UDLD
- Configuring Unidirectional Ethernet
- Configuring Layer 3 Interfaces
- Configuring Cisco Express Forwarding
- Configuring Unicast Reverse Path Forwarding
- Configuring IP Multicast
- Configuring ANCP Client
- Configuring Bidirectional Forwarding Detection
- Configuring Policy-Based Routing
- Configuring VRF-lite
- Configuring Quality of Service
- Configuring Voice Interfaces
- Configuring Private VLANs
- Configuring MACsec Encryption
- Configuring 802.1X Port-Based Authentication
- Configuring the PPPoE Intermediate Agent
- Configuring Web-Based Authentication
- Configuring Wired Guest Access
- Configuring Port Security
- Configuring Auto Security
- Configuring Control Plane Policing and Layer 2 Control Packet QoS
- Configuring Dynamic ARP Inspection
- Configuring DHCP Snooping, IP Source Guard, and IPSG for Static Hosts
- Configuring DHCP Snooping, IP Source Guard, and IPSG for Static Hosts
- Configuring Network Security with ACLs
- Support for IPv6
- Port Unicast and Multicast Flood Blocking
- Configuring Storm Control
- Configuring SPAN and RSPAN
- Configuring Wireshark
- Configuring Enhanced Object Tracking
- Configuring System Message Logging
- Onboard Failure Logging (OBFL)
- Configuring SNMP
- Configuring NetFlow-lite
- Configuring Flexible NetFlow
- Configuring Ethernet OAM and CFM
- Configuring Y.1731 (AIS and RDI)
- Configuring Call Home
- Configuring Cisco IOS IP SLA Operations
- Configuring RMON
- Performing Diagnostics
- Configuring WCCP Version 2 Services
- Configuring MIB Support
- ROM Monitor
- Acronyms and Abbreviations
Catalyst 4500 Series Switch Software Configuration Guide, IOS XE 3.7.xE and IOS 15.2(3)Ex
Bias-Free Language
The documentation set for this product strives to use bias-free language. For the purposes of this documentation set, bias-free is defined as language that does not imply discrimination based on age, disability, gender, racial identity, ethnic identity, sexual orientation, socioeconomic status, and intersectionality. Exceptions may be present in the documentation due to language that is hardcoded in the user interfaces of the product software, language used based on RFP documentation, or language that is used by a referenced third-party product. Learn more about how Cisco is using Inclusive Language.
- Updated:
- January 19, 2015
Chapter: Configuring RMON
Configuring RMON
This chapter describes how to configure Remote Network Monitoring (RMON) on your Catalyst 4500 series switch. RMON is a standard monitoring specification that defines a set of statistics and functions that can be exchanged between RMON-compliant console systems and network probes. RMON provides you with comprehensive network-fault diagnosis, planning, and performance-tuning information.
This chapter consists of these sections:

Note![]() For complete syntax and usage information for the switch commands used in this chapter, see the Cisco Catalyst 4500 Series Switch Command Reference and related publications at this location:
For complete syntax and usage information for the switch commands used in this chapter, see the Cisco Catalyst 4500 Series Switch Command Reference and related publications at this location:
http://www.cisco.com/en/US/products/hw/switches/ps4324/index.html
If a command is not in the Catalyst 4500 Series Switch Command Reference, you can locate it in the Cisco IOS library. See related publications at this location:
http://www.cisco.com/en/US/products/ps6350/index.html
About RMON
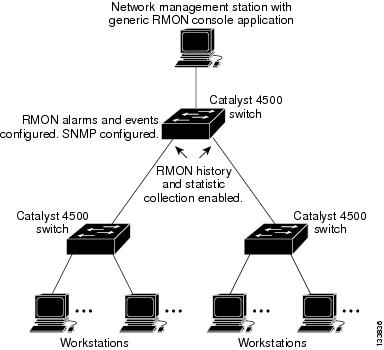
RMON is an Internet Engineering Task Force (IETF) standard monitoring specification that allows various network agents and console systems to exchange network monitoring data. You can use the RMON feature with the Simple Network Management Protocol (SNMP) agent in the switch to monitor all the traffic flowing among switches on all connected LAN segments.
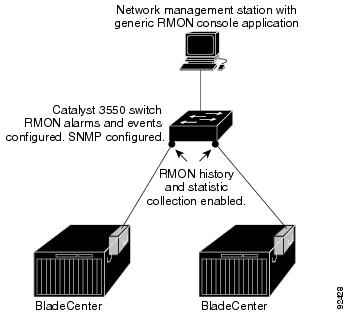
Figure 72-1 Remote Monitoring Example


The switch supports these RMON groups (defined in RFC 1757):
- Statistics (RMON group 1)—Collects Ethernet, Fast Ethernet, and Gigabit Ethernet statistics on an interface.
- History (RMON group 2)—Collects a history group of statistics on Ethernet, Fast Ethernet, and Gigabit Ethernet interfaces for a specified polling interval.
- Alarm (RMON group 3)—Monitors a specific MIB object for a specified interval, triggers an alarm at a specified value (rising threshold), and resets the alarm at another value (falling threshold). Alarms can be used with events; the alarm triggers an event, which can generate a log entry or an SNMP trap.
- Event (RMON group 9)—Determines the action to take when an event is triggered by an alarm. The action can be to generate a log entry or an SNMP trap.
Because switches supported by Cisco IOS Release 12.2(31)SG use hardware counters for RMON data processing, the monitoring is more efficient, and little processing power is required.
Configuring RMON
This section describes how to configure RMON on your switch. It contains this configuration information:
- Default RMON Configuration
- Configuring RMON Alarms and Events
- Configuring RMON Collection on an Interface
Default RMON Configuration
RMON is disabled by default; no alarms or events are configured.
Configuring RMON Alarms and Events
You can configure your switch for RMON by using the command-line interface (CLI) or an SNMP-compatible network management station. We recommend that you use a generic RMON console application on the network management station (NMS) to take advantage of RMON’s network management capabilities. You must also configure SNMP on the switch to access RMON MIB objects. For more information, see Chapter65, “Configuring SNMP”
To enable RMON alarms and events, perform this task:
To disable an alarm, use the no rmon alarm number global configuration command on each alarm you configured. You cannot disable at once all the alarms that you configured. To disable an event, use the no rmon event number global configuration command. To learn more about alarms and events and how they interact with each other, see RFC 1757.
You can set an alarm on any MIB object. The following example configures RMON alarm number 10 by using the rmon alarm command. The alarm monitors the MIB variable ifEntry.20.1 once every 20 seconds until the alarm is disabled and checks the change in the variable’s rise or fall. If the ifEntry.20.1 value shows a MIB counter increase of 15 or more, such as from 100000 to 100015, the alarm is triggered. The alarm in turn triggers event number 1, which is configured with the rmon event command. Possible events can include a log entry or an SNMP trap. If the ifEntry.20.1 value changes by 0, the alarm is reset and can be triggered again.
The following example creates RMON event number 1 by using the rmon event command. The event is defined as High ifOutErrors and generates a log entry when the event is triggered by the alarm. The user jjones owns the row that is created in the event table by this command. This example also generates an SNMP trap when the event is triggered.
Configuring RMON Collection on an Interface
You must first configure RMON alarms and events to display collection information.
To collect group history statistics on an interface, perform this task:
To collect group Ethernet statistics on an interface, perform this task:
Displaying RMON Status
To display the RMON status, use one or more of the following privileged EXEC commands:
|
|
|
|---|---|
|
|
|
|
|
|
|
|
|
|
|
|
|
|
 Feedback