Faults

About Faults


Note

For detailed reference information about faults, events, errors, and system messages, see the Cisco ACI System Messages Reference Guide or the Cisco APIC Management Information Model Reference, which is a web-based application.


The Application Policy Infrastructure Controller (APIC) maintains a comprehensive, up-to-date run-time representation of the administrative and operational state of the ACI fabric system in a collection of managed objects (MOs). In this model, a fault is represented as a mutable, stateful, and persistent MO. When a specific condition occurs, such as a component failure or an alarm, the system creates a fault MO as a child object to the MO that is primarily associated with the fault. For a fault object class, the fault conditions are defined by the fault rules of the parent object class. An MO class can have multiple defined faults, each of which has a different fault code and a different fault rule. The fault code uniquely identifies a fault definition, and a fault rule uniquely identifies the fault conditions. For a given fault code, a parent MO instance can have only one fault MO.

In most cases, a fault MO is automatically created, escalated, de-escalated, and deleted by the system as specific conditions are detected. If the same condition is detected multiple times while the corresponding fault MO is active, the properties of the fault MO are updated, and no additional instances of the fault MO are created. A fault MO contains an “occur” property to record how many times a fault condition occurs. This property is useful for detecting fault flapping.

The creation of a fault MO can be triggered by internal processes such as finite state machine (FSM) transitions or detected component failures, or by conditions specified by various fault policies, some of which are user configurable. For example, you can set fault thresholds on statistical measurements such as health scores, data traffic, or temperatures.

A fault MO remains in the system after the fault condition is cleared until it is deleted from the system by one of the following circumstances:

  • When the parent MO is deleted.

  • When a cleared fault is acknowledged by the user.

  • When a cleared fault has existed longer than the retention interval.

Fault Objects and Records

In the Cisco APIC Management Information Model Reference, the fault package contains the fault-related object classes.

Fault Objects

A fault object is represented by one of the following two classes:

  • fault:Inst—When a fault occurs in an MO, a fault instance MO (fault:Inst) is created under the MO that experienced the fault condition.

  • fault:Delegate—Many MOs are used internally by the system and are not presented conspicuously in the APIC GUI. In order to improve the visibility of a fault that might otherwise go unnoticed, for some faults a corresponding fault delegate MO (fault:Delegate) is created and attached to a logical MO that has higher visibility in the APIC. A fault delegate MO is an identical copy of the original fault MO (fault:Inst). The identity of the original MO that experienced the fault condition is stored in the fault:Delegate:affected property of the fault delegate MO.

    As an example, if the system attempts to deploy the configuration for an endpoint group to multiple nodes and encounters issues on one of the nodes, the system raises a fault (fault:Inst MO) on the node object affected by the issue and also raises a corresponding fault delegate on the object that represents the endpoint group. The fault delegate allows the user to see all the faults related to the endpoint group in a single place, regardless of where they were triggered.

Fault Records

A fault record records the history of a state transition for a fault instance object. For every fault state change, a fault record object (fault:Record) is created in the fault log. A fault record is an immutable object that cannot be modified either by the user or by the system. Record creation is triggered by fault instance MO creation or deletion or by modification of key properties (for example, severity, life cycle, or acknowledgment) of the fault instance object. All properties of the record are set at the time the record object is created.

A record object contains a complete snapshot of the fault instance object and is logically organized as a flat list under a single container. The record object contains properties from the corresponding instance object (fault:Inst) such as severity (original, highest, and previous), acknowledgment, occurrence, and life cycle as well as inherited properties that provide a snapshot of the fault instance and the nature and time of its change. The record is meant to be queried using time-based filters or property filters for severity, affected DN, or other criteria.

The object creation can also trigger the export of record details to an external destination by syslog. To analyze how a fault object is created and deleted, inspect the fault records.

Fault record objects are purged only when the maximum capacity of fault record objects is reached and space is needed for new fault records. Depending on the space availability, a fault record can be retained long after the fault object itself has been deleted. The retention and purge behavior is specified in the fault record retention policy (fault:ARetP) object. For information about configuring the retention policy, see Log Retention Policies.

Fault Severity

A fault raised by the system can transition through more than one severity during its life cycle. This table describes the possible fault severities in decreasing order of severity:

Severity Description
critical A service-affecting condition that requires immediate corrective action. For example, this severity could indicate that the managed object is out of service and its capability must be restored.
major A service-affecting condition that requires urgent corrective action. For example, this severity could indicate a severe degradation in the capability of the managed object and that its full capability must be restored.
minor A nonservice-affecting fault condition that requires corrective action to prevent a more serious fault from occurring. For example, this severity could indicate that the detected alarm condition is not currently degrading the capacity of the managed object.
warning A potential or impending service-affecting fault that currently has no significant effects in the system. An action should be taken to further diagnose, if necessary, and correct the problem to prevent it from becoming a more serious service-affecting fault.
info A basic notification or informational message that is possibly independently insignificant. (Used only for events)
cleared A notification that the condition that caused the fault has been resolved, and the fault has been cleared.

Note

There is no 'debug' severity level.


Fault Types

A fault raised by the system can be one of the types described in this table:

Type Description
generic

The system has detected a generic issue.

equipment

The system has detected that a physical component is inoperable or has another functional issue.

configuration

The system is unable to successfully configure a component.

connectivity

The system has detected a connectivity issue, such as an unreachable adapter.

environmental

The system has detected a power issue, thermal issue, voltage issue, or a loss of CMOS settings.

management

The system has detected a serious management issue, such as one of the following:

  • Critical services could not be started.

  • Components in the instance include incompatible firmware versions.

network

The system has detected a network issue, such as a link down.

operational

The system has detected an operational issue, such as a log capacity limit or a failed component discovery.

Fault Properties

The system provides detailed information about each fault raised. This table describes the fault properties:

Property Description
code The fault code (for example, F1017).
rule id The identifier of the rule that generated the fault instance.
id The unique identifier assigned to the fault.
cause The probable cause category (for example, equipment-inoperable).
type The type of fault (for example: connectivity or environmental).
severity The current severity level of the fault.
created The day and time when the fault occurred.
lastTransition The day and time on which the severity or life cycle state for the fault last changed.
descr The description of the fault.
lc The life cycle state of the fault (for example, soaking).
occur The number of times the event that raised the fault occurred.
origSeverity The severity assigned to the fault on the first time that it occurred.
prevSeverity If the severity has changed, this is the previous severity.
highestSeverity The highest severity encountered for this issue.

Fault Life Cycle

APIC fault MOs are stateful, and a fault raised by the APIC transitions through more than one state during its life cycle. In addition, the severity of a fault might change due to its persistence over time, so a change in the state may also cause a change in severity. Each change of state causes the creation of a fault record and, if external reporting is configured, can generate a syslog or other external report.

Only one instance of a given fault MO can exist on each parent MO. If the same fault occurs again while the fault MO is active, the APIC increments the number of occurrences.

The fault life cycle is shown in the following state diagram:
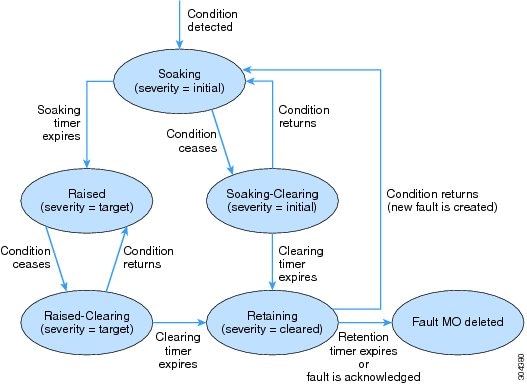
The characteristics of each state are as follows:

  • Soaking—A fault MO is created when a fault condition is detected. The initial state is Soaking, and the initial severity is specified by the fault policy for the fault class. Because some faults are important only if they persist over a period of time, a soaking interval begins, as specified by the fault policy. During the soaking interval, the system observes whether the fault condition persists or whether it is alleviated and reoccurs one or more times. When the soaking interval expires, the next state depends on whether the fault condition remains.

  • Soaking-Clearing— If the fault condition is alleviated during the soaking interval, the fault MO enters the Soaking-Clearing state, retaining its initial severity. A clearing interval begins. If the fault condition returns during the clearing interval, the fault MO returns to the Soaking state. If the fault condition does not return during the clearing interval, the fault MO enters the Retaining state.

  • Raised—If the fault condition persists when the soaking interval expires, the fault MO enters the Raised state. Because a persistent fault might be more serious than a transient fault, the fault is assigned a new severity, the target severity. The target severity is specified by the fault policy for the fault class. The fault remains in the Raised state at the target severity until the fault condition is alleviated.

  • Raised-Clearing—When the fault condition of a Raised Fault is alleviated, the fault MO enters the Raised-Clearing state. The severity remains at the target severity, and a clearing interval begins. If the fault condition returns during the clearing interval, the fault MO returns to the Raised state.

  • Retaining—When the fault condition is absent for the duration of the clearing interval in either the Raised-Clearing or Soaking-Clearing state, the fault MO enters the Retaining state with the severity level cleared. A retention interval begins, during which the fault MO is retained for the length of time that is specified in the fault policy. This interval ensures that the fault reaches the attention of an administrator even if the condition that caused the fault has been alleviated, and that the fault is not deleted prematurely. If the fault condition reoccurs during the retention interval, a new fault MO is created in the Soaking state. If the fault condition has not returned before the retention interval expires, or if the fault is acknowledged by the user, the fault MO is deleted.

The soaking, clearing, and retention intervals are specified in the fault life cycle profile (fault:LcP) object.


Note

A fault lifecycle change might not take effect on a switch if the inter-process messaging system is overloaded. For example, overloading can occur when the syslog severity level is set to “debug” or when pushing an extremely large configuration much beyond the scale limit of the switch.


Configuring the Fault Life Cycle Intervals

The fault lifecycle has three user-configurable parameters.

Procedure

Step 1

Navigate to Fabric > Fabric Policies > Policies > Monitoring > Common Policy > Fault Lifecycle Policy.

Step 2

In the work pane, you can configure the following parameters:

  • Clearing Interval—The range is 0 to 3600 seconds. The default is 120 seconds.

  • Retention Interval—The range is 0 to 31536000 seconds. The default is 3600 seconds.

  • Soaking Interval—The range is 0 to 3600 seconds. The default is 120 seconds.

Step 3

To see the nodes and policies that will be affected by changes to this policy, click Show Usage.

Step 4

Click Submit.


Viewing Faults

The APIC GUI displays fault data in multiple views and locations, presenting the information in aggregate for assessing system health, and in detail for troubleshooting specific problems.

Fault Tables

In ACI, a fault instance (either fault:Inst or fault:Delegate) is created under a specific MO that experiences the fault condition. Each component in the APIC UI, such as a tenant static path binding or a fabric node interface, represents an MO. For each of these MOs, the GUI provides a Faults tab that lists all active fault objects that have occurred on the MO itself or on its child MOs at any level.

In the table displayed by the Faults tab, you can view the properties and details of a specific active fault by double-clicking the fault row. To view the records (fault:Record objects) of previous faults of a component, click the History > Faults tab under the component.

Fault Group View and List View

With the large number of fabric nodes that a single APIC can manage, many faults may be generated for display. To simplify the viewing of so many faults, some components in the APIC UI provide two fault display modes:

  • Group View—Displays one row for each fault code, along with the number of instances reported with that fault code. By double-clicking the row for a specific fault code in the group view, you can switch to a list view of that fault code, where all instances of the fault code are displayed.

  • List View—Displays one row for each fault instance.

When a component supports the group view, its default mode is group view. You can toggle between the modes by clicking the List View or Group View icon in the top right corner of the Faults tab toolbar.

The following GUI locations are examples of components supporting the group view:

  • System > Faults— Displays all faults for every node (APIC, leaf, or spine) in the ACI fabric.

  • Fabric > Inventory > Pod number > Faults— Displays all faults for MOs under this pod.

  • Fabric > Inventory > Pod number > node > Faults— Displays all faults for MOs under this node.

Fault Counts in Dashboards

In addition to the faults tables, the APIC GUI provides a Dashboard tab for some components, such as a tenant or a pod. The dashboard provides a summary view of the health score and fault counts for the MOs under the component. Separate panels are provided for Fault Counts By Domain, such as infra or tenant, and for Fault Counts By Type, such as configuration or environmental. Each panel provides the option to hide all acknowledged faults and to hide all delegated faults.

In each panel, the dashboard displays the aggregated fault count for each severity level. By double-clicking a fault row in the dashboard panel, you can switch to the Faults tab in the same work pane, with appropriate display filtering applied in the list view mode.

The following GUI locations are examples of component dashboards:

  • System > Dashboard— Displays fault counts for the entire ACI Fabric.

  • Tenant > name > Dashboard— Displays fault counts for all MOs under this tenant.

  • Fabric > Inventory > Pod number > Dashboard— Displays fault counts for all MOs under this pod.

  • Fabric > Inventory > Pod number > node > Dashboard— Displays fault counts for all MOs under this node.

Viewing Faults Using the GUI

Logged faults are presented in several places in the GUI, filtered to show only those faults that are relevant to the current GUI context, such as a tenant or pod menu. Wherever a Faults tab appears in the GUI work pane, you can view the relevant entries from the fault log.

This procedure shows how to view tenant faults as an example.

Procedure


Step 1

Navigate to Tenant > name > name.

Step 2

In the work pane, click the Faults tab.

The faults table is displayed.

  • If the UI component supports the group view, the table shows the faults codes that have occurred and the number of instances (fault count) for each fault code. To view the instances of a particular fault code, double-click the row of the fault code in the table.

  • If the UI component does not support the group view, the table shows all fault instances.

Step 3

To view the fault properties of a particular fault instance, double-click the row of the instance in the table.

The Fault Properties window opens. In this window you can view general properties of the fault, troubleshooting information such as the explanation and recommended action, and the fault history.

Step 4

To view the fault records, follow these steps:

  1. Navigate again to the top-level object (in this example, Tenant > name > name).

  2. In the work pane, click the History tab.

  3. Under the History tab, click the Faults tab.

  4. Double-click the row of a fault in the table to display its fault record.


Viewing Faults Using the NX-OS Style CLI

To display a summary of faults for a specific entity, enter the show faults command with the appropriate qualifiers. Some common forms of the show faults command are the following:

  • show faults

  • show faults controller

  • show faults leaf

  • show faults leaf interface

  • show faults spine

  • show faults tenant

To display a fault record for a specific entity, add the history keyword to the show faults command with the appropriate qualifiers, such as show faults history leaf 101 .

For details of these and other CLI commands, see the Cisco APIC NX-OS Style CLI Command Reference.


Note

Beginning with Cisco APIC Release 1.2, the Cisco APIC Object Model CLI is deprecated and the default CLI is the NX-OS style CLI.


Viewing Faults Using the API

You can view faults using the API query methods to search for fault MOs, which can be of class fault:Inst or fault:Delegate. You can search for all instances or you can refine your search using query filters as described in the Cisco APIC REST API Configuration Guide.

This example shows how to query a physical interface for the faults associated to it:


GET http://192.0.20.123/api/node/mo/topology/pod-1/node-1017/sys/phys-[eth1/11]/phys.xml?rsp-subtree-include=faults

RESPONSE:
<ethpmPhysIf 
.
. [PROPERTIES TRUNCATED FOR READABILITY]
.
>
  <faultInst 
	    ack="no" 
	    cause="port-failure" 
	    changeSet="operStQual (New: sfp-missing)" 
	    childAction="" 
	    code="F0546" 
	    created="2014-07-24T02:54:23.533+00:00" 
	    descr="Port is down, reason:sfp-missing, used by:discovery" 
	    domain="access" 
	    highestSeverity="warning" 
	    lastTransition="2014-07-24T02:56:33.054+00:00" 
	    lc="raised" 
	    occur="1" 
	    origSeverity="warning" 
	    prevSeverity="warning" 
	    rn="fault-F0546" 
	    rule="ethpm-if-port-down-no-infra" 
	    severity="warning" 
	    status="" 
	    subject="port-down" 
	    type="communications"/>
</ethpmPhysIf>

This example shows how to request all the fault records associated to a multicast tree object:


GET http://192.0.20.123/api/node/mo/topology/pod-1/node-1017/sys/isis/inst-default/dom-overlay-1/fmtree-2.xml ?rsp-subtree-include=fault-records

For detailed information about configuring the APIC REST API, see the Cisco APIC REST API Configuration Guide.

External Reporting of Faults

The APIC can report faults and events asynchronously to external systems through the following mechanisms:

  • Syslog

  • Cisco Call Home

  • API subscriptions

  • SNMP


    Note

    ACI fault objects and records are not reported through SNMP. SNMP messages report error conditions and events that are listed in supported MIBs.
    • The APIC controller supports SNMP for APIC-related conditions listed in supported MIBs.

    • SNMP messages for ACI leaf and spine switches are sent by the switches themselves, but APIC can configure SNMP trap destinations for SNMP traps sent by ACI switches.

    • For a list of SNMP MIBs and traps supported by ACI, see the Cisco ACI MIB Support List.

For information on configuring external reporting, see the following documents:

  • Cisco APIC Troubleshooting Guide

  • Cisco APIC REST API Configuration Guide

Researching a Fault

When a fault object is created, it contains information about the particular fault instance, such as the creation time, lifecycle state, number of occurrences, and the specific object to which it is attached. The instance object also contains a limited set of properties common to all instances of the fault class, such as the fault code and a brief cause of the problem. While this information is useful, you can find more information, such as an expanded explanation and recommended action, by accessing the reference documentation for the fault class. In the APIC GUI, you can double-click a fault in any fault table.

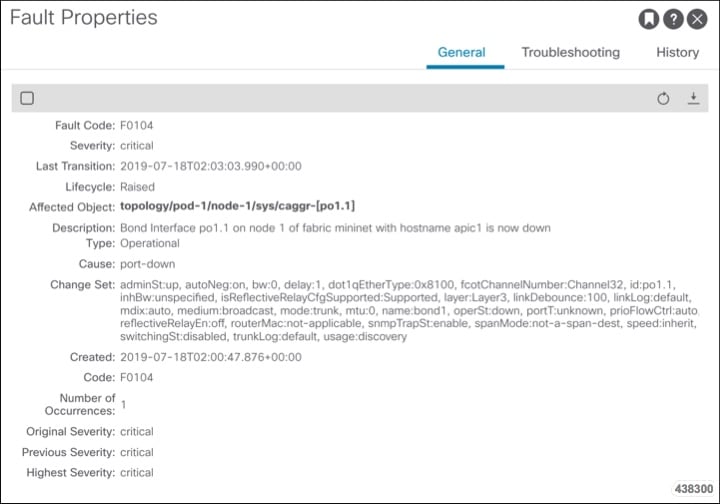
As described in Viewing Faults, there are several methods for inspecting the current faults. For this Cisco APIC Release 4.1(1) example, you can double-click a fault table row in the GUI for the Fault Code number F0104. The Fault Properties window below opens, displaying the instance properties of this fault class:

The Fault Properties window contains three tabs, providing the following information:

  • General— Provides time, severity, and state information for this fault instance. The Description string may provide specific object instances related to the fault instance.

  • Troubleshooting— Provides a general description of the fault cause, and gives a recommended action to address the fault.

  • History— Provides the fault record for a particular fault instance of a fault delegate MO.

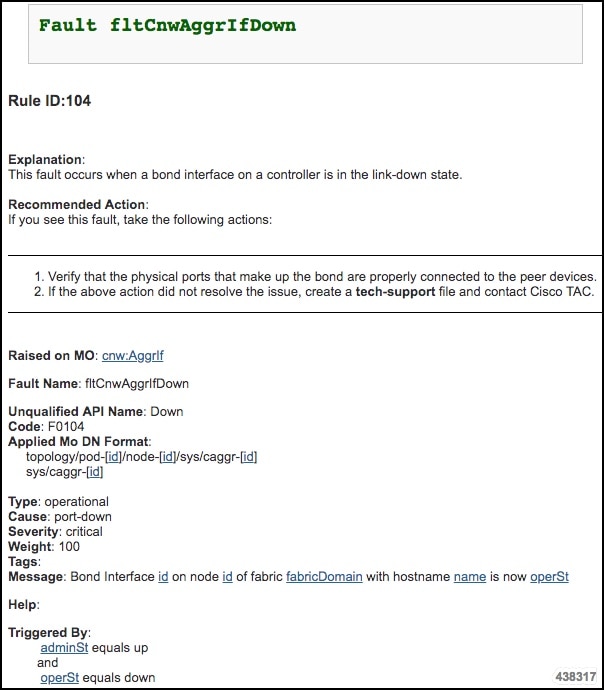
Click the help icon in the Fault Properties window to display the class properties of the fault:

In earlier APIC releases, the class information might not be accessible in the same way. In that case, you can also find the fault class properties in the following sources:

  • Cisco APIC System Faults and Messages Reference— An interactive Web-based lookup tool. Enter an APIC fault or event code to learn the cause, recommended action, affected object, severity, and other properties of the system message.

  • Cisco APIC Management Information Model Reference— A comprehensive Web-based reference listing all APIC object classes and properties, event types, fault types, and syslog messages. In the Navigation frame of this reference:

    • Select the Classes tab to view the properties of the affected object class for a fault or event.

    • Select the Faults tab to view the faults by affected object or by the fault name.

    • Select the Syslog Messages tab and the Syslog Faults link to view a list of faults by fault code.

    This document is also embedded in the APIC GUI and can be accessed by clicking the "Help and Tools" icon in the main menu bar, then selecting Documentation > API Documentation.

  • Cisco ACI System Messages Reference Guide— A reference document listing the system messages sent by APIC and by the ACI switches, and describing the format of the messages. For a fault class, this document lists only the severity, explanation, and recommended action.

Handling Expected Faults

During the operation of the ACI fabric, some faults may be generated due to conditions that are benign at the time. For example, a fault with fault code F0532 can be raised against a port which is currently down but associated with an endpoint group (EPG). This condition is expected and can be ignored if the port is currently unused but planned for use in the future. In a situation such as this, where you are fully aware of a fault-generating condition and wish to ignore it, you have the ability to suppress the fault notification completely (squelch) or to temporarily ignore it (acknowledge).

  • Squelch— To permanently suppress all faults with a specific fault code, you can squelch the fault. Any fault with the squelched fault code will then be discarded and will not appear in any dashboard or log. If you later wish to unsquelch the fault code, you must do so manually, but any faults that were squelched during the squelched period will not appear.

    You can squelch a fault either from a fault table or in a monitoring policy. Squelched faults have no effect on the health score.

  • Acknowledge— To temporarily ignore a particular fault for a specific object (by its distinguished name or DN), you can acknowledge the fault. Acknowledging a fault has two purposes:

    • To mark the fault as a known acknowledged fault so that users can safely ignore the notifications.

    • To delete the fault before it is deleted automatically by the retention policy. If a fault is in retain life cycle, it will be deleted immediately when it’s acknowledged. Otherwise, it will be deleted once the retention time has passed. If the fault condition resolves but then reappears, you must reacknowledge the fault.

    By default, acknowledging a fault does not change its contribution to the health score, but you can choose to ignore the acknowledged fault in the health score evaluation. You can also choose to hide acknowledged faults from the GUI.

The following table shows some of the advantages and disadvantages of each method:

Acknowledge

Squelch

Granularity of control

+ Full control, any specific fault can be acknowledged.

- Each fault must be acknowledged individually.

+ All faults with the same fault code are squelched with one setting.

- If some faults with the fault code should not be ignored, squelching should not be used.

Consistency

+ Because the acknowledge status is reset when a fault clears, no user intervention is required to remove the acknowledgement after a temporary fault condition is resolved.

- If the expected fault reappears intermittently, it must be acknowledged every time it appears.

+ An intermittent fault needs only to be squelched once.

- If the fault will need to be unsquelched later, it is up to the user to remember to change the setting.

Visibility

+ You have the option to hide an acknowledged fault.

- To hide an acknowledged fault from monitoring, you must add a filter.

+ A squelched fault does not appear in monitoring, with no need for a filter.

- There is no method to notify the user about a fault condition for a squelched fault on any MO.

- Because there is no indication that a fault has been squelched, it is up to the user to remember the setting if the fault should be unsquelched later.

Health Score Impact

You have the option to allow or prevent an acknowledged fault from affecting the health score.

A squelched fault does not affect the health score.

Acknowledging Faults

Acknowledging a fault that is in the 'retaining' lifecycle state deletes the fault immediately instead of waiting for the retention interval to expire (the retention interval is one hour by default). You can acknowledge a fault that is in another lifecycle state in order to mark the fault as an expected fault or as a fault to be ignored.

Procedure


Step 1

Navigate to the area of the GUI (such as Tenant, Fabric, or Access) that is affected by the fault.

You can acknowledge a fault in any Faults tab in the GUI. The locations are described in Viewing Faults Using the GUI.

Step 2

In the work pane, click the Faults tab.

Step 3

In the Faults table, locate the desired fault code and double-click the entry to display the fault instances.

Step 4

Check the Acked checkbox next to the fault instance to acknowledge and delete the fault.

Tip 

You can acknowledge or unacknowledge all instances in a faults instances table with the Acknowledge All and Un-Acknowledge All checkboxes in the toolbar of the table.


Ignoring Acknowledged Faults

Ignoring an acknowledged fault prevents the fault from being included in the computation of the health score of the ACI fabric.

Procedure


Step 1

Navigate to Fabric > Fabric Policies > Policies > Monitoring > Common Policy > Health Score Evaluation Policies > Health Score Evaluation Policy.

Step 2

In the work pane, check Ignore Acknowledged Faults.


Hiding Acknowledged and Delegated Faults

From any APIC GUI dashboard or faults tab, you can choose to hide acknowledged or delegated faults.


Tip

When a fault condition results in the creation of both a fault and a delegated fault, both will appear in the fault count summary. To see a more accurate fault count, you can hide delegated faults.


Procedure


Step 1

Navigate to any dashboard or fault table.

  • Navigate to the Fault Counts By Domain or Fault Counts By Type panel in any controller, tenant, pod, or switch dashboard, such as System > Dashboard or Tenant > name > name > Dashboard.
  • Navigate to any controller, tenant, pod, or switch fault table, such as System > Faults or Tenant > name > name > Faults. In the fault table, click the tools icon in the table toolbar to display the tool options:
Step 2

To hide acknowledged faults, check the checkbox for Hide Acknowledged Faults.

Step 3

To hide delegated faults, check the checkbox for Hide Delegated Faults.


Changing the Severity or Squelching a Fault

Every APIC fault has a default severity. In some circumstances, a fault might be considered more or less severe than the default level. In some cases, you might want to ignore a particular fault and squelch (suppress) it from appearing in fault reports or status dashboards. APIC provides two locations from which you can change the severity of a fault type:

  • Directly from the Faults tab under a component in the APIC GUI

  • In a monitoring policy


Note

The option to directly change the severity or squelch a fault from a component Faults tab was introduced in Cisco APIC Release 3.2(1).


Changing Fault Severity or Squelching a Fault from the Faults Tab

In the Faults tab of an APIC GUI component, you can change the severity of a displayed fault or you can suppress (squelch) it altogether.


Tip

For squelching a fault, we recommend using this procedure instead of the procedure described in Changing Fault Severity or Squelching a Fault in the Monitoring Policy. This simple procedure eliminates the need to look up the fault code or the relevant monitoring category (Tenant, Fabric, or Access). We do recommend, however, that you remember which monitoring policy (by default, Tenant common, Fabric, or Access Monitoring default) is modified by the operation in case you want to unsquelch the fault type at a later time. The affected monitoring policy is displayed when you select the Ignore Fault action.


Procedure


Step 1

Navigate to the Faults tab that currently displays an instance of the fault.

Step 2

Choose one of the following actions:

  • To change the severity of these faults, right-click the row of the desired fault code, select Change Severity, select the desired severity level, and click Change Severity.
  • To prevent these faults from appearing in fault reports (squelching the fault), right-click the row of the desired fault code, select Ignore Fault, then click Ignore Fault.

With either of these actions, a dialog box appears in which you can confirm the selected action. In both cases, the dialog box displays the path to the Affected Monitoring Policy, which will be automatically modified as a result of the action. To undo the action later, you can navigate to this policy and manually modify it as described in Changing Fault Severity or Squelching a Fault in the Monitoring Policy.


This change will be applied for all faults with this fault code that occur as a result of the displayed Affected Monitoring Policy.

What to do next

When you squelch a fault code, a squelch policy is automatically created and added to a monitoring policy. If you want the faults to be raised and visible again, you must locate and delete that squelch policy. Depending on the monPolDn property of the parent MO, the auto-created fault squelch policy can be stored in the Fault Severity Assignment Policies under one of the following:

  • Tenants > common > Policies > Monitoring > default

  • Fabric > Access Policies > Policies > Monitoring > default

  • Fabric > Fabric Policies > Policies > Monitoring > default

If you have created and applied a non-default monitoring policy (not one of the four default policies mentioned above) to the parent MO that has the fault condition, you must access that non-default monitoring policy when you want to undo the squelch policy.

When you have located the squelch policy, follow the procedure in Changing Fault Severity or Squelching a Fault in the Monitoring Policy to delete the entry for the fault code or change the severity to a setting other than squelched.

Changing Fault Severity or Squelching a Fault in the Monitoring Policy

You can change the severity of a fault or suppress (squelch) it altogether by creating a fault severity assignment policy.

Before you begin

Determine the affected object class of the fault. Every fault code is associated with a managed object (MO) class on which the fault can be raised. To create a Fault Severity Assignment Policy for a specific fault, you must provide the affected object class of the fault. For a given fault code, refer to Researching a Fault to find the affected object class. In the fault properties reference descriptions, the affected object class of the fault is typically shown as the "Raised on MO" attribute or the "Mo Class" attribute.

For example, the affected object class of the fault code F0321 is infra:WiNode.

Procedure


Step 1

Navigate to the monitoring policy that is affected by the fault.

Common locations of monitoring policies are:

  • Tenants > common > Policies > Monitoring > default

  • Fabric > Access Policies > Policies > Monitoring > default

  • Fabric > Fabric Policies > Policies > Monitoring > default

Step 2

Expand the monitoring policy and select Fault Severity Assignment Policies.

Step 3

In the Work pane toolbar, click the Actions icon to open a drop-down list. Choose Modify Fault Severity Assignment Policies.

Step 4

In the Modify Fault Severity Assignment Policies dialog box, open the Monitoring Object drop-down list and find the object class associated with your fault code. If the desired object class does not appear, perform the following steps to add your object class to the drop-down list:

  1. Click the Edit (pencil) icon next to the Monitoring Object box to open the Add/Delete Monitoring Object dialog box.

  2. Use your platform's Find function to search for the desired object class.

    For example, use CTRL-F in Windows or ⌘-F in MacOS.

    Note 
    In the displayed list, a period and not a colon separates the package name and class name. Also, the list provides a descriptive name of the class. For example, the object class infra:WiNode appears in this list as Cluster Element (infra.WiNode).
  3. Check the Select checkbox next to the desired object class.

    Classes that already appear in the Monitoring Object list already have checkmarks. In this step, you can add a single class or multiple classes to the list.

  4. Click Submit to add your selection to the Monitoring Object drop-down list.

Step 5

From the Monitoring Object drop-down list, choose your desired object class.

Step 6

With your desired object class displayed in the Monitoring Object box, click + in the Monitoring Object toolbar to create a new fault severity assignment policy for the displayed object class.

A form row appears in the table.

Step 7

Select the desired fault code in the Code drop-down list.

Some object classes are associated with more than one fault code.

Step 8

Select the current severity level in the Initial Severity drop-down list.

Step 9

Select the desired severity level in the Target Severity drop-down list.

To prevent the fault from appearing in fault reports, select squelched. To restore a fault that was previously squelched, select a different severity level.

Step 10

(Optional) To make a notation about the change, you can add a comment in the Description text box.

Step 11

Click Update to create the policy. Close the Modify Fault Severity Assignment Policies dialog box.


Monitoring a Specific Object Class or Fault Code

To monitor faults remotely, create a monitoring source policy to send fault log messages to a Callhome, Smart Callhome, SNMP, Syslog, or TACACS remote monitoring server. In the monitoring source policy, you can narrow the scope of the fault reporting in three levels:

  • By default, a monitoring source policy sends fault log messages for all faults to the remote monitoring server.

  • You can configure the monitoring source policy to report only the faults (fault codes) belonging to a specific managed object (MO) class.

  • You can configure the monitoring source policy to report only a specific fault code.

To monitor a single fault code, you must configure a fault severity assignment policy in addition to the monitoring source policy. Follow the procedure described in Changing Fault Severity or Squelching a Fault in the Monitoring Policy to configure a fault severity assignment policy that specifies the fault code to be monitored. For this purpose, the policy doesn't change the fault severity or squelch the fault. The policy merely provides a means to associate the fault code with a monitoring source policy. In the fault severity assignment policy, choose 'inherit' as the initial severity and target severity to preserve the default severity of the fault. This policy is only necessary for monitoring a single fault code. It is not necessary for monitoring all faults of an object class, or for monitoring all faults entirely.

To create the monitoring source policy, follow the procedure described in Creating a Monitoring Source Policy for a Specific Object Class or Fault Code. Choose a reporting method, such as syslog, and configure the monitoring source policy for that method. Configure the monitoring object and scope for your desired level of monitoring:

  • To monitor an object class, select the object class as the monitoring object and set the scope to 'all.'

  • To monitor a specific fault code, select the associated object class as the monitoring object, set the scope to 'specific fault,' and select the fault code.

To monitor multiple specific fault codes, you must configure a separate monitoring source policy for each fault code. In addition, each fault code must be represented by a separate fault severity assignment policy.

Creating a Monitoring Source Policy for a Specific Object Class or Fault Code

This example procedure describes how to create a syslog monitoring source policy for reporting instances of a single fault code or all faults raised on a single object class.


Note

Other available monitoring source types in addition to syslog include Callhome, Smart Callhome, SNMP, and TACACS. This example procedure describes only the configuration of a syslog monitoring source. Refer to other Cisco APIC documentation for configuring other monitoring source types.

Before you begin

  • Create a Fault Severity Assignment Policy for the specific fault to be reported by this monitoring source policy. When monitoring all faults of an object class, this step is not necessary.

  • Choose a monitoring source type, such as Callhome, Smart Callhome, SNMP, Syslog, or TACACS.

  • Create a compatible destination group for receiving the monitoring messages.

  • Verify that no other monitoring sources of the same type are configured under any Monitoring Policy folder, such as for any tenants or fabric. For example, if you configure a syslog source for a specific fault code while another syslog source is configured for 'ALL' object classes or for all faults of an object class, you might receive messages for other fault codes.

Procedure


Step 1

Navigate to Fabric > Fabric Policies > Policies > Monitoring > default > Callhome/Smart Callhome/SNMP/Syslog/TACACS.

Step 2

From the Source Type controls, click the desired type.

For this example, we use Syslog as the Source Type.

Step 3

From the Monitoring Object drop-down list, choose the object class that you want to monitor or that is associated with your fault code.

For a specific fault, choose the object class you used in Changing Fault Severity or Squelching a Fault in the Monitoring Policy.

Step 4

Choose one of the following actions:

  • To monitor an object class, select 'all' from the Scope controls.
  • To monitor a specific fault, select 'specific fault' from the Scope controls, and choose your fault code in the Fault drop-down list.

Some object classes are associated with more than one fault code.

Step 5

At the far right edge of the grey bar immediately above the policy table, click + to create a monitoring source for the displayed Monitoring Object.

Step 6

In the Create Syslog Source dialog box, perform the following steps to configure the monitoring source:

Note 
For source types other than syslog, the configuration steps might be different.
  1. Type a Name for the source.

  2. For Min Severity, choose the default severity level of the object class you are monitoring.

    You can find the default severity level in the same source from which you found the associated object class.

  3. For Include, check Faults.

  4. For Dest Group, choose the destination group that will receive the monitoring messages.

  5. Click Submit.

Step 7

To monitor additional object classes or fault codes, you must repeat these steps to create an additional syslog monitoring source policy for each object class or fault code.

If the additional fault code is associated with the same monitoring object class, you need only repeat from Step 4. If the additional fault code is associated with a different monitoring object class, repeat from Step 3. In addition, each fault code must be represented by a separate fault severity assignment policy.