- Visibility using FireSIGHT
- FirePOWER Intrusion Event Monitoring
- FirePOWER Malware Event Tracking
- Integrating Intrusion and Malware Events from FirePOWER Appliances into Cisco CTD
- Integrating Generated NetFlow Records from Nexus 7000 Switches into Cisco CTD
- Integrating Generated NetFlow Records from ASA into Cisco CTD
End-to-End Visibility
One of the main challenges facing internal network security is providing visibility of data streams flowing through every part of a network. Because there is simply no central location where data can be gathered, visibility by its nature operates on a distributed paradigm. An effective solution must be able to collect data from the entire network, then translate and interpret the collected information in a way that maximizes threat detection.
Within this solution, visibility is achieved by implementing Cisco CTD, FirePower appliance, Splunk and NGA. Table 4-1 shows the different roles of these components that facilitate end-to-end visibility.
|
|
|
|
|---|---|---|
Visibility using FireSIGHT
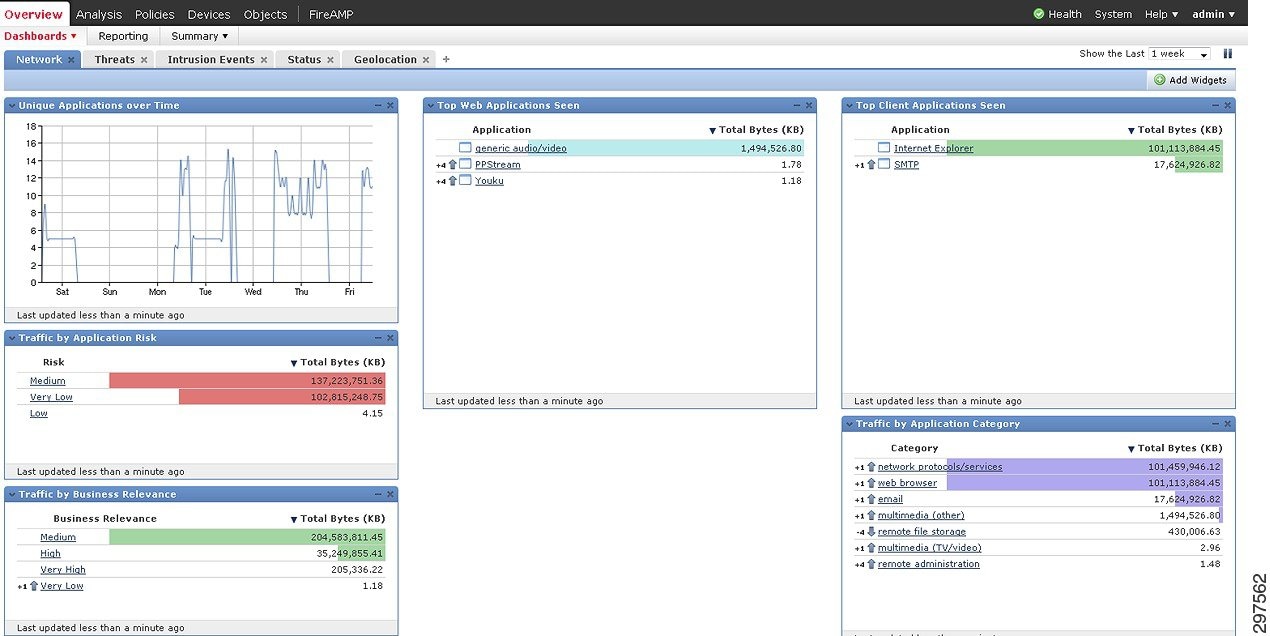
FirePOWER can be configured to detect security threats using various network objects. Configured FirePOWER appliances, report top web and client applications and can help detect threats that hide in obscure applications. Tracking unique applications over time, and traffic applications by risk, can also help detect attacks, as shown in Figure 4-1.
Figure 4-1 FirePOWER Network Monitoring
FirePOWER Intrusion Event Monitoring
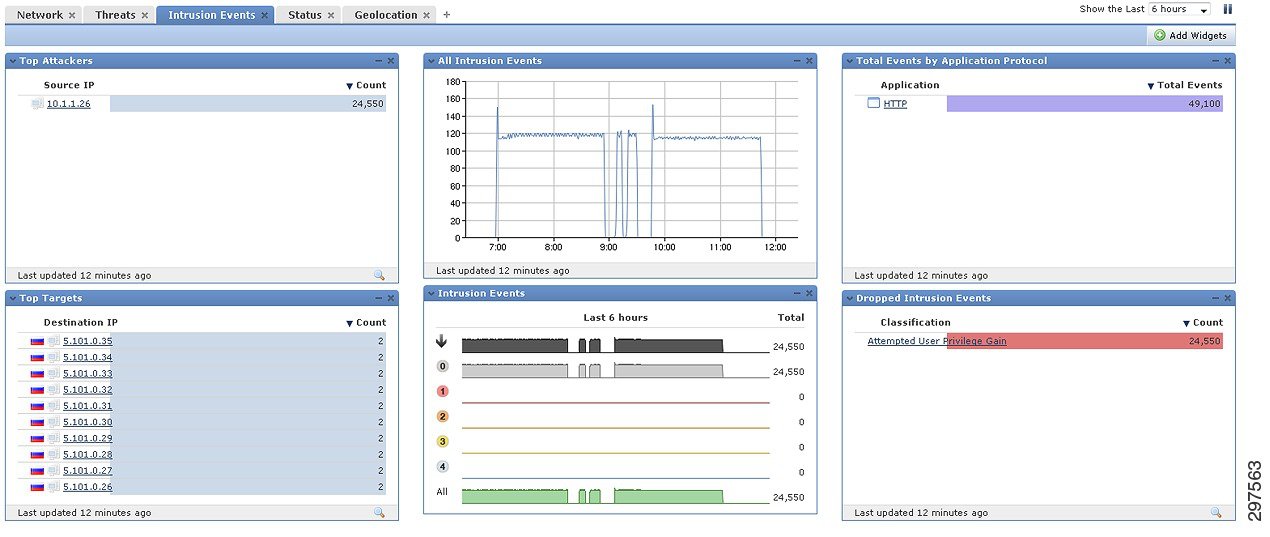
Intrusion monitoring of over time provides information about dropped intrusion events, top targets and attackers, and total events by application protocol. This information can be used to mitigate and prevents intrusion events over time (Figure 4-2).
Figure 4-2 FirePOWER Intrusion Event Monitoring
FirePOWER Malware Event Tracking
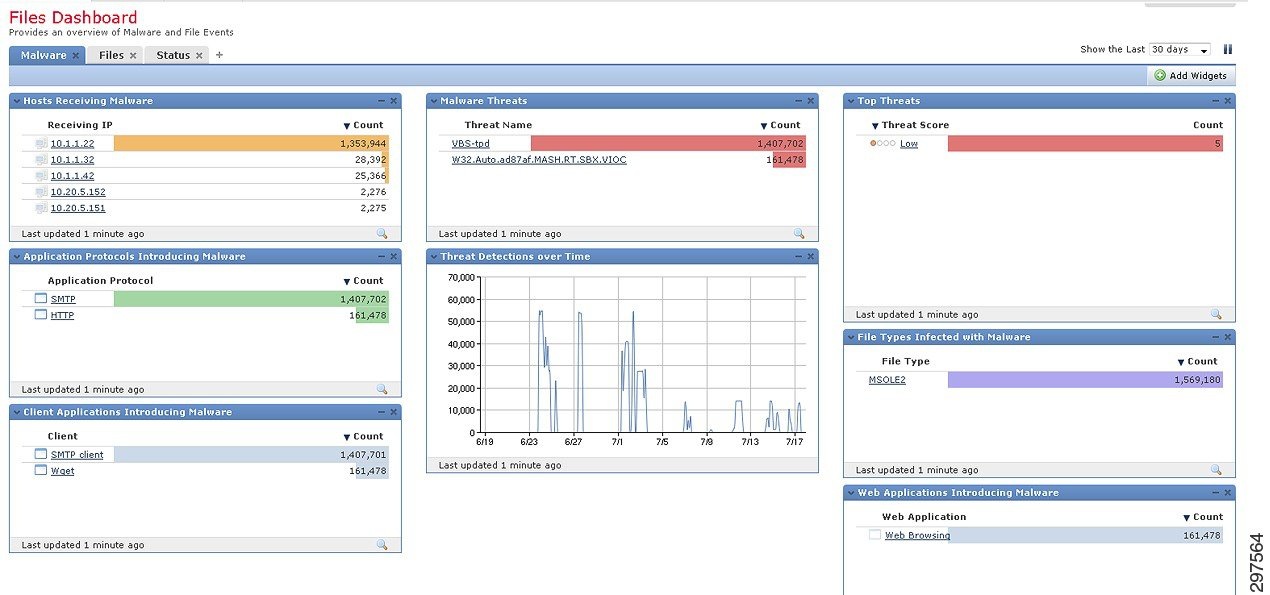
FirePOWER can be configured to display malware files, examined and captured files, and network file trajectories. Tracking malware enables quick responses to malware in the data center (Figure 4-3).
Figure 4-3 FirePOWER Malware Event Tracking
Integrating Intrusion and Malware Events from FirePOWER Appliances into Cisco CTD
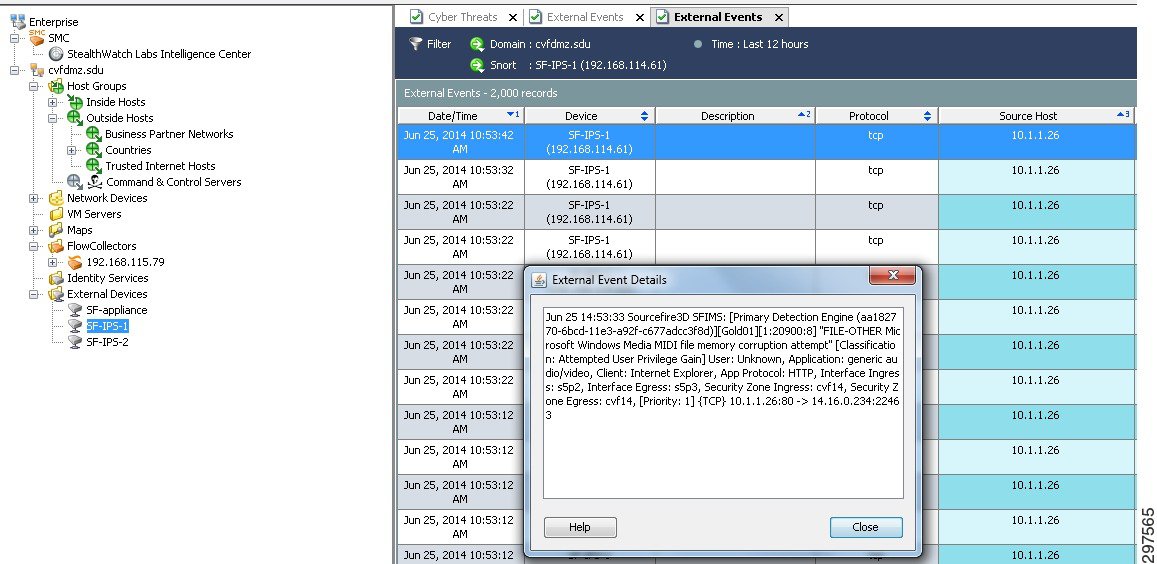
FirePOWER appliances can be configured to generate Syslog messages when detecting intrusion and malware events. These Syslog messages can be forwarded to Splunk log management and Cisco CTD. Cisco CTD will translate these syslog messages and integrate those events within its own database.
FirePOWER and Cisco CTD integration provides a more complete, unified view of the network. As shown in Figure 4-4, FirePOWER events are shown under external devices, within SMC’s dashboard, where intrusion events are populated and linked under a FirePOWER NGIPS appliance.
Figure 4-4 FirePOWER NGIPS Events in Cisco CTD
Integrating Generated NetFlow Records from Nexus 7000 Switches into Cisco CTD
High traffic rates for Nexus 7000 switches can result in the generation of NetFlow records that can put high loads on the switch CPU. To reduce Nexus 7000 CPU loads, NGA offloads the processing needed to generate NetFlow records. As shown in Figure 4-5, Nexus 7000 traffic is spanned to NGA, which converts raw traffic flows to NetFlow records. The records are then forwarded to the NetFlow collector in Cisco CTD.
As mentioned previously, NGA has four physical ports that receive data from various appliances. In this solution, two ports receive spanned data from the two Nexus 7000 aggregation switches. Optionally, the other two ports can receive data from the Nexus 5540 access switches. NGA can be configured to export a variety of NetFlow Version 9 record fields, as shown in Figure 4-5.
Figure 4-5 NetFlow Version 9 Record Fields Exported by NGA
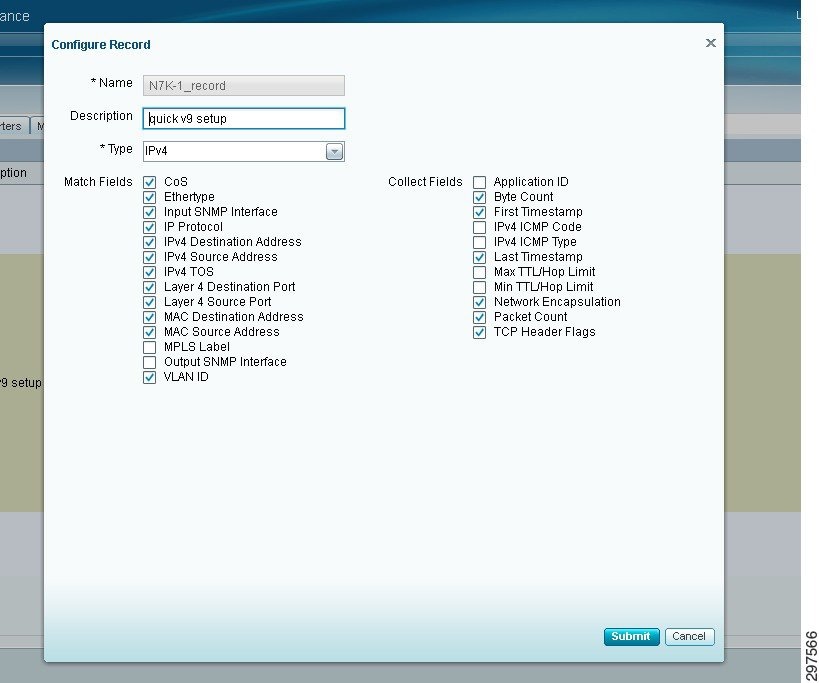

Note![]() Configure MAC-address fields only if managed device settings are configured. Refer to http://www.cisco.com/c/en/us/td/docs/net_mgmt/netflow_generation/1-0/user/guide/NetFlow_Generation_UG/getstarted.html#wp1134717 for details.
Configure MAC-address fields only if managed device settings are configured. Refer to http://www.cisco.com/c/en/us/td/docs/net_mgmt/netflow_generation/1-0/user/guide/NetFlow_Generation_UG/getstarted.html#wp1134717 for details.
Integrating Generated NetFlow Records from ASA into Cisco CTD
As mentioned previously, unlike standard NetFlow, NSEL provides a stateful flow tracking mechanism that exports only those records that indicate significant events in an IP flow. NSEL events export data about flow status, and are triggered by the events that cause the state changes, rather than by activity timers as in standard NetFlow.
ASA (through NSEL) currently reports on the following event types:
The following highlights differences between NSEL and standard NetFlow:
- NSEL is bidirectional and sends one flow record per connection; other connections through Cisco IOS devices generate two flows per connection (one for each direction).
- NSEL report a total byte count for each bidirectional flow, rather than a byte count for each direction.
- NSEL does not report packet counts.
- NSEL has a predefined template for each reported event types; these templates are usually exported before any NSEL data records.
- NSEL flow-export actions are not supported in interface-based policies; flow-export actions can be applied only in a global service policy.
In NSEL records, information about reported events is transported in fields inside NSEL records. Cisco CTD’s StealthWatch management dashboard interprets the fields and defines them as Flow Actions, as shown in Figure 4-6. If a flow is permitted through the firewall (indicated by flow-created and teardown events), the Flow Action field shows Permitted; if a flow is blocked by a firewall access control list (ACL), the Flow Action field shows Denied.
Figure 4-6 Viewing Flow Action Fields in Received NSEL Flows
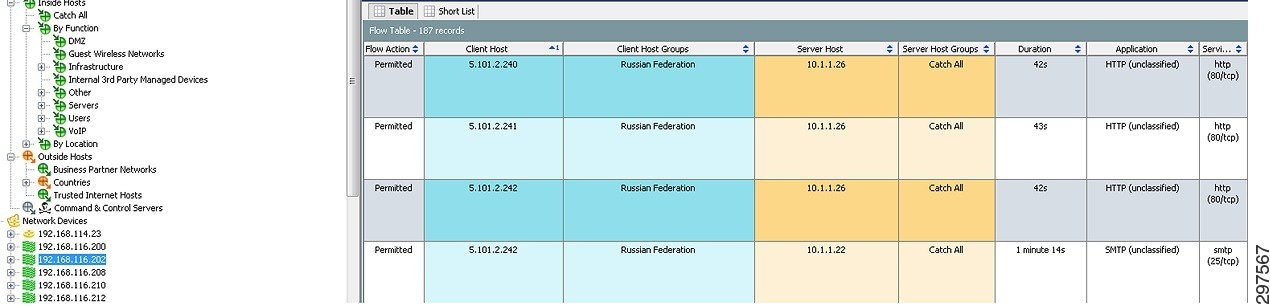
The context provided by the Flow Action fields is considered by behavioral algorithms in StealthWatch, so the Flow Denied action can provide a useful inspection point to run queries and to identify suspicious activity, such as scanning and distributed denial of service (DDOS) attacks.
Tracking Events, and Threat Analysis using Splunk
From a security perspective Splunk supports a forensics approach to security event management. Looking for patterns in log data from Cisco and other security devices and viewing them in context of other data provides a comprehensive view of what's happening across an IT infrastructure. Using Splunk, the security team can harness their knowledge to model attack vectors and attack patterns based on conditions which Splunk can easily identify. As shown in this section, Splunk provides additional context to security events by connecting to external sources of data and pulling this data into generated reports or within a dashboard interface. Augmenting security data with information from other sources can help decrease response times.
Once a search across data sources is constructed, the user can save, run, and send the search results and graphical reports to others in PDF format on a scheduled basis or used to display results on a real-time dashboard. As shown below. network appliances and security devices export events and log information to Splunk.
Figure 4-7 shows the aggregation of network and security events using Splunk.
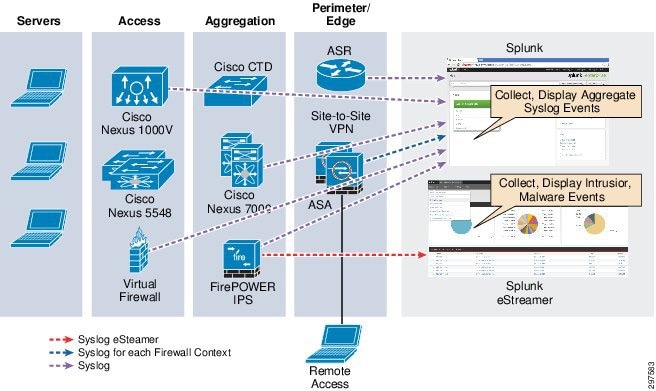
When deploying Splunk, note that:
- Each ASA context should be configured as a Syslog exporter. This enables ASA event tracking on a per-tenant basis.
- Cisco CTD can be configured to export Syslog records to Splunk and other appliances, such as FirePOWER.
- FirePOWER can be configured to send Syslog messages for intrusion events, malware events, and correlation events. Connection events can also be sent to Syslog servers on a per-tenant basis.
- Splunk can aggregate security and syslog events from network devices, including Nexus7000 Series switches, Nexus 5000 Series switches, Nexus 1000V virtual switches, and ASA, to provide a unified view of events in the network as shown below in Figure 4-8.
Figure 4-8 Event Aggregation in Splunk
Tracking Events using eStreamer
The eStreamer Splunk is a community* created application that can track intrusion events, file and malware events, flow logs, correlation, and security intelligence events, in a real-time dashboard, from FirePOWER appliances, as shown in Figure 4-9.
Note![]() Estreamer is a community created tool that is leveraged in this solution. It is not an officially supported application by Cisco Systems, for more information on installation and the application itself refer to https://support.FirePOWER.com/downloads/1533/fetch. and http://apps.splunk.com/app/1629/.
Estreamer is a community created tool that is leveraged in this solution. It is not an officially supported application by Cisco Systems, for more information on installation and the application itself refer to https://support.FirePOWER.com/downloads/1533/fetch. and http://apps.splunk.com/app/1629/.
Figure 4-9 eStreamer Event Tracking

When deploying eStreamer, note that:
- A separate Splunk instance must be deployed to host an eStreamer application. In this solution, the FireSIGHT Management ConsolBotnetorwards event information to eStreamer application.
- It is possible to forward events directly from IPS appliances to eStreamer application. This requires deploying additional Splunk instances for each appliance.
- FirePOWER can be configured to forward Intrusion and Malware events to eStreamer and other events to another Splunk instance that is used for central log management.
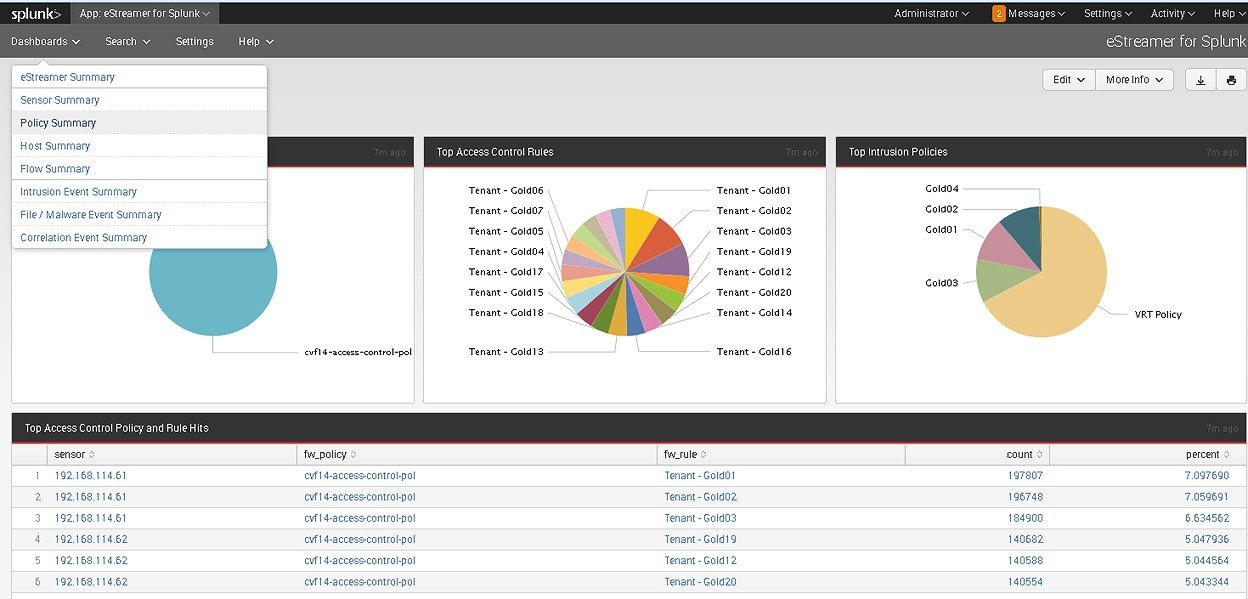
The eStreamer dashboard enables security personnel to zoom in to particular Syslog message categories after possible anomalies or attacks are identified and obtain highly detailed event information from the logs. For example, as shown in Figure 4-10, you can zoom in to a policy summary in the dashboard and get a visual indication of policy-change events for different tenants over time. For example a spike in policy change events can indicate unauthorized access and tampering within the FirePOWER policy configuration.
Figure 4-10 displays access control policy and intrusion policy changes in the FirePOWER policy engine.
Figure 4-10 Aggregating policy events from FirePOWER using eStreamer Application
Event Correlation and Data Analysis
This section describes methods and a framework to correlate and prevent attacks using security components in the Virtualized Multiservice Data Center ( VMDC) Cloud Security solution.
Note![]() Full descriptions of them feature-rich solution components are beyond the scope of this document.
Full descriptions of them feature-rich solution components are beyond the scope of this document.
FirePOWER network security appliances and Cisco Cyber Threat Defense (CTD) provide complementary functions that can assist in effective event correlation and attack prevention. Table 4-2 and Table 4-3 compare the FirePOWER network security appliances and Cisco CTD.
|
|
|
|
|---|---|---|
Detecting Botnets
Botnets comprise distributed software that collectively performs malicious actions as dictated by a master server that controls the botnet. Botnets are installed on numerous computers using infected emails, web downloads, and Trojan horses. A botnet consist of two components: one or more infected bots and one or more botnet controllers.
A bot is a host that was compromised using a software tool kit that enables remote hacker control over useful host resources. A botnet server is software that collects information from the bots under its control. Botnet servers use the computing power of the bots under its control to carry out malicious acts, such as distributed denial of service (DDOS) attacks, sending spam, and stealing sensitive data.
A botnet server periodically communicates with the infected bots through a unidirectional data flow-from bots to server. Usually, the server passively collects information from the bots without responding, and waits for an opportune moment to simultaneously activate the bots.
The VMDC Cloud Security 1.0 solution uses the following methods to detect botnets.
Detecting Botnets Using FirePOWER Security Intelligence Events
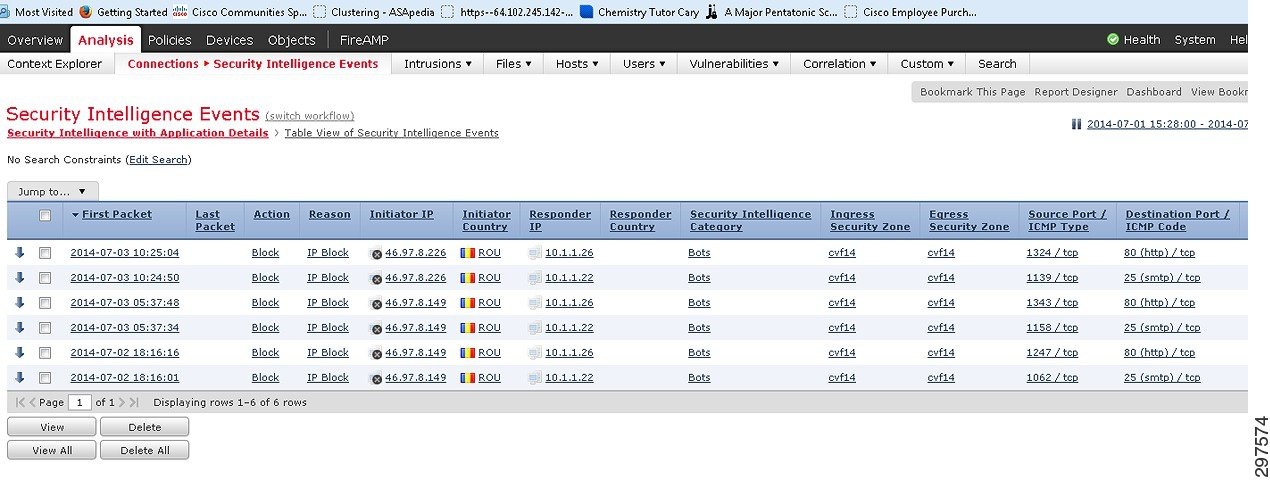
FirePOWER can automatically detect botnets using its cloud-lookup security intelligence capabilities. To blacklist botnet servers, FirePOWER compares originating flow IP addresses with a list of known botnet servers. Figure 4-11 shows a list of blocked bot connections viewed under Connections > Security Intelligence Events.
Figure 4-11 Detected Botnets in FirePOWER Security Intelligence Events
Cisco CTD Beacon Host Detection
In general, botnets communicate from “inside” to “outside.” A beaconing host has an inside-to-outside communication flow that exceeds certain parameters, such a connection time. Cisco CTD generates an alert when it detects suspicious communication channels of that may be botnets.
By default, Cisco CTD trigger alarms when it detects beaconing hosts and changes the display coloring of the host from green to orange in the internal host-group navigation tree.
After a FirePOWER appliance or the Cisco CTD detects a botnet, it is imperative to determine whether additional internal hosts are infected. The target host IP address can be determined from FirePOWER connection events (shown in Figure 4-11), or by viewing the host IP address in the Cisco CTD botnet pane under the Cyber Detection Dashboard. Determining other possible infected host can be done by viewing the flow-table on the Cisco CTD of the host.
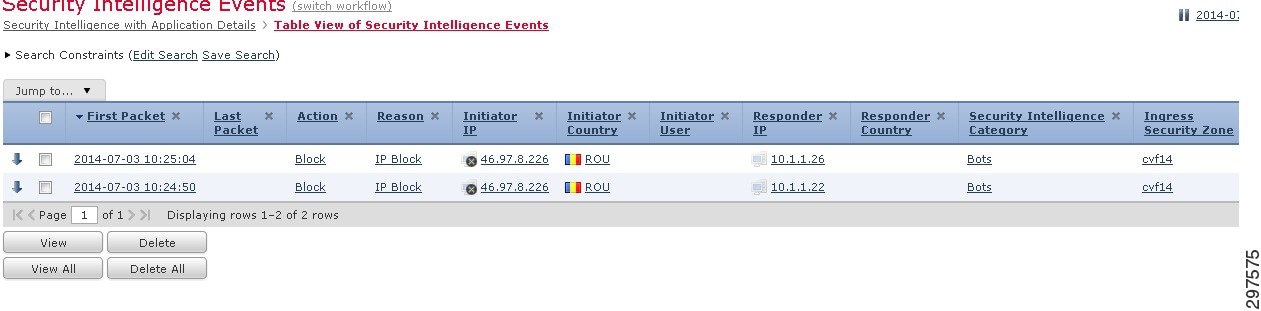
In addition the connection table within FirePOWER can be leveraged to see what other hosts the command center has tried to communicate with. Figure 4-12 shows a botnet server trying to communicate with two internal hosts.
Figure 4-12 Host Activities View
Detecting Data Loss
Data loss describes the loss of critical business data to unauthorized users. Data loss typically involves a data breach and back end transmission of sensitive data such as credit-card data, patient or financial information. Detecting data loss is imperative for implementing security controls for various compliance regimes such as PCI DSS and HIPAA. However, data loss incidents are unintentionally undetectable.
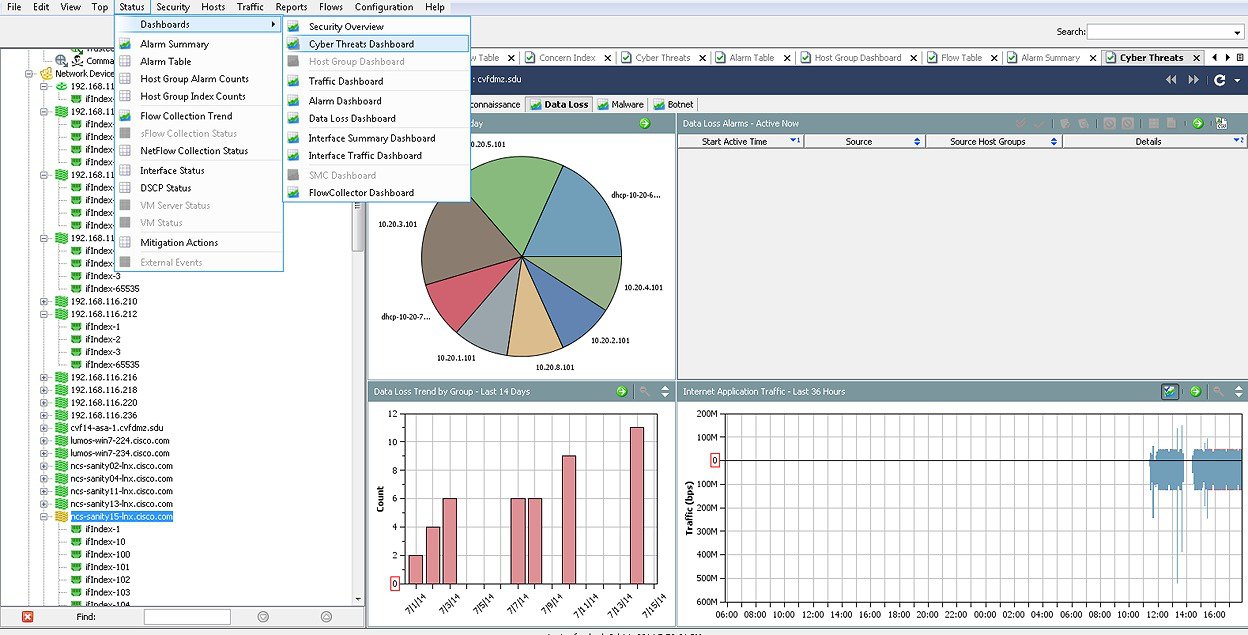
Data loss incidents normally involve asymmetrical outbound flows, in which outbound flows significantly outweigh a few inbound packets. Cisco CTD can trigger data loss alarms on such conditions. NetFlow generated flows contain flow direction, so Cisco CTD can leverage NetFlow generated flows and trigger data loss alarms on asymmetrical flows. Data loss events can be viewed using the data loss pane of the Cyber Threats Dashboard, as shown in Figure 4-13.
Figure 4-13 Detected Data Loss
To effectively detect data loss traffic flows, Cisco CTD captures and analyzes historical data about network flows, and uses the data to create a baseline for the network. Baselining can be performed on host groups, which are often defined by IP address ranges and can have descriptions such as Tenant-x-Servers. Cisco CTD creates behavior profiles of all hosts and tracks several for flows to the hosts many days. Cisco CTD continually monitors flows and compares them to baseline parameters to determine whether data loss event has occurred.
For more information about configuring Cisco CTD to detect data loss, refer to http://www.cisco.com/c/dam/en/us/solutions/collateral/enterprise-networks/threat-defense/detecting_data_loss_with_cyber.pdf.
After a host is identified as a suspect in a data loss event, the connection table in FirePOWER or the flow table in Cisco CTD can provide more information about the receiving node or other potential suspects in the internal hosts.
Detecting DDOS Attacks Using NSEL and Cisco CTD
NSEL uses stateful records and indicates which host initiates a flow, it is easy to distinguish clients and servers. This characteristic makes NSEL an effective tool for detecting DDOS attacks.
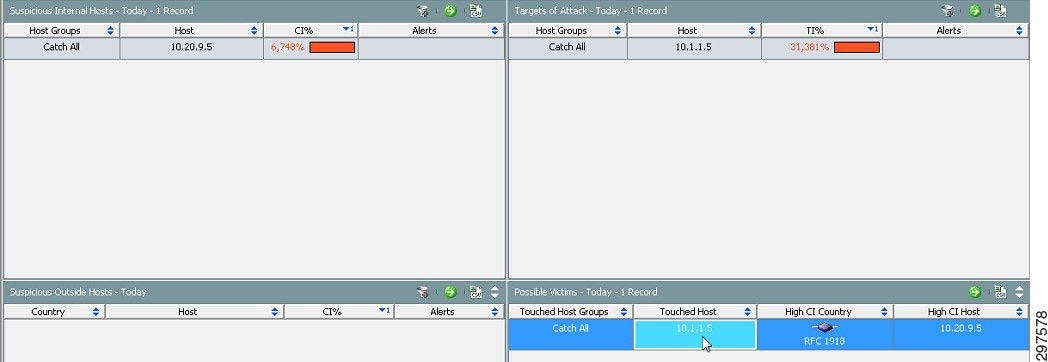
ASA generates NSEL records for significant flow events (flow created, flow denied, and flow tear down). This information is sent to Cisco CTD in fields in the NSEL record. Cisco CTD’s StealthWatch management dashboard interprets the fields and defines them in a flow action field. StealthWatch then uses the flow action field context in its behavior algorithm to generate a concern index (CI) for each flow. During DDOS attacks, high CI values are generated along with an alarm indicating an attack. As shown in Figure 4-14, one can use the CI Dashboard in StealthWatch to characterize the incoming attack for a given host.
Figure 4-14 Monitoring High CI Events to Detect DDOS Attacks

Because the byte count reported by NSEL represents data moving in both directions, it is difficult to separate how much data was uploaded or downloaded. Additionally, NSEL does not report packet counts, may hinder efforts to detect DDOS attacks using only NSEL data. Because NGA can intercepts north-south traffic, NGA exports traditional NetFlow to Cisco CTD for the same flows as NSEL. NGA can provide the missing timeout, packet, and byte data to complement ASA. This ensures complete flow visibility while maintaining unique context advantages delivered by NSEL.
Detecting Reconnaissance Activities Using NSEL and Cisco CTD
The presence of network reconnaissance is one of the earliest indicators of an impending attack. The ability to detect reconnaissance early in the threat lifecycle is a critical part of a strong of a security framework. However, detecting reconnaissance inside the network perimeter is particularly challenging.
As in DDOS attacks, StealthWatch combines NSEL and NetFlow records from NGA to detect reconnaissance activities. For example, a device performing reconnaissance typically generates a large number of Address Resolution Protocol (ARP) requests but receives few responses. Other reconnaissance attacks generate illegal flag conditions such as SYN/FIN. In most cases, Cisco CTD can recognize these patterns to complement threat detection by appliances such as FirePOWER.
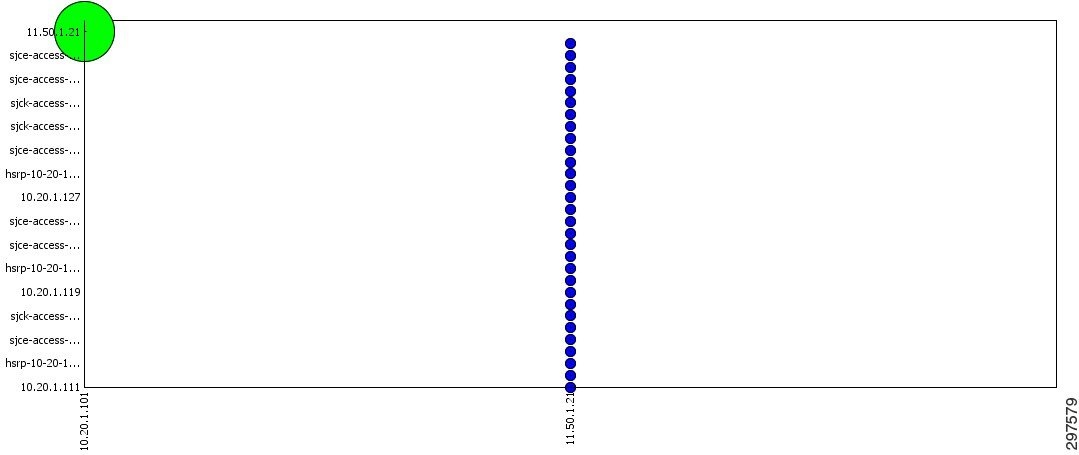
Cisco CTD’s StealthWatch generates an alarm for high CI for a given host, providing an indication of scanning as shown in Figure 4-15.
Figure 4-15 Internal Host Scanning Indication
After determining the suspicious flow, by viewing the top active host for that flow, one may discern a high variance of destination IP addresses that uses “strange ports.” In addition, by viewing the “Peer vs. Peer” and “Peer vs Port” views in the flow table display, one can view host activities during a specified time period. The “Peer vs Peer” view generates a table that maps internal hosts to IP addresses they communicated with, and “Peer vs Port” view generates a table, mapping the nodes and the ports they communicated with. Hosts that communicate with a wide range of receivers or a wide range of ports can be considered suspicious, as shown in Figure 4-16.
Figure 4-16 Peer-to-Peer View Scanning Indication
 Feedback