Test Plan
The testing focused on stressing out various aspects of the OpenStack control plane. Each test case was built to focus stress into one aspect of control plane. Some tests cases are meant to stress the system to points of noticeable system degradation and even break points. Other tests are meant to reveal trends at lower scales that can be extrapolated to theoretical system maximums and break points. Table 2-1 gives details of each test case.
Test Results
The following use cases were tested.
Test Case 1
To determine the number of idle computes a single controller can handle.
RabbitMQ is a central component in OpenStack that enables interoperability between all the other components. Considering this, RabbitMQ was identified as a possible bottleneck. It was monitored using the RabbitMQ management plugin. Additional compute nodes were added simultaneously to the controller. During this process, RabbitMQ parameters such as number of Socket Descriptors (SD), File Descriptors (FD), Number of Erlang Processes running (ER) and the amount of memory being used were measured. By default, RabbitMQ sets an upper limit on these parameters. The tests were conducted on a specific set of hardware and the trend was observed. These observations were extrapolated further to identify the bottleneck when the system scales.
- The number of SD and FD increased steadily with the addition of each compute.
- The number of SD created for 9 computes was 80. The default maximum number of SDs was 862.
- The number of FD created for 9 computes was 101. The default maximum number of FDs was 1024.
Figure 2-1, Figure 2-2, and Figure 2-3show actual variance of SD, FD and ER for addition of 9 compute nodes.
Figure 2-1 shows the effect of increasing number of computes vs. number of RabbitMQ Socket Descriptors. [X-axis = No of computes; Y-axis = No of Socket Descriptors].
Figure 2-1 Actual Variance of SD
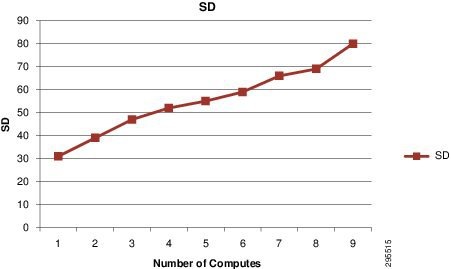
Figure 2-2 shows the effect of increasing number of computes vs. number of RabbitMQ File [X-axis = No of computes; Y-axis = No of File Descriptors].
Figure 2-2 Actual Variance of FD
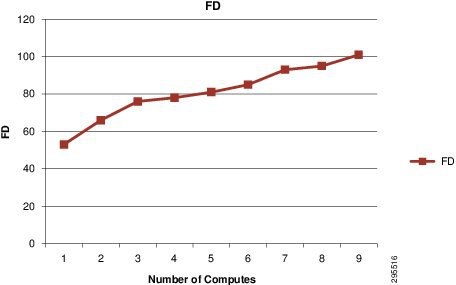
Figure 2-3 shows the numbers obtained from the result was extrapolated to determine the point at which RabbitMQ would fail to add any more nodes.
Figure 2-3 Actual Variance of ER
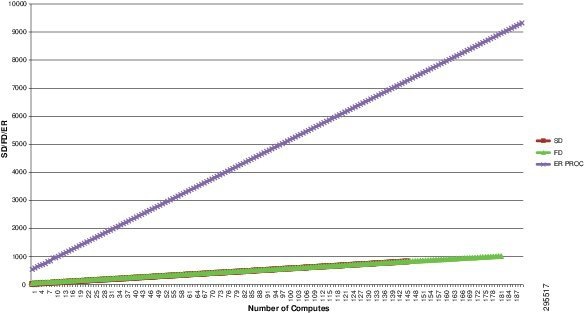
- Upon extrapolating these numbers the number of socket descriptors seemed to be the limiting factor since the upper limit of 862 (theoretical projection) was reached.
- Assuming that the system behaves similarly under higher loads the number of computes that can be managed is 148 (theoretical projection).
- However in this case, the compute nodes were idle. In a scenario where VMs are running on computes, this number may vary (as covered in test case2).
- The upper limit on these parameters can be configured by editing the file “/etc/security/limits.conf” .
Test Case 2
To determine the number of computes a single controller can handle, if the computes are loaded with a constant number of VMs.
The execution method and the parameters measured remain the same as in test case 1. However, each compute is loaded with 20 Ubuntu VMs.
- With the additional load on each compute, the total number of socket descriptors and file descriptors increased linearly.
- The number of SD created for 9 computes was 406.
- The number of FD created for 9 computes was 448.
- However, it can be observed that the number of socket descriptors used per compute went up quite sharply.
Figure 2-4 shows the number of socket and file descriptors vs. number of compute nodes [X-axis: No of compute nodes; Y–axis: No of socket/file descriptors.
Figure 2-4 Number of Socket and File descriptors vs. Number of Computers
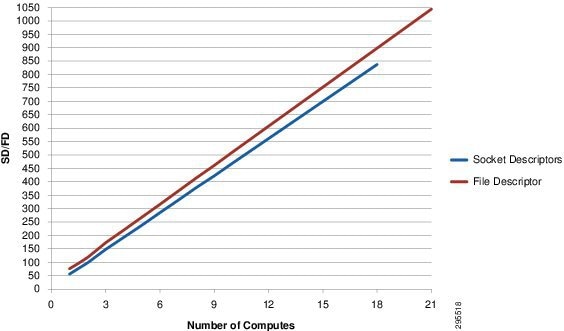
- With increase in load on each compute the total number of computes that can be managed by a single controller comes down significantly.
- Based on the observed results, socket descriptor count seemed to be the limiting factor.
- Upon extrapolating the results, the number of computes (with 20 VMs) that can be managed by a controller was around 18. (theoretical projection).
- However, these scaled numbers are purely theoretical projections, and the exact number might vary due to resource optimizations built into RabbitMQ that can get triggered under stressed conditions.
Test Case 3
To stress a single compute and identify the maximum number of VMs that could be provisioned on it. Also, by doing this exercise, create a baseline for evaluating other related test cases.
Rally and a script using the ‘vmstat’ tool were used to complete this experiment.
Rally was used to provision VMs on an AIO. The following parameters were measured while running the test cases.
1.![]() The number of VMs provisioned successfully / with error.
The number of VMs provisioned successfully / with error.
2.![]() The time taken by VMs to power up.
The time taken by VMs to power up.
3.![]() The system’s vital stats at regular intervals, as reported by the command ‘vmstat'.
The system’s vital stats at regular intervals, as reported by the command ‘vmstat'.
Graphs were plotted based on these measurements and further inferences were deduced.
- Maximum number of VMs of flavor 1(512MB) provisioned using Cirros image: 376.
- Maximum number of VMs of flavor 2(1GB) provisioned using Ubuntu image: 94.
- Provisioning time required for each VM increases nominally as the number of VMs on compute increases.
- However, an actual utilization of only about 58GB was observed while running 94 Ubuntu VMs.
- A maximum of 482 VMs could be provisioned with an over-commit of 2.0 using flavor 1 Cirros image. The same experiment when repeated using flavor 2 Ubuntu image, yielded a number of 202.
Figure 2-5 shows available RAM in the host vs. Number of VMs on the node. [X-axis: no of VMs; Y-axis: Available RAM].
Figure 2-5 Available RAM vs Number of VMs
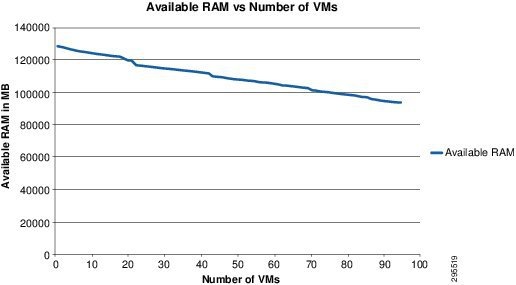
Figure 2-6 shows time taken to provision each VM vs. Number of VMs. [X-axis: No of VMs; Y-axis: Time taken to provision each VM].
Figure 2-6 Time Taken to Provision each VM vs Number of VMs
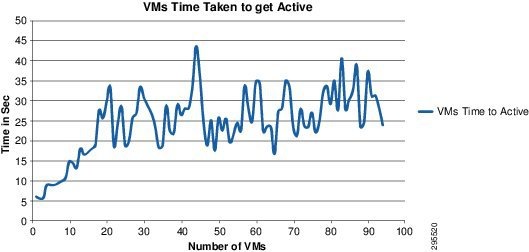
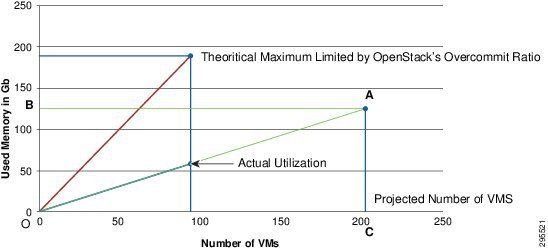
Figure 2-7 shows the amount of memory used by idle Ubuntu VMs [Triangle AOC] and the amount of memory remaining on the host that can be used by the applications running on these VMs [Triangle AOB]. It also shows the maximum number of idle Ubuntu VMs the host can support [point A: 202] given there is no upper limit on the RAM over-commit.
Inferences—What it would mean to user.
- Number of VMs that can be provisioned by OpenStack can be calculated mathematically.
- In this case, the system had a RAM capacity of 125 GB and a default over commit ratio of 1.5. Hence a total memory of 125x1.5=188 GB was available for OpenStack to utilize.
- OpenStack could provision 94 VMs of 2GB each or 47 VMs of 4GB each.
- Beyond 94 VMs, even if the hardware is capable, OpenStack does not allow anymore VM provisioning and the requests return an error ‘Failed to get the resource due to invalid status’, unless the ram_overcommit_ratio is increased.
- Minor performance tweaks can be employed and the use of various filters in the default filter scheduler. However, a custom scheduler driver can be implemented if further intelligence needs to be built-in to restrict utilization based on other parameters such as storage, vcpus etc.
- The difference between the RAM allocated by OpenStack and the actual RAM usage would give us the amount of RAM available for the user applications running over the cloud. i.e., in this case, 125-58=67GB of RAM.
- Time taken by VM to become active increases as the number of VMs increases.
Test Case 4
To analyze the time taken by the API, Scheduler and for a VM to power up, when Nova-API is under stress.
The test environment remains the same as in test case 3. However, a series of API operations such as create, start, stop and delete were performed during provisioning of VMs in order to increase the utilization of Nova API server. The VMs are deleted after the cycle of API operations in order to maximize the number of API requests per VM.
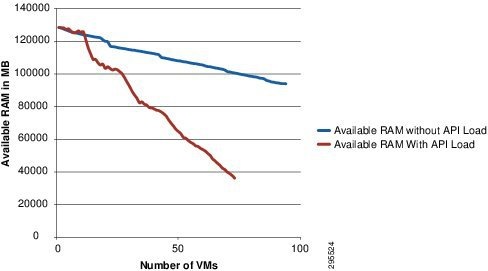
A similar test was executed while provisioning Ubuntu VMs and the memory utilization was compared with Test case 3 results (Figure 2-9).
- No of tenants: 20
- No of users per tenant: 1
- No of active users: 20
- No of API operations: 12 per VM (10 stop/start + create + delete)
- Maximum number of VMs of flavor 1(512MB) provisioned using Cirros image: 376
- Initially, time taken by first 20 VMs to power up was more since VM creation waits for actual image transfer before it is cached.
- Since at any given time the number of active VMs does not exceed 50, the VM power up time (after first 20) remained fairly constant.
- Similar trend was observed in the time taken by API server and Scheduler (Figure 2-9).
- However, Nova-API could not be maxed out during the test; no VMs went into error state and no provisioning requests were lost.
Figure 2-8 shows the time taken (for VM power-up) vs. number of Cirros VMs. [X-axis: Number of VMs; Y-axis: Time in Seconds].
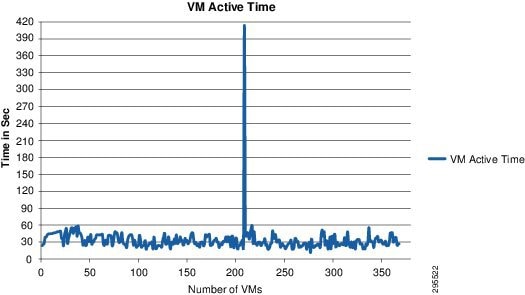
Figure 2-9 shows the time taken by API & Scheduler vs. number of Cirros VMs. [X-axis: Number of VMs; Y-axis: Time in Seconds].
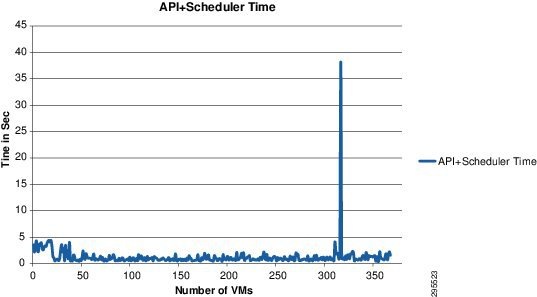
Figure 2-10 shows the changes in available RAM vs. number of Ubuntu VMs. This depicts the effect of increased API and VM control operations on the available RAM of the host. [X-axis: Number of VMs; Y-axis: Available RAM on the host].
Figure 2-10 Change in Available RAM vs Number of VMs
- High number of API operations would affect the response time for various operations such as create, start, stop of a VM.
- This can serve as a guideline for deciding the total number of VMs to be hosted, in case of strict SLA on VM power up time.
- Frequent multiple control operations on VMs will increase the host memory utilization. Hence system administrator can plan accordingly with additional buffer host memory.
- No requests were lost when 368 VMs with 12 API operations (10 stop/start + creation and deletion) were provisioned. Hence, Nova API can comfortably handle a load of 4536 control requests in 66 minutes, at an average of 68.72 API requests per minute.
Test Case 5
To determine the effect of increasing the number of tenants, users and active parallel users on a system and study its impact on Nova API server, Keystone and the database.
Rally was used to provision VMs. Multiple test runs were performed by changing the rally configurations to increase the number of tenants and number of active users. The attributes measured were:
1.![]() Number of successful provisions, number in error & build state.
Number of successful provisions, number in error & build state.
2.![]() Number of VM requests that were missed by the API server (Failed to service).
Number of VM requests that were missed by the API server (Failed to service).
3.![]() Minimum, Average and Maximum time taken by VMs to power up.
Minimum, Average and Maximum time taken by VMs to power up.
- No of tenants: 20,35,40,45,75,100
- No of users per tenant: 1
- No of active users: 20,35,40,45,75,100
- Total number of Users: 20,35,40,45,75,100
The total number of users ranged from 20 (20 tenants x 1 user) to 100.
- No of tenants: 20,50,75,100
- No of users per tenant: 10
- No of active users: 20,50,75,100
- Total no of Users: 200,500,750,1000
The total number of users ranged from 200 (20 tenants x 10 users) to 1000.
- Number of VMs going to Error state increased as the number of active parallel users increased.
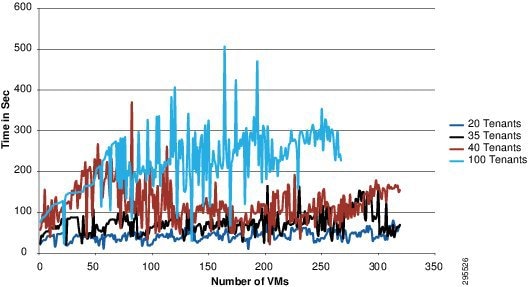
- As number of VMs increases, VM provision time becomes erratic and inconsistent.
- Number of provisioning requests that were lost (failed to service) started to increase as number of parallel requests went up. This number increased steeply at a load of 75 to 100 parallel users.
- When 100 parallel tenants were used to fire provision requests, some VMs were held up in ‘build’ state and never reached an active state. (Figure 2-11).
Figure 2-11 comparatively shows the effect of multiple parallel requests on the success rate of the number of VM provisioned. [x-axis: Number of Tenants/No of parallel requests ; y-axis: Number of VMs].
Figure 2-11 Success Rate of VMs Provisioned by Requests
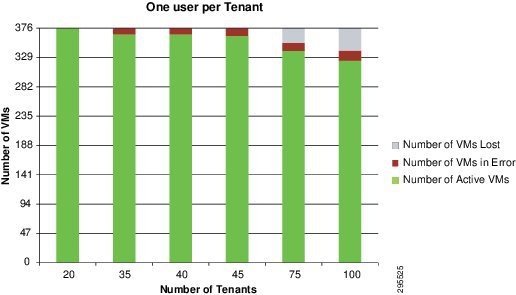
Table 2-2 shows the effect of multiple parallel requests on time taken to provision each VM. [The minimum, average and maximum time taken (in seconds) as reported by rally. Values are rounded to nearest integer for convenience].
Figure 2-12 shows the effect of multiple parallel requests on time taken to provision each VM. [x-axis: Number of VMs; y-axis: Time taken in seconds].
Figure 2-12 VM Provision Time by Requests
- Number of VMs going to Error state increased as the number of active parallel users increased. This number was significantly higher when compared with configuration 1.
- The number of VMs held up in ‘build’ state also increased at higher numbers.
- The time taken to power up a VM increased as number of users increased in the system.
- Increased number of failed VM provision requests were spotted beyond 500 users (50 active users).
- With 1000 users in the system (100 tenants x 10 Users) and 100 parallel users firing requests, more than half of the provision calls were lost as the keystone stopped responding.
- The calls failed to get the Auth-token from keystone and the requests were getting timed out.
Figure 2-13 comparatively shows the effect of multiple parallel requests on the success rate of number of VM provisioned. [X-axis: Number of Tenants/No of parallel requests; Y-axis: Number of VMs].
Figure 2-13 Effect of Parallel Requests on Success Rate of VMs Provisioned
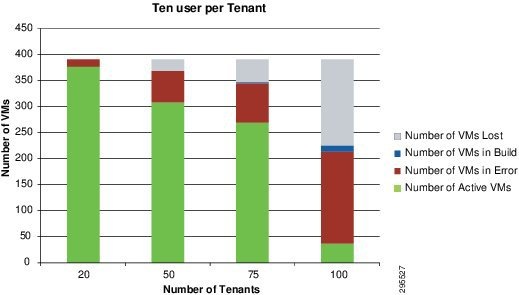
Table 2-3 shows the effect of multiple parallel requests on time taken to provision each VM. [Minimum, average and maximum time taken (in seconds) as reported by Rally. Values are rounded to nearest integer for convenience].
- Time to power up VM increases by 2x for each VM as the total number of users in the system increase.
- This gives an input to the administrator to define the maximum number of tenants and users according to the SLA committed.
- While using 50 or more parallel users, nova-API starts missing requests and hence multiple Nova API servers are required with a load-balancer running behind it.
- As number of tenants and number of active users per tenant increases, request for Auth -token from keystone starts timing out. This is because keystone database table has grown in size and time taken to fetch records from the table increases accordingly.
- If time taken to fetch data from DB is greater than the API time-out, the requests for Auth-token fails and subsequently the VM creation fails.
- While the requests lost can be attributed to the Nova API server being overloaded, VMs going to error state or held up in build state can be attributed to an overloaded Keystone which is unable to authenticate other OpenStack components such as glance, neutron etc.,
- Since Keystone is the central authentication service for all components in OpenStack, each provision request would involve multiple OpenStack components to interact and authenticate with each other.
- This would have a multifold increase in the load on the Keystone server. Hence Keystone-API as well as Keystone database would be under stress.
- The same experiment was also repeated after enabling memcache for keystone to improve the performance. It was observed that at lesser number of tenants there was not much of a difference in the time taken by VMs to power up. However, memcache could not refresh the tokens over a period of time, due to which stale tokens were returned from cache and requests were failing with authentication errors (401—Unauthorized).
Results Summary
Table 2-4 summarizes test case results.
Socket descriptors would be a limiting factor at 147 computes per controller |
|||||||||||
With addition of VMs, number of computes per controller goes down. |
|||||||||||
OpenStack limits the maximum number of VMs based on overcommit ratio.1 |
|||||||||||
With increase in load on Nova-API, time taken to power up VMs goes up. |
|||||||||||
|
With increase in number of tenants and users, keystone stops responding at higher number and request for Auth token times out. As we increase the number of parallel requests, Nova-API also starts missing request resulting n lost VMs. |
|||||||||||
|
1.RAM Overcommit Ratio Formula: Total VMs = (Available RAM * over commit ratio) / RAM Configured per VM. |
Recommendations
The behavior of the system was analyzed during this benchmarking exercise and the results are documented under each test case. Based on these results, the following recommendations can be suggested.
However, the numbers suggested in these recommendations may vary depending on the configuration of the hardware used to deploy OpenStack using Cisco OpenStack Installer. Kindly refer to the section Mixed-Workload server configuration—Cisco UCS C220 M3 specifications under ‘Hardware Architecture’ for details regarding the setup used.
1.![]() While running memory intensive applications, using VMs with flavor greater than “small” would give better performance.
While running memory intensive applications, using VMs with flavor greater than “small” would give better performance.
2.![]() For memory intensive and critical VMs, it is advised to set RAM over commit ratio to 1.0 (default value is 1.5) which would give a more realistic estimate and one can avoid memory crunch.
For memory intensive and critical VMs, it is advised to set RAM over commit ratio to 1.0 (default value is 1.5) which would give a more realistic estimate and one can avoid memory crunch.
3.![]() Limiting the number of provisioned VMs to 40% of the MAXIMUM number of VMs that can be provisioned (for a given flavor) would be ideal.
Limiting the number of provisioned VMs to 40% of the MAXIMUM number of VMs that can be provisioned (for a given flavor) would be ideal.
4.![]() The total number of computes (Physical machines) required can be approximated based on the total number of VMs the users would provision.
The total number of computes (Physical machines) required can be approximated based on the total number of VMs the users would provision.
5.![]() Based on results of test case 2, it can be concluded that the message queue (RabbitMQ) would act as a limiting factor on the number of computes that can be managed by a single controller. To avoid this limitation, a greater number of controllers can be used with a load balancer
Based on results of test case 2, it can be concluded that the message queue (RabbitMQ) would act as a limiting factor on the number of computes that can be managed by a single controller. To avoid this limitation, a greater number of controllers can be used with a load balancer
6.![]() Based on the results of test case 5, to ensure each request is processed successfully, it is recommended to limit the total number of tenants to 10 per controller (assuming 5 users per tenant are active at peak load).
Based on the results of test case 5, to ensure each request is processed successfully, it is recommended to limit the total number of tenants to 10 per controller (assuming 5 users per tenant are active at peak load).
 Feedback