Data Center Multitier Model and Testbed Topology
The modern data center is evolving to meet new business requirements emanating from Web 2.0 and social network changes to the Internet and corporate networks. Figure 4-1 depicts the diversity of compute, storage, and networking elements that compose the modern data center.
Figure 4-1 Data Center Multitier Model
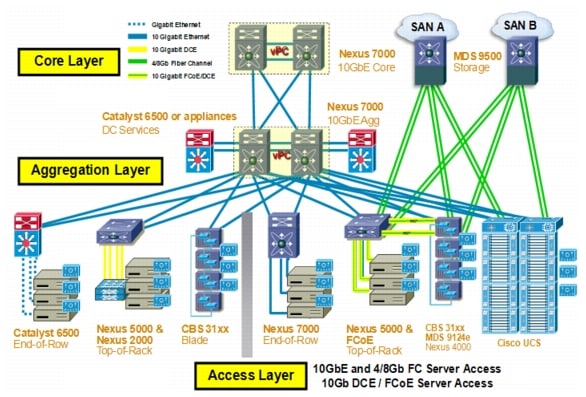
A data center is home to computational power, storage, and applications that support an enterprise business. The data center design is based on a proven layered approach, which has been tested and improved over several years in some of the largest data center implementations. The layered approach provides the basic foundation of a data center design that improves scalability, performance, flexibility, resiliency and maintenance.
The validated network design consists of data centers that interconnect via the enterprise core network. Each data center is built on the multilayer design and includes N-PE routers in addition to core, aggregation and access layer devices.
Figure 4-2 VPLS-based Data Center Interconnection - Lab Topology
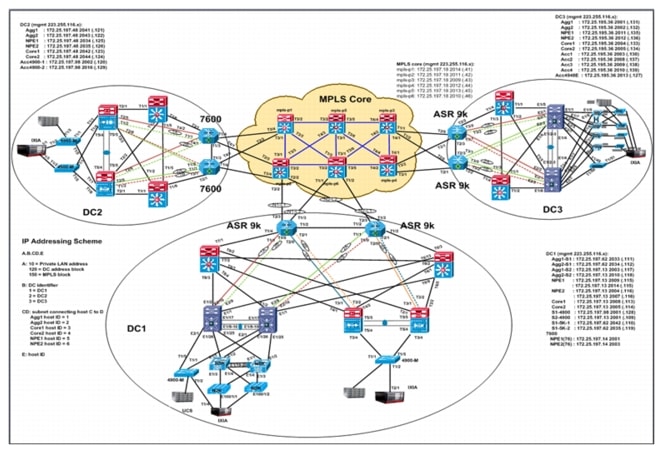
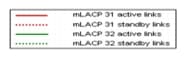
Legend:
End-to-end service validation was performed by using traffic tools to generate IP unicast and multicast traffic on the network. A variety of health checks were performed, including memory and CPU utilization, trace-backs, memory alignment errors, interface errors, line card status and syslog messages. These checks were performed during every stage of network provisioning and before and after including errors and failures to determine the convergence of traffic.
Traffic Profile
This section outlines traffic flows used during extension of 500 and 1200 VLANs between data centers and the layer 2 and layer 3 test parameters configured to determine end-to-end convergence for unicast and multicast traffic.
Traffic flows
Bidirectional traffic was provisioned between DC2 and DC3, however all negative tests, i.e. link and node failure test cases were executed only in DC3 (where Cisco ASR9000 were deployed as PE routers) and network convergence was measured.
Distance between the DC2 and DC3 was 400 kms simulated using Anue and all interfaces end-to-end were 10gig Ethernet.
500 VLANs extension: Total 6.1 Gbps of aggregate traffic; 128-byte packet size
•![]() Unicast (1200 Flows): 4.9 Gbps
Unicast (1200 Flows): 4.9 Gbps
–![]() Bidirectional intra-VLAN traffic: 1000 flows (L2)
Bidirectional intra-VLAN traffic: 1000 flows (L2)
–![]() Bidirectional inter-VLAN: 100 flows
Bidirectional inter-VLAN: 100 flows
–![]() Bidirectional inter-VLAN: 100 flows. These flows were provisioned for VLANs that were not extended between data centers
Bidirectional inter-VLAN: 100 flows. These flows were provisioned for VLANs that were not extended between data centers
–![]() In addition, bidirectional Layer 2 traffic to generate 20,000 MAC addresses. Total 40 MAC addresses per vlan: 20 MAC addresses from DC2 and 20 MAC addresses from DC3
In addition, bidirectional Layer 2 traffic to generate 20,000 MAC addresses. Total 40 MAC addresses per vlan: 20 MAC addresses from DC2 and 20 MAC addresses from DC3
500 VLANS * 40 MAC addresses = 20,000 MAC addresses
•![]() Multicast (300 Flows and 300 Groups): 1.2 Gbps
Multicast (300 Flows and 300 Groups): 1.2 Gbps
–![]() Intra-VLAN traffic: 100 flows, 100 groups
Intra-VLAN traffic: 100 flows, 100 groups
–![]() Inter-VLAN: 100 flows, 100 groups
Inter-VLAN: 100 flows, 100 groups
–![]() Inter-VLAN: 100 flows, 100 groups. These flows were provisioned for VLANs that were not extended between data centers
Inter-VLAN: 100 flows, 100 groups. These flows were provisioned for VLANs that were not extended between data centers
•![]() VLAN Distribution in DC3
VLAN Distribution in DC3
–![]() mLACP 31: Po31 ‚Äì VLANs 1,76-80,100-349 = 256 VLANs
mLACP 31: Po31 – VLANs 1,76-80,100-349 = 256 VLANs
–![]() mLACP 32: Po32 ‚Äì VLANs 1200-1499 = 250 VLANs
mLACP 32: Po32 – VLANs 1200-1499 = 250 VLANs
–![]() vPC to N5k : Po10 ‚Äì VLANs 1,76-80,100-349 = 256 VLANs
vPC to N5k : Po10 – VLANs 1,76-80,100-349 = 256 VLANs
–![]() 4948: Po13 ‚Äì VLANs 1,1200-1499,3051-3100 (L3) = 301 VLANs
4948: Po13 – VLANs 1,1200-1499,3051-3100 (L3) = 301 VLANs
1200 VLANs extension: Total of 10.6 Gbps aggregate traffic; 128-byte packet size
•![]() Unicast (2590 Flows): 10.6 Gpbs
Unicast (2590 Flows): 10.6 Gpbs
–![]() Bidirectional intra-VLAN traffic: 2400 flows (L2)
Bidirectional intra-VLAN traffic: 2400 flows (L2)
–![]() Bidirectional inter-VLAN: 90 flows
Bidirectional inter-VLAN: 90 flows
–![]() Bidirectional inter-VLAN: 100 flows. These flows were provisioned for VLANs that were not extended between data centers
Bidirectional inter-VLAN: 100 flows. These flows were provisioned for VLANs that were not extended between data centers
–![]() In addition, bidirectional Layer 2 traffic to generate 20,000 MAC addresses. Total 40 MAC addresses per vlan: 20 MAC addresses from DC2 and 20 MAC addresses from DC3
In addition, bidirectional Layer 2 traffic to generate 20,000 MAC addresses. Total 40 MAC addresses per vlan: 20 MAC addresses from DC2 and 20 MAC addresses from DC3
500 VLANS * 40 MAC addresses = 20,000 MAC addresses
•![]() VLAN Distribution in DC3
VLAN Distribution in DC3
–![]() mLACP 31: Po31 ‚Äì VLANs 1,76-80,100-999,1100-1199 = 1006 VLANs
mLACP 31: Po31 – VLANs 1,76-80,100-999,1100-1199 = 1006 VLANs
–![]() mLACP 32: Po32 ‚Äì VLANs 1200-1399 = 200 VLANs
mLACP 32: Po32 – VLANs 1200-1399 = 200 VLANs
–![]() vPC to N5k : Po10 ‚Äì VLANs 1,76-80,100-349 = 256 VLANs
vPC to N5k : Po10 – VLANs 1,76-80,100-349 = 256 VLANs
–![]() 4948: Po13 ‚Äì VLANs 1,350-999,1100-1399,3051-3100 (L3) = 1001 VLANs
4948: Po13 – VLANs 1,350-999,1100-1399,3051-3100 (L3) = 1001 VLANs
Test setup for Layer 2 and Layer 3 parameters
•![]() Layer 2
Layer 2
–![]() Rapid PVST between the access and aggregation switches
Rapid PVST between the access and aggregation switches
–![]() vPC peer-switch on both N7K aggregation switches for single STP root in L2 topology
vPC peer-switch on both N7K aggregation switches for single STP root in L2 topology
–![]() dot1q trunks and port-channels between aggregation and PEs. One active link from each N7k aggregation to ASR9k-1 and one backup link from each N7k to ASR9k-2 for one mLACP group. Two such mLACP groups configured between N7k‚Äôs and ASR9k‚Äôs for VLANs load-sharing
dot1q trunks and port-channels between aggregation and PEs. One active link from each N7k aggregation to ASR9k-1 and one backup link from each N7k to ASR9k-2 for one mLACP group. Two such mLACP groups configured between N7k’s and ASR9k’s for VLANs load-sharing
–![]() Storm-control on N7k port-channels facing PEs to prevent storm propagating from remote datacenters
Storm-control on N7k port-channels facing PEs to prevent storm propagating from remote datacenters
•![]() Layer 3
Layer 3
–![]() HSRP configured on agg switches, with N7k as vPC primary being HSRP active and N7k as vPC secondary being HSRP standby
HSRP configured on agg switches, with N7k as vPC primary being HSRP active and N7k as vPC secondary being HSRP standby
–![]() 500 SVIs across 16 VRFs; 33 SVIs per each VRF
500 SVIs across 16 VRFs; 33 SVIs per each VRF
–![]() OSPF between aggregation and core switches and between core and PE devices
OSPF between aggregation and core switches and between core and PE devices
Table 4-1 provides L2 and L3 test parameters summary.

Note ![]() DC3 was the portion of the network under test. All the considerations and test results contained in this paper apply to that specific part of the overall topology.
DC3 was the portion of the network under test. All the considerations and test results contained in this paper apply to that specific part of the overall topology.
 Feedback