Working With Reports on the New Web Interface

This chapter contains the following sections:

Ways to View Reporting Data

The following table shows the different ways to view reporting data:

Table 1. Ways To View Reporting Data

To

See

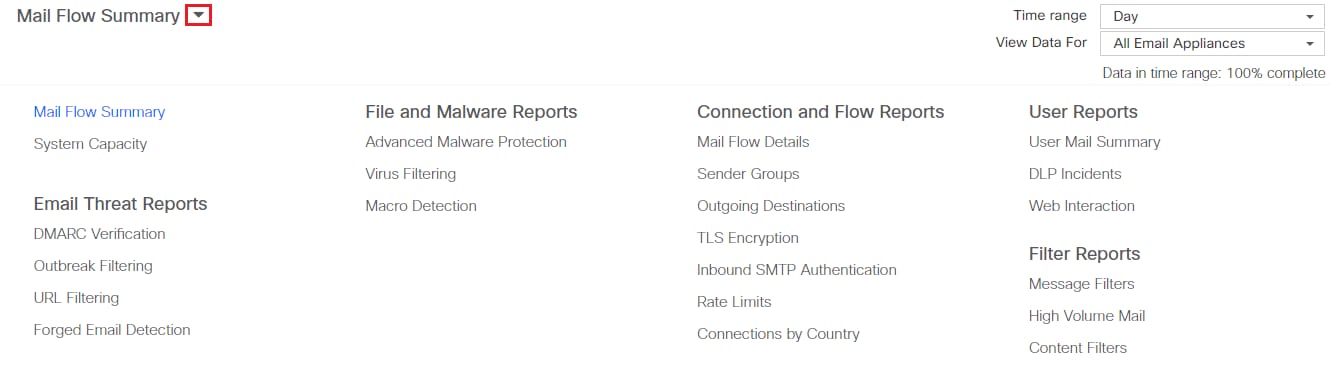
View and customize web-based interactive report pages

Automatically generate recurring CSV reports

Scheduling Email Reports

Generate a CSV report on demand

Generating Email Reports On Demand

Export raw data as a CSV (Comma-separated values) file

Printing and Exporting Reporting and Tracking Data

Exporting Report Data as a Comma Separated Values (CSV) File

Email report information to yourself and other people

Scheduling Email Reports

Generating Email Reports On Demand

Find information about specific transactions

Viewing Details of Messages or Transactions Included in Reports


Note

For differences between logging and reporting, see Logging Versus Reporting.


How the Security Management Appliance Gathers Data for Reports

The Security Management appliance pulls data for all reports from all managed appliances approximately every 15 minutes and aggregates the data from these appliances. Depending on your appliance, it may take awhile for a particular message to be included in the reporting data on the Security Management appliance. Check the System Status page for information on your data.

Reporting Data includes transactions involving both IPv4 and IPv6.


Note

When gathering data for reports, the Security Management appliance applies the timestamp from the information that was set when you configured the time settings on the Security Management appliance. For information on setting the time on your Security Management appliance, see the Configuring the System Time.

How Reporting Data is Stored

All of the appliances store reporting data. The following table shows what time periods that each appliance stores data.

Table 2. Reporting Data Storage on the Email Security Appliances

Minute

Hourly

Daily

Weekly

Monthly

Yearly

Local Reporting onEmail Security appliance

Centralized Reporting on Email Security appliance

Security Management appliance

About Reporting and Upgrades

New reporting features may not apply to transactions that occurred before upgrade, because the required data may not have been retained for those transactions. For possible limitations related to reporting data and upgrades, see the Release Notes for your release.

Using the Interactive Report Pages

You can use the Product drop-down on the top of the web interface to switch between the Email Security appliance and Web Security appliance.

You can view the reports for the Email and Web Security appliance using the Reports drop-down as shown in the following figure:


Note

The Mail Flow Summary report page is the landing page (the page displayed after login).


Figure 1. Reports Drop-down

You can use the Reports drop-down to view your email and web reports as categorized in the following table:

Email Security Appliance

Web Security Appliance

  • Email Threat Reports

  • File and Malware Reports

  • Connection and Flow Reports

  • User Reports

  • Filter Reports

  • General Reports

  • Threat Reports

Related Topics

Customizing Your View of Report Data

You can customize your view while viewing the report data in the web interface.

To

Do This

Specify a time range

See Choosing a Time Range for Reports.

View data per appliance or reporting group

See Viewing Reporting Data for an Appliance or Reporting Group

(For Web reports) Choose which data to chart

See (Web Reports Only) Choosing Which Data to Chart

Customize tables

See Customizing Tables on Report Pages

(Email Reports Only) Customize views

See (Email Reports Only) Customizing Views on Report Pages

Using Counters to Filter Data on Trend Graph

See Using Counters to Filter Data on the Trend Graphs

Specify report-related preferences

See Setting Preferences

Search for specific information or a subset of data to view


Note

All customization features are not available for every report.


Viewing Reporting Data for an Appliance or Reporting Group

For Mail Flow Summary and System Capacity reports for Email, you can view data from all appliances, or from any one centrally-managed appliance.

For Email reports, if you have created groups of Email Security appliances as described in Creating Email Reporting Groups, you can view the data for each reporting group.

To specify the view, select an appliance or group from the View Data For list on supported pages.

If you are viewing report data on the Cloud Email Security Management Console to which you have recently taken backup from another Security Management appliance, you must first add (but do not establish a connection to) each appliance in > Management Appliance > Centralized Services > Security Appliances.

Choosing a Time Range for Reports

Most predefined report pages allow you to choose a Time Range for the data to include. The time range that you select is used for all of the report pages until you select a different value in the Time Range menu.

Available Time Range options differ by appliance and differ for Email and Web reporting on the Security Management appliance:


Note

Time ranges on report pages are displayed as a Greenwich Mean Time (GMT) offset. For example, Pacific time is GMT + 7 hours (GMT + 07:00).

Note

All reports display date and time information based on the systems configured time zone, shown as a Greenwich Mean Time (GMT) offset. However, data exports display the time in GMT to accommodate multiple systems in multiple time zones around the world.

Tip

You can specify a default time range that will always display each time you log in. For information, see Setting Preferences.


(Web Reports Only) Choosing Which Data to Chart

The default charts on each Web Reporting page display commonly-referenced data, but you can choose to chart different data instead. If a page has multiple charts, you can change each chart.

Generally, the chart options are the same as the columns of the table in the report. However, some columns cannot be charted.

Charts reflect all available data in a table column, regardless of the number of items (rows) you choose to display in the associated table.

Procedure


Step 1

Click on a specific chart.

Step 2

Choose the required data to be displayed. The preview of the chart is displayed as per the selected options.

Step 3

Click Apply.


(Email Reports Only) Customizing Views on Report Pages

Most report pages allow you to choose between graphical view, tabular view or combined view. The view that you select is used to show the data on the report pages.

Table 3. Customizing Views on Email Reporting Pages

To

Do This

Show data in graph view.

Click to view data in graphical format.

Show data in table view.

Click to view data in tabular format.

View details about a table entry, where available

Click a blue entry in the table.

Show data in combined view.

Click to view data in graphical and tabular format.

Customizing Tables on Report Pages

You can view, customize and sort information on the interactive tables within the report pages. The view that you select is used to show the data on the report pages.

Table 4. Customizing Tables on Report Pages

To

Do This

More Information

  • Show additional columns

  • Hide visible columns

  • Determine available columns for a table

  1. Click .

  2. Select the columns to display, and click Close.

For most tables, some columns are hidden by default.

Each report page offers different columns.

See the table column descriptions for the respective tables.

Sort the table by the heading of your choice.

Click a column heading.

-

Reorder table columns

Drag a column heading to the desired new position

-

View details about a table entry, where available

Click a blue entry in the table

See also Viewing Details of Messages or Transactions Included in Reports.

View details of additional rows.

You can scroll down on a table to display details of additional rows.

-

Filtering data to a specific subset

Enter a value in the filter setting below a specific table, where available

For Web reports, available filters are discussed on each individual report page description. See Understanding the Web Reporting Pages on the New Web Interface.

Using Counters to Filter Data on the Trend Graphs

You can filter data based on the required time range and available counters on a trend graph.

The time range that you select in the Time Range drop-down, is used for a trend graph until you select a different value.

A counters on a trend graph of the Mail Flow Summary report page is used to view data specific to different filters. Click on an available counter to filter the data.

Viewing Details of Messages or Transactions Included in Reports

Procedure


Step 1

Click any blue number in a table on a report page.

(Not all tables have these links.)

The messages or transactions included in that number are displayed in Message Tracking or Web Tracking, respectively.

Step 2

Scroll down to see the list of messages or transactions.


What to do next

Improving Performance of Email Reports

If the performance of aggregated reporting decreases due to a large number of unique entries over the course of a month, use reporting filters to restrict the aggregation of data in reports that cover the previous year (Last Year reports). These filters can restrict detailed, individual IP, domain, or user data in reports. Overview reports and summary information remain available for all reports.

You can enable one or more of the reporting filters using the reportingconfig > filters menu in the CLI. The changes must be committed to take effect.

  • IP Connection Level Detail. Enabling this filter prevents the Security Management appliance from recording information about individual IP addresses. This filter is appropriate for systems that process a large number of incoming IP addresses due to attacks.

    This filter affects the following Last Year reports:

    • Sender Profile for Incoming Mail
    • IP Addresses for Incoming Mail
    • IP Addresses for Outgoing Senders
  • User Detail. Enabling this filter prevents the Security Management appliance from recording information about individual users sending and receiving mail and the content filters that are applied to the users’ mail. This filter is appropriate for appliances that process mail for millions of internal users or if the system does not validate recipient addresses.

    This filter affects the following Last Year reports:

    • Internal Users
    • Internal User Details
    • IP Addresses for Outgoing Senders
    • Content Filters
  • Mail Traffic Detail. Enabling this filter prevents the Security Management appliance from recording information about individual domains and networks that the appliances monitor. This filter is appropriate when the number of valid incoming or outgoing domains is measured in the tens of millions.

    This filter affects the following Last Year reports:

    • Domains for Incoming Mail
    • Sender Profile for Incoming Mail
    • Internal User Details
    • Domains for Outgoing Senders

Note

To view up-to-the-minute reporting data for the preceding hour, you must log in to an individual appliance and view the data there.

Printing and Exporting Reporting and Tracking Data

Table 5. Printing and Exporting Reporting and Tracking Data

To Get This

PDF

CSV

Do This

Notes

A PDF of an interactive report page

Click the Printable (PDF) link at the top-right of an interactive report page.

The PDF reflects the customizations that you are currently viewing.

PDFs are formatted to be printer-friendly.

A PDF of report data

Create a scheduled or on-demand report. See:

Raw data

See also Exporting Report Data as a Comma Separated Values (CSV) File.

Click the Export link below the chart or table.

The CSV file contains all applicable data, not just the data visible in the chart or table.

Create a scheduled or on-demand report. See:

Each CSV file may contain up to 100 rows.

If a report contains more than one table, a separate CSV file will be created for each table.

Some extended reports are not available in CSV format.

Reports in different languages

Choose the desired Report Language when you schedule a report or create one on demand.

To generate PDFs in Chinese, Japanese, or Korean on Windows computers, you must also download the applicable Font Pack from Adobe.com and install it on your local computer.

(Web Security) A custom subset of report data, for example data for a particular user.

In Web Tracking, perform a search, then click the Printable Download link on the Web Tracking page. Choose PDF or CSV format.

PDFs may not include all information available on the web page. Specifically, PDFs include:

  • Up to 1,000 transactions.
  • If you display details, up to 100 related transactions.
  • Up to 3000 characters per related transaction.

CSV files include all raw data matching the search criteria.

(Email Security) A custom subset of data, for example data for a particular user.

In Message Tracking, perform your search, then click the Export link or Export All link above the search results.

The Export link downloads a CSV file with the displayed search results, up to the limit you specified in your search criteria.

The Export All link downloads a CSV file with up to 50,000 messages that match your search criteria.

Tip: If you need to export more than 50,000 messages, perform a series of exports for a set of shorter time ranges.

Table 6. Printing and Exporting Reporting and Tracking Data on the New Web Interface

To Get This

CSV

Do This

Notes

Raw data

See also Exporting Report Data as a Comma Separated Values (CSV) File

Click the Export link below the chart or table.

The CSV file contains all applicable data, including the data visible in the chart or table.

Create a scheduled or on-demand report. See:

Each CSV file may contain up to 100 rows.

If a report contains more than one table, a separate CSV file is created for each table.

Some extended reports are not available in CSV format.

(Web Security) A custom subset of report data, for example data for a particular user.

In Web Tracking, perform a search, then click the Printable Download link on the Web Tracking page. Choose PDF or CSV format.

CSV files include all raw data matching the search criteria.

(Email Security) A custom subset of data, for example data for a particular user.

In Message Tracking, perform your search, then click the Export link or Export All link above the search results.

The Export link downloads a CSV file with the displayed search results, up to the limit you specified in your search criteria.

The Export All link downloads a CSV file with up to 50,000 messages that match your search criteria.

Tip: If you need to export more than 50,000 messages, perform a series of exports for a set of shorter time ranges.

Exporting Report Data as a Comma Separated Values (CSV) File

You can export raw data to a comma-separated values (CSV) file, which you can access and manipulate using database applications such as Microsoft Excel. For different ways to export data, see Printing and Exporting Reporting and Tracking Data.

Because CSV exports include only raw data, exported data from a web-based report page may not include calculated data such as percentages, even if that data appears in the web-based report.

For email message tracking and reporting data, the exported CSV data will display all data in GMT regardless of what is set on the Security Management appliance. This simplifies using data independently from the appliance, particularly when referencing data from appliances in multiple time zones.

The following example is an entry from a raw data export of the Anti-Malware category report, where Pacific Daylight Time (PDT) is displayed as GMT - 7 hours:

Begin Timestamp, End Timestamp, Begin Date, End Date, Name, Transactions Monitored, Transactions Blocked, Transactions Detected

1159772400.0, 1159858799.0, 2006-10-02 07:00 GMT, 2006-10-03 06:59 GMT, Adware, 525, 2100, 2625

Table 7. Viewing Raw Data Entries

Category Header

Value

Description

Begin Timestamp

1159772400.0

Query start time in number of seconds from epoch.

End Timestamp

1159858799.0

Query end time in number of seconds from epoch.

Begin Date

2006-10-02 07:00 GMT

Date the query began.

End Date

2006-10-03 06:59 GMT

Date the query ended.

Name

Adware

Name of the malware category.

Transactions Monitored

525

Number of transactions monitored.

Transactions Blocked

2100

Number of transactions blocked.

Transactions Detected

2625

Total number of transactions:

Number of transactions detected + Number of transactions blocked.


Note

Category headers are different for each type of report.If you export localized CSV data, the headings may not be rendered properly in some browsers. This occurs because some browsers may not use the proper character set for the localized text. To work around this problem, you can save the file to your local machine, and open the file on any web browser using File > Open. When you open the file, select the character set to display the localized text.

Troubleshooting All Reports

Unable to View Report Data on Backup Security Management Appliance

Problem

You are unable to select a single Email Security appliance for which to view report data. The View Data For option does not appear on the reporting page.

Solution

See also Availability of Services During Backups.

Reporting Is Disabled

Problem

Canceling a backup in progress can disable reporting.

Solution

Reporting functionality will be restored after a backup is completed.