PDF(10.3 MB) View with Adobe Reader on a variety of devices
Updated:December 1, 2025
Bias-Free Language
The documentation set for this product strives to use bias-free language. For the purposes of this documentation set, bias-free is defined as language that does not imply discrimination based on age, disability, gender, racial identity, ethnic identity, sexual orientation, socioeconomic status, and intersectionality. Exceptions may be present in the documentation due to language that is hardcoded in the user interfaces of the product software, language used based on RFP documentation, or language that is used by a referenced third-party product. Learn more about how Cisco is using Inclusive Language.
First Published: December 13, 2023
Deploy a Cluster for the ASA Virtual in a Public
Cloud
Clustering lets you group multiple ASA Virtuals together as a single logical device. A cluster provides all the convenience of a single device (management, integration
into a network) while achieving the increased throughput and redundancy of multiple devices. You can deploy ASA Virtual clusters in a public cloud using the following:
Amazon Web Services (AWS) with ASA
9.19+
Microsoft Azure with ASA 9.20(2)+
Currently, only routed firewall mode is supported.
This
section describes the clustering architecture and how it works.
How the Cluster Fits into Your Network
The cluster consists of multiple firewalls acting as a single
device. To act as a cluster, the firewalls need the following infrastructure:
Isolated network for intra-cluster communication, known
as the cluster control link, using VXLAN
interfaces. VXLANs, which act as Layer 2 virtual networks over Layer 3
physical networks, let the ASA Virtual send broadcast/multicast messages over the cluster control link.
Load Balancer(s)—For external load balancing, you have the following
options:
AWS Gateway Load Balancer
The AWS Gateway Load Balancer combines a transparent network gateway
and a load balancer that distributes traffic and scales virtual
appliances on demand. The ASA Virtual supports the Gateway Load Balancer centralized control plane with
a distributed data plane (Gateway Load Balancer endpoint) using a
Geneve interface single-arm proxy.
Equal-Cost Multi-Path Routing (ECMP) using inside and outside routers
such as Cisco Cloud Services Router
ECMP routing can forward packets over multiple “best paths” that tie
for top place in the routing metric. Like EtherChannel, a hash of
source and destination IP addresses and/or source and destination
ports can be used to send a packet to one of the next hops. If you
use static routes for ECMP routing, then the ASA Virtual failure can cause problems; the route continues to be used, and
traffic to the failed ASA Virtual will be lost. If you use static routes, be sure to use a static
route monitoring feature such as Object Tracking. We recommend using
dynamic routing protocols to add and remove routes, in which case,
you must configure each ASA Virtual to participate in dynamic routing.
Note
Layer 2 Spanned EtherChannels are not supported for load balancing.
Cluster Nodes
Cluster nodes work together to accomplish the
sharing of the security policy and traffic flows. This section
describes the nature of each node role.
Bootstrap Configuration
On each device, you configure a minimal bootstrap configuration
including the cluster name, cluster control link interface, and other cluster settings.
The first node on which you enable clustering typically becomes the control node. When you enable clustering on subsequent
nodes, they join the cluster as data nodes.
Control and Data Node Roles
One member of the cluster
is the control node. If multiple cluster nodes come online at the same time, the control node
is determined by the priority setting in the bootstrap
configuration; the priority is set between 1 and 100, where 1 is the highest priority.
All other members are data nodes. Typically, when you first create a
cluster, the first node you add becomes the control node simply because it is the only node
in the cluster so far.
You
must perform all configuration (aside from the bootstrap configuration) on the control node
only; the configuration is then replicated to the data nodes. In the case of physical assets,
such as interfaces, the configuration of the control node is mirrored on all data nodes. For
example, if you configure Ethernet 1/2 as the inside interface and Ethernet 1/1 as the outside
interface, then these interfaces are also used on the data nodes as inside and outside
interfaces.
Some features do not scale
in a cluster, and the control node handles all traffic for those features.
Individual Interfaces
You can configure cluster interfaces as Individual interfaces.
Individual interfaces are normal routed interfaces, each with their own local IP
address. Interface configuration must be configured only on the control node,
and each interface uses DHCP.
Note
Layer 2 Spanned EtherChannels are not supported.
Cluster Control Link
Each node must dedicate one interface as a VXLAN (VTEP)
interface for the cluster control link.
VXLAN Tunnel Endpoint
VXLAN tunnel endpoint (VTEP) devices perform
VXLAN encapsulation and decapsulation. Each VTEP has two interface types: one or
more virtual interfaces called VXLAN Network Identifier (VNI) interfaces, and a
regular interface called the VTEP source interface that tunnels the VNI interfaces
between VTEPs. The VTEP source interface is attached to the transport IP network for
VTEP-to-VTEP communication.
VTEP Source Interface
The VTEP source interface is a regular ASA
Virtual interface with which you plan to associate the VNI interface. You can configure
one VTEP source interface to act as the cluster control link. The source interface
is reserved for cluster control link use only. Each VTEP source interface has an IP
address on the same subnet. This subnet should be isolated from all other traffic,
and should include only the cluster control link interfaces.
VNI Interface
A VNI interface is similar to a VLAN
interface: it is a virtual interface that keeps network traffic separated on a given
physical interface by using tagging. You can only configure one VNI interface. Each
VNI interface has an IP address on the same subnet.
Peer VTEPs
Unlike regular VXLAN for data interfaces, which allows a single VTEP peer, The ASA
Virtual clustering allows you to configure multiple peers.
Cluster Control Link Traffic Overview
Cluster control link traffic includes both control and data
traffic.
Control traffic includes:
Control node election.
Configuration replication.
Health monitoring.
Data traffic includes:
State replication.
Connection ownership queries and data packet forwarding.
Cluster Control Link Failure
If the cluster control link line protocol goes down for a unit,
then clustering is disabled; data interfaces are shut down. After you fix the cluster
control link, you must manually rejoin the cluster by re-enabling clustering.
Note
When the ASA Virtual becomes inactive, all data interfaces are shut down; only the management-only
interface can send and receive traffic. The management interface remains up using
the IP address the unit received from DHCP or the cluster IP pool. If you use a
cluster IP pool, if you reload and the unit is still inactive in the cluster, then
the management interface is not accessible (because it then uses the Main IP
address, which is the same as the control node). You must use the console port (if
available) for any further configuration.
Configuration Replication
All nodes in the cluster share a single configuration. You can only make
configuration changes on the control node (with the exception of the bootstrap
configuration), and changes are automatically synced to all other nodes in the
cluster.
ASA
Virtual Cluster Management
One of the benefits of using ASA Virtual clustering is the ease of management. This section describes how to manage the
cluster.
Management Network
We recommend connecting all nodes to a single management network. This network is
separate from the cluster control link.
Management Interface
Use the Management 0/0 interface for management.
Note
You cannot enable dynamic routing for the management interface.
You must use a static route.
You can use either static addressing or DHCP for the management IP
address.
If you use static addressing, you can use a Main cluster IP address
that is a fixed address for the cluster that always belongs to the current control node.
For each interface, you also configure a range of addresses so that each node, including
the current control node, can use a Local address from the range. The Main cluster IP
address provides consistent management access to an address; when a control node
changes, the Main cluster IP address moves to the new control node, so management of the
cluster continues seamlessly. The Local IP address is used for routing, and is also
useful for troubleshooting. For example, you can manage the cluster by connecting to the
Main cluster IP address, which is always attached to the current control node. To manage
an individual member, you can connect to the Local IP address. For outbound management
traffic such as TFTP or syslog, each node, including the control node, uses the Local IP
address to connect to the server.
If you use DHCP, you do not use a pool of Local addresses or have a Main cluster IP
address.
Note
To-the-box traffic needs to be directed to the node's management IP address;
to-the-box traffic is not forwarded over the cluster control link to any other
node.
Control Node Management Vs. Data Node Management
All management and monitoring can take place on the control node. From
the control node, you can check runtime statistics, resource usage, or other
monitoring information of all nodes. You can also issue a command to all nodes
in the cluster, and replicate the console messages from data nodes to the
control node.
You can monitor data nodes directly if desired. Although also available
from the control node, you can perform file management on data nodes (including
backing up the configuration and updating images). The following functions are
not available from the control node:
Monitoring per-node cluster-specific statistics.
Syslog monitoring per node (except for syslogs sent to the console when
console replication is enabled).
SNMP
NetFlow
Crypto Key Replication
When you create a crypto key on the control node, the key is replicated
to all data nodes. If you have an SSH session to the Main cluster IP address,
you will be disconnected if the control node fails. The new control node uses
the same key for SSH connections, so that you do not need to update the cached
SSH host key when you reconnect to the new control node.
ASDM Connection Certificate IP Address Mismatch
By default, a self-signed certificate is used for the ASDM connection
based on the Local IP address. If you connect to the Main cluster IP address
using ASDM, then a warning message about a mismatched IP address might appear
because the certificate uses the Local IP address, and not the Main cluster IP
address. You can ignore the message and establish the ASDM connection. However,
to avoid this type of warning, you can enroll a certificate that contains the
Main cluster IP address and all the Local IP addresses from the IP address pool.
You can then use this certificate for each cluster member. See https://www.cisco.com/c/en/us/td/docs/security/asdm/identity-cert/cert-install.html for more information.
Licenses for ASA Virtual Clustering
Each cluster node requires the same model license. We recommend using the same number
of CPUs and memory for all nodes, or else peformance will be limited on all nodes to
match the least capable member. The throughput level will be replicated from the
control node to each data node so they match.
Note
If you deregister the ASA Virtual so that it is unlicensed, then it will revert to a severely rate-limited
state if you reload the ASA Virtual. An unlicensed, low performing cluster node will impact the performance of
the entire cluster negatively. Be sure to keep all cluster nodes licensed, or
remove any unlicensed nodes.
Requirements and Prerequisites for ASA Virtual Clustering
Must be the same performance tier. We recommend using
the same number of CPUs and memory for all nodes, or else peformance will be
limited on all nodes to match the least capable node.
Must run the identical software except at the time of
an image upgrade. Hitless upgrade is supported. Mismatched software versions
can lead to poor performance, so be sure to upgrade all nodes in the same
maintenance window.
Single Availability Zone deployment supported.
Cluster control link interfaces must be in the same subnet, so the cluster
should be deployed in the same subnet.
MTU
Make sure the ports connected to the cluster control link have the correct (higher)
MTU configured. If there is an MTU mismatch, the cluster formation will fail. When a node joins the cluster, it checks MTU compatibility by sending a ping to
the control node with a packet size matching the cluster control link MTU. If
the initial ping fails, the node tries a ping using a smaller packet size (the
MTU divided by 2, then by 4, then by 8) until a ping succeeds. A notification is
generated so you can fix the MTU mismatch on connecting switches and try again.
The cluster control link MTU should be 154 bytes higher than the data interfaces.
Because the cluster control link traffic includes data packet forwarding, the
cluster control link needs to accommodate the entire size of a data packet plus
cluster traffic overhead (100 bytes) plus VXLAN overhead (54 bytes).
For AWS with GWLB, the data interface uses Geneve encapsulation. In this case, the
entire Ethernet datagram is being encapsulated, so the new packet is larger and
requires a larger MTU. You should set the source interface MTU to be the network MTU
+ 306 bytes. So for the standard 1500 MTU network path, the source interface MTU
should be 1806, and the cluster control link MTU should be +154, 1960.
For Azure with GWLB, the data interface uses VXLAN encapsulation. In this case, the entire Ethernet datagram is being encapsulated,
so the new packet is larger and requires a larger MTU. You should set the source interface MTU to be the network MTU + 54
bytes.
The following table shows the suggested cluster control link MTU and data interface
MTU.
Note
We do not recommend setting the cluster control link MTU between
2561 and 8362; due to block pool handling, this MTU size is not optimal for
system operation.
Table 1. Suggested MTU
Public Cloud
Cluster Control Link MTU
Data Interface MTU
AWS with GWLB
1960
1806
AWS
1654
1500
Azure with GWLB
1554
1454
Azure
1554
1400
Guidelines for ASA Virtual Clustering
High Availability
High Availability is not supported with clustering.
IPv6
The cluster control link is only supported using IPv4.
Additional Guidelines
When significant topology changes occur (such as adding
or removing an EtherChannel interface, enabling or disabling an interface on
the ASA virtual or the switch, adding an additional switch to form a
redundant switch system) you should disable the health check feature and
also disable interface monitoring for the disabled interfaces. When the
topology change is complete, and the configuration change is synced to all
units, you can re-enable the interface health check feature.
When adding a node to an existing cluster, or when
reloading a node, there will be a temporary, limited packet/connection drop;
this is expected behavior. In some cases, the dropped packets can hang your
connection; for example, dropping a FIN/ACK packet for an FTP connection
will make the FTP client hang. In this case, you need to reestablish the FTP
connection.
For decrypted TLS/SSL connections, the decryption states are not
synchronized, and if the connection owner fails, then decrypted connections
will be reset. New connections will need to be established to a new node.
Connections that are not decrypted (they match a do-not-decrypt rule) are
not affected and are replicated correctly.
Dynamic scaling is not supported.
Perform a global deployment after the completion of each maintenance window.
Ensure that you do not remove more than one device at a time from the auto scale group (AWS) or scale set (Azure). We also
recommend that you run the cluster disable command on the device before removing the device from the auto scale group (AWS) or scale set (Azure).
If you want to disable data nodes and the control node in a cluster, we recommend that you disable the data nodes before disabling
the control node. If a control node is disabled while there are other data nodes in the cluster, one of the data nodes has
to be promoted to be the control node. Note that the role change could disturb the cluster.
In the day 0 configuration scripts given in this guide, you can change the IP addresses as per your requirement, provide custom
interface names, and change the sequence of the CCL-Link interface.
Defaults for Clustering
The cLACP system ID is auto-generated, and the system
priority is 1 by default.
The cluster health check feature is enabled by default with the holdtime of 3
seconds. Interface health monitoring is enabled on all interfaces by
default.
The cluster auto-rejoin feature for a failed cluster control link is
unlimited attempts every 5 minutes.
The cluster auto-rejoin feature for a failed data interface is 3 attempts
every 5 minutes, with the increasing interval set to 2.
Connection replication delay of 5 seconds is enabled by default for HTTP
traffic.
Deploy the Cluster in AWS
To deploy a cluster in AWS, you can either manually deploy or use CloudFormation
templates to deploy a stack. You can use the cluster with AWS Gateway Load Balancer, or
with a non-native load-balancer such as the Cisco Cloud Services Router.
AWS Gateway Load Balancer and Geneve Single-Arm Proxy
Note
This use case is the only currently supported use case for Geneve interfaces.
The AWS Gateway Load Balancer combines a transparent network gateway and a load balancer that distributes traffic and scales
virtual appliances on demand. The ASA Virtual supports the Gateway Load Balancer centralized control plane with a distributed
data plane (Gateway Load Balancer endpoint). The following figure shows traffic forwarded to the Gateway Load Balancer from
the Gateway Load Balancer endpoint. The Gateway Load Balancer balances traffic among multiple ASA Virtuals, which inspect
the traffic before either dropping it or sending it back to the Gateway Load Balancer (U-turn traffic). The Gateway Load Balancer
then sends the traffic back to the Gateway Load Balancer endpoint and to the destination.
Figure 1. Geneve Single-Arm Proxy
Sample Topologies
ASA
Virtual Clustering with Autoscale in Single and Multiple Availability Zones of an AWS Region
An availability zone is a standalone data center or a set of independent data centers within an AWS region that operate independently.
Each zone has its own networking infrastructure, connectivity, and power source ensuring a failure in one zone does not affect
others. To improve redundancy and reliability, companies use multiple availability zones in their disaster recovery plans.
Deploying ASA
Virtual across multiple availability zones and configuring clustering with dynamic scaling can significantly enhance the availability
and scalability of your infrastructure. In addition, utilizing multiple availability zones in the same region can offer extra
redundancy and guarantee high availability in the event of a failure.
You can modify the IP allocation mechanism of Cluster Control Link (CCL) to support both single and multiavailability zone
deployments of ASA
Virtual clusters on AWS. The topologies given below depict both inbound and outbound traffic flow in a single and multiple availability
zones with autoscaling ability.
ASA
Virtual Clustering with Autoscale in Single Availability Zone
There are two ASA
Virtual instances in the cluster that are connected to a GWLB.
Inbound traffic from the internet goes to the GWLB endpoint, which is then transmits the traffic to the GWLB. Traffic is then
forwarded to the ASA
Virtual cluster. After the traffic is inspected by an ASA
Virtual instance in the cluster, it is forwarded to the application VM, App1.
Outbound traffic from App1 is transmitted to the GWLB endpoint > GWLB > ASAv > GWLB > GWLB Endpoint, which then sends it out
to the internet.
ASA
Virtual Clustering with Autoscale in Multiple Availability Zones with Autoscale Solution
There are two ASA
Virtual instances in the cluster in different availability zones that are connected to a GWLB.
Inbound traffic from the internet goes to the GWLB endpoint, which then transmits the traffic to the GWLB. Based on the availability
zone, the traffic is then routed to the ASA
Virtual cluster. After the traffic is inspected by an ASA
Virtual instance in the cluster, it is forwarded to the application VM, App1.
End-to-End Process for Deploying ASA Virtual Cluster on AWS
Template-based Deployment
The following flowchart illustrates the workflow for template-based deployment of the ASA Virtual cluster on AWS.
The templates given below are available in GitHub. The parameter values are self-explanatory with the parameter names, default
values, allowed values, and description, given in the template.
Ensure that you check the list of supported AWS instance types before deploying cluster nodes. This list is found in the deploy_asav_clustering.yaml template, under allowed values for the parameter InstanceType.
Configure Target Failover for ASA
Virtual Clustering with GWLB in AWS
ASA virtual clustering in AWS utilizes the Gateway Load Balancer (GWLB) to balance and forward network packets for inspection to a designated
ASA virtual node. The GWLB is designed to continue sending network packets to the target node in the event of a failover or deregistration
of that node.
The Target Failover feature in AWS enables GWLB to redirect network packets to a healthy target node in the event of node
deregistration during planned maintenance or a target node failure. It takes advantage of the cluster's stateful failover.
Note
If a target node fails while the GWLB routes traffic using SSH, SCP, CURL, or other protocols, then there may be a delay in
redirecting traffic to a healthy target. This delay is caused due to rebalancing and rerouting of traffic flow.
In AWS, you can configure Target Failover through the AWS ELB API or AWS console.
AWS API - In the AWS Elastic Load Balancing (ELB) API - modify-target-group-attributes you can define the flow handling behavior by modifying the following two new parameters.
target_failover.on_unhealthy - It defines how the GWLB handles the network flow when the target becomes unhealthy.
target_failover.on_deregistration - It defines how the GWLB handles the network flow when the target is deregistered.
The following command shows the sample API parameter configuration of defining these two parameters.
Modify infrastructure.yaml and deploy_asav_clustering.yaml with the required parameters.
Create a file named cluster_layer.zip to provide essential Python libraries to the Lambda functions.
We recommend to use the Amazon Linux with Python 3.9 installed to create the cluster_layer.zip file.
Note
If you need an Amazon Linux environment, you can create an EC2 instance using Amazon Linux 2023 AMI or use AWS Cloudshell,
which runs the latest version of Amazon Linux.
For creating the cluster-layer.zip file, you need to first create requirements.txt file that consists of the python library package details and then run the shell script.
Create the requirements.txt file by specifying the python package details.
The following is the sample package details that you provide in the requirements.txt file:
If you encounter a dependency conflict error during installation, such as urllib3 or cryptography, it is recommended that
you include the conflicting packages along with their recommended versions in the requirements.txt file. After that, you can run the installation again to resolve the conflict.
Copy the resulting cluster_layer.zip file to the lambda python files folder.
Create the configure_asav_cluster.zip and lifecycle_asav_cluster.zip files
A make.py file can be found in the cloned repository top directory. This will zip the python files into a Zip file and copy
to a target folder.
python3 make.py build
Note
Before cluster deployment, ensure that you have customized the AWS CFT template files - infrastructure.yaml and deploy_asav_clustering.yaml for your infrastructure requirement like VPC, Subnets,S3 buckets required for the ASAv clustering autoscale deployment.
Step 2
Deploy infrastructure.yaml and note the output values for the cluster deployment. Before deploying the infrastructure stack, it is important to identify the AWS region and the availability zones that will
be used. Each AWS region has a different set of availability zones and VPC infrastructure, therefore it is essential to select
the correct region and availability zones for your deployment.
On the AWS console, go to CloudFormation and click Create stack; select With new resources(standard).
Select Upload a template file, click Choose file, and select infrastructure.yaml from the target folder.
Click Next and provide the required information.
Parameter
Allowed Values/Type
Description
ClusterName
String
Enter unique Cluster name.
ClusterNumber
Number
Enter unique Cluster number.
VpcCidr
String
Enter the CIDR block for a new VPC.
NoOfAZs
Number
Total Number of Availability Zones into which subnet will be created (Minimum 1 and Maximum 3 depending on Region).
Please select NoOfAZs = 2 or 3 only for releases 9.22 and above. For lower releases, select 1.
Management, Inside, and CCL subnets will span across AZs based on below parameter.
ListOfAZs
List
Select Availability Zones (Count should match with Number of Availability Zones)
MgmtSubnetNames
CommaDelimitedList
Enter Management subnets name (With Internet GW as Route)
MgmtSubnetCidrs
CommaDelimitedList
Enter Management subnets Cidr
InsideSubnetNames
CommaDelimitedList
Enter Inside subnets name (With Private Route)
InsideSubnetCidrs
CommaDelimitedList
Enter Inside subnets Cidr list
CCLSubnetNames
CommaDelimitedList
Enter CCL subnet name
CCLSubnetCidrs
CommaDelimitedList
Enter CCL subnet CIDR
LambdaAZs
List
Select 2 Availability Zones for Lambda
LambdaSubnetNames
CommaDelimitedList
Enter Lambda Subnets name (With NAT GW as Route), for Lambda Functions
LambdaSubnetCidrs
CommaDelimitedList
Enter Lambda Subnet CIDRs
Enter a unique Cluster Name and Cluster Number for the cluster.
Select the availability zone from the Availability Zone list. This field lists only availability zones based on the AWS region that you select for deploying the infrastructure stack
using the ClusterFormation template.
Enter the predefined subnet CIDR values separated by a comma in the Inside subnet CIDR field.
Choose the availability zones required for Lambda to communicate across availability zones from the List of Lambda AZs.
Click Next, and then Create stack.
The CREATE_COMPLETE message indicating the infrastructure stack deployment status is displayed.
After the deployment is complete, go to Outputs and note the S3 BucketName.
Figure 2. Output of infrastructure.yaml
Step 3
Upload cluster_layer.zip, configure_asav_cluster.zip, and lifecycle_asav_cluster.zip to the S3 bucket created by infrastructure.yaml.
Step 4
Deploy deploy_asav_clustering.yaml:
Go to CloudFormation, click Create stack, and select With new resources(standard).
Click Upload a template file, and Choose file, and select deploy_asav_clustering.yaml from the target folder.
Click Next and provide the required information.
Provide the following cluster and infrastructure configuration information.
Parameter
Allowed Values/Type
Description
Cluster Configuration
ClusterGrpNamePrefix
String
This is the cluster name Prefix. The cluster number will be added as a suffix.
ClusterNumber
String
This will be suffixed to Cluster Group Name (ASAv-Cluster), if this value is 1 then, group name will be ASAv-Cluster-1. It
should be at least one numerical digit but not more than three digits.
ClusterSize
Numbers
Total Number of ASA Virtual Nodes in the Cluster.
Minimum: 1
Maximum:16
Infrastructure Details
NoOfAZs
String
This is the total number of availability zones into which ASA Virtual is deployed. (The number of availability zones varies
from a Minimum 1 to Maximum 3 depending on a region).
The subnet will be created in these availability zones.
The availability zones available in this list is based on the region selected for deploying the cluster.
Note
Management, Inside, and Cluster Control Link (CCL) subnets are created across three availability zones based on this parameters.
AZ
String
The availability zone list is based on the region you plan to deploy.
In Availability Zone list, select the valid availability zone (1 availability zone or 2 availability zones or 3 availability
zones).
Count should match with the value of Number of Availability Zones parameter.
NotifyEmailID
String
Email address to which cluster events email will be sent. You must accept a subscription email request to receive this email
notification.
Example: admin@company.com
VpcId
String
The VPC ID for the cluster group.
Type: AWS::EC2::VPC::Id
S3BktName
String
The S3 Bucket that contains the uploaded Lambda zip files. You must specify correct bucket name.
MgmtSubnetIds
List
Enter only one subnet per availability zone.
If you select multiple subnets from a same availability zone, then selecting an incorrect subnet may cause issues while deploying
the ASA Virtual instances.
Type: List<AWS::EC2::Subnet::Id>
InsideSubnetIds
List
Enter at least one subnet per availability zone.
If multiple subnets from the same Availability Zone are selected, then selecting an incorrect subnet may cause issues while
deploying the ASA Virtual instances.
Type: List<AWS::EC2::Subnet::Id>
LambdaSubnets
List
Enter at least two subnet for the Lambda functions. The two subnets you enter must have a NAT gateway to enable the Lambda functions to communicate with AWS services, which are public
DNS.
Type: List<AWS::EC2::Subnet::Id>
CCLSubnetIds
String
Select subnets from multiple AZs as required.
CCLSubnetRanges
String
Enter IP addresses range of CCL subnets for different availability zones.
Exclude first 4 reserved IP addresses. IP address pool for Cluster Control Link (CCL).
IP address is allocated to the CCL interfaces of ASA virtual from CCL IP Pool.
MgmtInterfaceSG
List
Select security group ID for the ASA Virtual instances.
Type: List<AWS::EC2::SecurityGroup::Id>
InsideInterfaceSG
List
Select security group ID for NGFWv instances inside interface.
Make sure of adding Security Group for all AZs provided.
Type: List<AWS::EC2::SecurityGroup::Id>
LambdaSG
List
Select a security group for the Lambda functions.
Ensure outbound connections is set to ANYWHERE.
Type: List<AWS::EC2::SecurityGroup::Id>
CCLInterfaceSG
List
Select a security group ID for CCL interface of the ASA Virtual instances.
GWLB Configuration
DeployGWLBE
String
Click Yes to deploy the GWLB endpoint.
By default, the value is set to No.
VpcIdLBE
String
Enter VPC to deploy Gateway Load Balancer Endpoint.
Note
Do not enter any value in this field if you are not deploying the GWLB endpoint.
GWLBESubnetId
String
Enter only one subnet ID.
Note
Do not enter any value in this field if you are not deploying the GWLB endpoint.
Ensure that the subnet belongs to the correct VPC, and the availability zones that you have specified.
TargetFailover
String
Enable Target Failover support when a target fails or deregisters. (By default, the value of this parameter is set to rebalance).
no_rebalance: Directs existing flows to failed targets and new flows to healthy targets, ensuring backward compatibility.
rebalance: Redistributes existing flows while ensuring that new flows go to healthy targets.
TgHealthPort
String
Enter Health Check Port for GWLB.
Note
By default, this port must not be used for traffic.
Ensure the value you provide is a valid TCP port. Default: 8080
Cisco NGFWv Instance Configuration
InstanceType
String
Cisco ASA Virtual EC2 instance type.
Ensure that the AWS Region supports Instance Type you select.
By default, c5.xlarge is selected.
LicenseType
String
Choose Cisco ASA Virtual EC2 instance license type. Ensure that the AMI ID that you enter in AMI-ID parameter is of the same licensing type.
By default, BYOL is selected.
AssignPublicIP
String
Set the value as true to assign a public IP address for ASA Virtual from the AWS IP address pool.
AmiID
String
Choose the correct AMI ID as per the region, version, and license type (BYOL or PAYG).
Type: AWS::EC2::Image::Id
KmsArn
String
Enter ARN of an existing KMS (AWS KMS key to encrypt at rest).
If you specify a value in this field, then the ASA Virtual instance's admin password must be an encrypted password.
Example of generating an encrypted password: "aws kms encrypt --key-id <KMS ARN> --plaintext <password> "
The password encryption must be done using only the specified ARN.
Scaling Configuration
CpuThresholds
CommaDelimitedList
(Optional) Specifying non-zero lower and upper thresholds will create scale policies. If (0,0) is selected, no CPU scaling
alarm or policies will be created. Evaluation points and data points are at default or recommended values.
By default, Autoscale is enabled in this template. Autoscale can be disabled after deployment.
Click Next.
Click to acknowledge all the AWS CloudFormation options.
Click Submit to deploy the cluster.
Click Next, and then Create Stack.
Figure 3. Deployed Resources
The status changes from CREATE_IN_PROGRESS to CREATE COMPLETE indicating successful deployment.
Step 5
Verify the cluster deployment by logging in to any one of the nodes and entering the show cluster info command:
show cluster info

Cluster oneclicktest-cluster: On
Interface mode: individual
Cluster Member Limit : 16
This is "200" in state CONTROL_NODE
ID : 0
Version : 9.19.1
Serial No.: 9AU42EN5D1E
CCL IP : 1.1.1.200
CCL MAC : 4201.0a0a.0fc7
Module : ASAv
Resource : 4 cores / 8192 MB RAM
Last join : 15:26:22 UTC Jul 17 2022
Last leave: N/A
Other members in the cluster:
Unit "204" in state DATA_NODE
ID : 1
Version : 9.19.1
Serial No.: 9AJ9N46947R
CCL IP : 1.1.1.204
CCL MAC : 4201.0a0a.0fcb
Module : ASAv
Resource : 4 cores / 8192 MB RAM
Last join : 16:57:42 UTC Jul 17 2022
Last leave: 16:03:25 UTC Jul 17 2022
Autoscale Parameter Configuration
After the deployment is completed, you must specify Minimum, Maximum, and Desired capacity of the ASAv Autoscale group. You must verify the Autoscale functionality.
Procedure
Step 1
From the AWS console, choose Services > EC2 > Auto Scaling groups > Created ClusterAutoscale group.
Step 2
Configure Desired capacity, and then set the Scaling limits capacity.
Step 3
Check if the CPU metric data is available and whether scaling is occurring as expected in AWS Cloudwatch alarms.
Configure IMDSv2 Required Mode in ASA Virtual Clustering by Updating Stack
You can configure the IMDSv2 Required mode for the ASA Virtual Auto Scale group instances that are already deployed on the
AWS.
Before you begin
The IMDSv2 Required mode is only supported in ASA Virtual Version 9.20.3 and later. Ensure that your existing instances' version
is compatible (upgraded to Version 9.20.3 and later) with IMDSv2 APIs before configuring the IMDSv2 Required mode for your
deployment.
Procedure
Step 1
From the AWS console, go to CloudFormation and click Stacks.
Step 2
Select the stack of the intially deployed clustering instances.
Step 3
Click Update.
Step 4
In the Update stack page, click Replace existing template.
Step 5
Under Specify template section, click Upload a template file.
Step 6
Choose and upload the template that supports IMDSv2.
Step 7
Provide values for the input parameters in the template.
Step 8
Update the stack.
Deploy the Cluster in AWS Manually
To deploy the cluster manually, prepare the Day-0 configuration, and deploy each node.
Create Day-0 Configuration for AWS
Provide the bootstrap configuration for each cluster node using the following commands:
Gateway Load Balancer Example
The following running configuration example creates a configuration for a Gateway Load Balancer with one Geneve interface
for U-turn traffic and one VXLAN interface for the cluster control link.
cluster interface-mode individual force
policy-map global_policy
class inspection_default
no inspect h323 h225
no inspect h323 ras
no inspect rtsp
no inspect skinny

int m0/0
management-only
nameif management
security-level 100
ip address dhcp setroute
no shut

interface TenGigabitEthernet0/0
nameif geneve-vtep-ifc
security-level 0
ip address dhcp
no shutdown

interface TenGigabitEthernet0/1
nve-only cluster
nameif ccl_link
security-level 0
ip address dhcp
no shutdown

interface vni1
description Clustering Interface
segment-id 1
vtep-nve 1

interface vni2
proxy single-arm
nameif ge
security-level 0
vtep-nve 2

object network ccl_link
range 10.1.90.4 10.1.90.254 //Mandatory user input, use same range on all nodes
object-group network cluster_group
network-object object ccl_link
nve 2
encapsulation geneve
source-interface geneve-vtep-ifc
nve 1
encapsulation vxlan
source-interface ccl_link
peer-group cluster_group

cluster group asav-cluster // Mandatory user input, use same cluster name on all nodes
local-unit 1 //Value in bold here must be unique to each node
cluster-interface vni1 ip 1.1.1.1 255.255.255.0 //Value in bold here must be unique to each node
priority 1
enable noconfirm

mtu geneve-vtep-ifc 1806
mtu ccl_link 1960
aaa authentication listener http geneve-vtep-ifc port 7575 //Use same port number on all nodes
jumbo-frame reservation
wr mem
Note
For the AWS health check settings, be sure to specify the aaa
authentication listener http port you set here.
Non-Native Load Balancer Example
The following example creates a configuration for use with non-native load balancers with management, inside, and outside
interfaces, and a VXLAN interface for the cluster control link.
cluster interface-mode individual force
interface Management0/0
management-only
nameif management
ip address dhcp

interface GigabitEthernet0/0
no shutdown
nameif outside
ip address dhcp

interface GigabitEthernet0/1
no shutdown
nameif inside
ip address dhcp

interface GigabitEthernet0/2
nve-only cluster
nameif ccl_link
ip address dhcp
no shutdown

interface vni1
description Clustering Interface
segment-id 1
vtep-nve 1

jumbo-frame reservation
mtu ccl_link 1654
object network ccl_link
range 10.1.90.4 10.1.90.254          //mandatory user input
object-group network cluster_group
network-object object ccl_link

nve 1
encapsulation vxlan
source-interface ccl_link
peer-group cluster_group

cluster group asav-cluster          //mandatory user input
local-unit 1                        //mandatory user input
cluster-interface vni1 ip 10.1.1.1 255.255.255.0  //mandatory user input
priority 1
enable
Note
If you are copying and pasting the configuration given above, ensure that you remove //mandatory user input from the configuration.
Deploy Cluster Nodes
Deploy the cluster nodes to form a cluster.
Procedure
Step 1
Deploy the ASA Virtual instance by using the cluster day 0 configuration with the required number of interfaces - three interfaces
if you are using Gateway Load Balancer (GWLB), or four interfaces if you are using non-native load balancer. To do this, in
the Configure Instance Details > Advanced Details section, paste the cluster day 0 configuration.
Note
Ensure that you attach interfaces to the instances in the order given below.
AWS Gateway load balancer - three interfaces - management, outside, and cluster control link.
Non-native load balancers - four interfaces - management, inside, outside, and cluster control link.
Repeat Step 1 to deploy the required number of additional nodes.
Step 3
Use the show cluster info command on the ASA Virtual console to verify if all nodes have successfully joined the cluster.
Step 4
Configure the AWS Gateway Load Balancer.
Create a target group and GWLB.
Attach the target group to the GWLB.
Note
Ensure that you configure the GWLB to use the correct security group, listener configuration, and health check settings.
Register the data interface (inside interface) with the Target Group using IP addresses. For more information, see Create a Gateway Load Balancer.
Enable Target Failover for ASA virtual in AWS
The data interface of ASA virtual is registered to a target group of GWLB in AWS. In the ASA virtual clustering, each instance is associated with a Target Group. The GWLB load balances and sends the traffic to this healthy
instance identified or registered as a target node in the target group.
Before you begin
You must have deployed the ASA virtual stack in AWS either by manual method or using CloudFormation templates.
If you are deploying a cluster using a CloudFormation template, you can also enable the Target Failover parameter by assigning the rebalance attribute that is available under the GWLB Configuration section of the cluster deployment file deploy_asav_clustering.yaml. In the template, by default, the value is set to rebalance for this parameter. However, the default value for this parameter is set to no_rebalance on the AWS console.
Where,
no_rebalance - GWLB continues to send the network flow to the failed or deregistered target.
rebalance - GWLB sends the network flow to another healthy target when the existing target is failed or deregistered.
Click Target Groups to view the target groups page.
Step 3
Choose and open the target group to which the ASA virtual instances IP addresses are registered. The target group details page is displayed.
Step 4
Go to the Attributes menu.
Step 5
Click Edit to edit the attributes.
Step 6
Toggle the Rebalance flows slider button to the right. This enables the target failover to configure GWLB to rebalance and forward the existing network
packets to a healthy target node in the event of target failover or deregisteration.
Deploy the Cluster in Azure
In an Azure service chain, ASA virtual acts as a transparent gateway that can intercept packets between the internet and customer
service. The clustering of ASA virtual instances on Azure helps to scale up the throughput of multi-node ASAv’s by abstracting
them as a single device.
The ASAv consists of two logical interfaces - an External Interface facing the Internet and an Internal Interface facing customer service. These interfaces are defined on a single Network Interface Card (NIC) of the ASAv by utilizing VXLAN
segments in a paired proxy.
About Azure Gateway Load Balancer
Azure Gateway Load Balancer (GWLB), help you balance and manage inbound and outbound traffic by routing through the VXLAN
segments to the ASAv for traffic inspection. In an ASAv cluster environment, the Azure GWLB automatically scale up the throughput
level of the ASAv nodes depending on the traffic load. The GWLB can ensure symmetrical flows or a consistent route to the
network virtual appliance without having to update routes manually. With this capability, the packets can traverse the same
network path in both directions.
The following figure shows traffic forwarded to the Azure GWLB from the Public Gateway Load Balancer on the external VXLAN
segment. The Gateway Load Balancer primarily balances traffic across among multiple ASAv, which inspects the traffic before either dropping it or sending it
back to the GWLB on the internal VXLAN segment. The Azure GWLB then sends the traffic back to the Public Gateway Load Balancer
and the destination.
The following figure illustrated the network flow between GWLB and ASAv in Azure.
Figure 4. ASAv Clustering on Azure with GWLB
About Cluster Deployment in Azure
You can use the customized Azure Resource Manager (ARM) template to deploy the Virtual Machine Scale Set for Azure GWLB .
After the cluster deployment, you can configure each node on the cluster either manually by using the day0 configuration or
through the Function app on the Azure portal.
Deploy the Cluster Using an Azure Resource Manager Template
Deploy the cluster nodes (virtual machine scale set) so they form a cluster using Azure Resource Manager (ARM) template.
To configure cluster on ASAv nodes in Azure, you can either manually configure using a configuration file or using the Azure
Function App. You can use the cluster with native GWLB .
Prepare the Configuration File for Creating Cluster on Azure
You can manually configure a cluster on ASA Virtual nodes using the configuration file or the Function App on the Azure portal.
For manual configuration of the cluster on an ASA Virtual node, you must have configured the asav-gwlb-cluster-config.txt
. In this file, you must define the parameters such as range objects, day0, cluster group name, licensing type and so on that
is configured in the ASA Virtual node of cluster.
This section explains about creating a cluster configuration file for configuring ASA Virtual nodes in Azure with GWLB .
Procedure
Step 1
Download the asav-gwlb-cluster-config.txt
from the Cisco GitHub repository directory asav-cluster/sample-config-file.
Step 2
You can prepare the day0 configuration for cluster creation.
The following sample day0 configuration helps you understand the parameters required for cluster creation in Azure with GWLB.
Sample Day0 configuration for GWLB cluster creation
The following is the sample day0 configuration required in the asav-gwlb-cluster-config.txt file used for GWLB cluster creation.
cluster interface-mode individual force
            policy-map global_policy
            class inspection_default
            no inspect h323 h225
            no inspect h323 ras
            no inspect rtsp
            no inspect skinny

        interface GigabitEthernet0/0
            nameif vxlan_tunnel
            security-level 0
            ip address dhcp
            no shutdown

        interface GigabitEthernet0/1
            nve-only cluster
            nameif ccl_link
            security-level 0
            ip address dhcp
            no shutdown

        interface vni1
            description ClusterInterface
            segment-id 1
            vtep-nve 1

        interface vni2
            proxy paired
            nameif GWLB-backend-pool
            internal-segment-id 800
            external-segment-id 801
            internal-port 2000
            external-port 2001
            security-level 0
            vtep-nve 2

        object network ccl#link
            range <CCLSubnetStartAddress> <CClSubnetEndAddress>
            object-group network cluster#group
            network-object object ccl#link

        nve 1
            encapsulation vxlan
            source-interface ccl_link
            peer-group cluster#group

        nve 2
            encapsulation vxlan
            source-interface vxlan_tunnel
            peer ip <GatewayLoadbalancerIp>

        mtu vxlan_tunnel 1454
        mtu ccl_link 1374
        cluster group <ClusterGroupName>
        local-unit <Last Octet of CCL Interface IP>
        cluster-interface vni1 ip 1.1.1.<Last Octet of CCL Interface IP> 255.255.255.0
        priority 1
        enable
In the above sample day0 configuration, when the Encapsulation type is mentioned as vxlan, the GWLB-related configuration is enabled. The InternalPort and ExternalPort are used for the vxlan tunnel interface configuration, while the InternalSegId and ExternalSegId are used as an identifier for internal and external interfaces.
Note
In the day0 configuration, you must specify the starting address (<CCLSubnetStartAddress>) and ending addresses of the cluster control link. Accordingly, the StartAddress must always start with x.x.x.4 and EndAddress must be in the optimal range. It is recommended to specify only the required number of addresses (up to 16) because adding
a large range of addresses might affect the performance.
For example: If the CCL subnet is 192.168.3.0/24, the StartAddress will be 192.168.3.4 and the EndAddress can be 192.168.3.30.
The following is the the sample configuration required for the vni interface.
Upload the configuration file to the Azure storage and note the path (URL) of this location. This URL path is required for
the manual configuration of the cluster on ASA Virtual nodes.
Configure Cluster using Configuration File Manually
To configure cluster on ASAv nodes in Azure manually using a configuration file.
Before you begin
You must have prepared the configuration file and noted the Azure storage location where it is uploaded. See Prepare Cluster
Configuration File for Azure.
Procedure
Step 1
Log in to the Azure portal.
Step 2
Open an ASAv instance deployed on Azure.
Step 3
Run the following command to copy the cluster configuration file to the ASAv node by providing the URL of the file that you
have uploaded to the Azure storage container.
copy <Config File URL> running-config
Step 4
Run the following command to configure the cluster on the ASAv instances
cluster group <ClusterGroupName>
         local-unit <Last Octet of the Management Interface IP>
         cluster-interface vni1 ip 1.1.1.<Last Octet of the Management Interface IP> 255.255.255.0
         priority 1
         enable
Step 5
Repeat steps 2 through 4 to configure the cluster on all the ASAv nodes.
Configure Cluster using Azure Function App
To configure cluster on ASAv nodes in Azure using Azure Function App service.
Procedure
Step 1
Log in to the Azure portal.
Step 2
Click the Function App.
Step 3
Create FTPS Credentials by clicking Deployment Center > FTPS credentials > User scope > Configure Username and Password > , and then click Save.
Step 4
Upload the Cluster_Function.zip file to the function app by executing the following command in the local terminal.
The function will be uploaded to the Function app. The function will start, and you can see the logs in the storage account’s
outqueue.
The cluster will be enabled on all the ASAv nodes after the function execution.
Troubleshooting ASA Virtual Cluster in Azure
Traffic Issues
If the traffic is not working, then verify the following:
Verify the health probe status of the ASA virtual instances with the Loadbalancer is healthy.
If the ASA virtual instance's health probe status is unhealthy, then perform the following:
Verify the Static route configured in ASA virtual.
Verify default gateway is data subnet's gateway IP.
Ensure that the ASA virtual instance receives the health probe traffic.
Verify the Access policy configured in the ASA virtual is allowing the health probe traffic.
Cluster Issues
If the Cluster is not formed, then verify the following:
IP address of the Network Virtualization Endpoint (NVE-only) cluster interface. Ensure that you can ping the NVE-only cluster
interface of other nodes.
IP address of the NVE-only cluster interfaces are part of the object group. Ensure the NVE is configure with the object group.
The cluster interface in the cluster group has the correct VNI interface. This VNI interface has the NVE of the corresponding
object group.
Each node has its own IP interface, verify that the nodes should be able to ping each other to ensure connectivity between
the nodes in a cluster.
Verify the CCL subnet's Start and End Addresses mentioned during the template deployment is correct. The starting address
must begin with the first available IP address in the subnet. For example, if the subnet is 192.168.1.0/24. The start address
should be 192.168.1.4 (The first three IP addresses are reserved by azure)
Role Related Issues
If there is any role-related error while deploying resources again in the same resource group, then perform the following:
When there is any issue related a specific roles, an error message is displayed.
The following is a sample error message.
"error": {
"code": "RoleAssignmentUpdateNotPermitted",
"message": "Tenant ID, application ID, principal ID, and scope are not allowed to be updated.”}
Remove the following roles by executing the following commands from the terminal.
Command to remove Storage Queue Data Contributor role:
az role assignment delete --resource-group <Resource Group Name> --role "Storage Queue Data Contributor"
Command to remove Contributor role:
az role assignment delete --resource-group <Resource Group Name> --role "Contributor"
ASA
Virtual Clustering Autoscale Solution on Azure
A typical cluster deployment in an Azure region includes a defined number of ASA
Virtual instances (nodes). When the Azure region traffic varies, without dynamic scaling (autoscale) of the nodes, resource utilization
in such cluster arrangement may underutilise the resources or cause latency. Cisco offers an autoscale solution for ASA
Virtual clustering in Version 9.23 and later that supports dynamic scaling of nodes in the Azure region. It allows you to scale-in
or scale-out nodes from the cluster based on the network traffic. It uses logic based on the resource utilization statistics
from Azure VMSS metrics such as CPU and memory metrics to dynamically add or remove a node from a cluster.
The ASA
Virtual clustering with Autoscale solution in Azure supports both Network Load Balancer (NLB or Sandwich topology) and Gateway Load
Balancer (GWLB). See Sample Topologies
Cisco provides separate Azure Resource Manager (ARM) templates for deploying ASA
Virtual cluster with autoscale in Azure using NLB and GWLB, as well as infrastructure and configuration templates for deploying the
Azure services such as Function App and Logic App.
Sample Topologies
ASA
Virtual Clustering with Autoscale in Azure using Sandwich Topology (Network Load Balancer)
The ASA
Virtual clustering with autoscale in Azure using sandwich topology (NLB) use case is an automated horizontal scaling solution that
positions the ASA
Virtual scale set sandwiched between an Azure Internal load balancer (ILB) and an Azure External load balancer (ELB).
In this topology, the ASA
Virtual uses only four interfaces: management, inside, outside, and CCL subnets.
ASA
Virtual Clustering with Autoscale in Azure using Sandwich Topology (NLB)
The following describes high-level flow on how a ASA
Virtual cluster with autoscale in Azure using NLB functions:
The ELB distributes traffic from the internet to the ASA
Virtual instances in the scale set, and then the firewall forwards traffic to the application.
The ILB distributes outbound internet traffic from an application to ASA
Virtual instances in the scale set and then the firewall forwards traffic to the internet.
A network packet will never pass through both (Internal and External) load balancers in a single connection.
The number of ASA
Virtual instances in the scale set will be scaled and configured automatically based on load conditions.
ASA
Virtual Clustering with Autoscale in Azure using Gateway Load Balancer
The integration of the Azure Gateway Load Balancer (GWLB) and ASA
Virtual cluster using autoscale solution simplifies deployment, management, and scaling of instances in the cluster setup. The Azure
Gateway Load Balancer (GWLB) ensures that internet traffic to and from an Azure VM, such as an application server, is inspected
by secure firewall without requiring any routing changes. This integration also reduces operational complexity and provides
a single entry and exit point for traffic at the firewall. The applications and infrastructure can maintain visibility of
source IP address, which is critical in some environments.
The ASA
Virtual uses only three interfaces: management, data, and CCL interface in this use case.
Note
Network Address Translation (NAT) is not required if you are deploying the Azure GWLB.
Only IPv4 is supported.
The following describes high-level flow on how a ASA
Virtualcluster with autoscale in Azure using GWLB functions:
Inbound traffic from the internet goes to the GWLB endpoint, which then transmits the traffic to the GWLB.
The traffic is then routed to the ASA
Virtual cluster. The autoscale solution applies scale-in or scale-out logic to add or remove nodes from the cluster based on the
traffic load.
After the traffic is inspected by the ASA
Virtual instance in the cluster, it is forwarded to the application Application VM.
Autoscale Logic for ASA
Virtual Clustering in Azure
Scaling Policy
In a cluster with autoscale, the scaling of nodes is determined based on the following policies:
Scaling policy 1 - When one cluster node exceeds the resource utilization limits.
Scaling policy 2 - Overall average resource utilization of all the nodes.
Scale-out
Scale-out is a process of adding a new node to the cluster when the traffic load threshold exceeds the configured CPU or memory
limit on any one of the cluster's node.
The following is the process of adding a new node to the cluster during scale-out:
A new ASA
Virtual instance is launched.
Appropriate configuration is applied to a ASA
Virtual.
Appropriate licenses are applied.
A new ASA
Virtual instance is added to the cluster.
If the configuration of the new ASA
Virtual instance fails (low probability) during the scale-out process, the failing instance is terminated, and a new instance is
launched and configured.
Scale-in
Scale-in is the process of removing a node from a cluster when the configured scale-in threshold and total number of cluster
instances exceed the minimum cluster size.
The following is the process of terminating a node in the cluster during scale-in:
The ASA
Virtual instance with the least CPU or memory usage is identified using VMSS metrics.
If there is more than one instance with the same least utilization, then the instance with the higher VM index in VMSS is
chosen for scale-in.
Any new connections to this instance are disabled by appropriate configuration and policies.
The instance is de-registered from smart licensing (applicable for BYOL).
The instance is terminated.
Azure Functions (Function App)
The Function application helps to enable and register the ASA
Virtual cluster. The Function application also help you select a hosting plan for ASA
Virtual clustering with autoscale deployment.
The following two types of hosting plans are offered:
Consumption
This is the default hosting plan for ASA
Virtual clustering with autoscale.
This plan allows the Function app to connect to the ASA
Virtual instances by opening the SSH port to the Azure data center IP addresses of the region.
Premium
You can select this hosting plan for the Function app during deployment.
This plan supports adding a Network Address Translation (NAT) gateway to the Function app to control the outbound IP address
of the Function app. This plan allows SSH access to ASA
Virtual instances only from a fixed IP address of the NAT gateway thereby offering enhanced security.
Deployment and Infrastructure Templates on GitHub
Cisco provides Azure Resource Manager (ARM) templates and scripts for deploying a Virtual Machine Scale Set (VMSS) of ASA
Virtual cluster using several Azure services, including Function App, Logic App, auto-scaling groups and so on.
The autoscale solution for ASA
Virtual cluster is an ARM template-based deployment that provides support for GWLB and NLB load balancers.
ASA
Virtual Clustering with Autoscale Solution Templates
Azure Resource Manager (ARM) templates
Two sets of templates are provided for autoscale solutions based on the (NLB or GWLB) load balancer you are using in Azure
for the cluster.
The following templates are available on GitHub:
Autoscale solution template for ASA
Virtual clustering using NLB: azure_asav_nlb_cluster_autoscale.json available in the folder azure_autoscale_clustering/asav_cluster/arm_templates/
Autoscale solution template for ASA
Virtual clustering using GWLB: azure_asav_gwlb_cluster_autoscale.json available in the folder azure_autoscale_clustering/asav_cluster/arm_templates/
Azure Infrastructure and Configuration Templates on GitHub
The following are the templates required for setting up Azure infrastructure for clustering with autoscale on Azure.
Function app to enable cluster on ASA
Virtual instances: cluster_functions.zip available in the folder azure_autoscale_clustering/asav_cluster/azure_function_app.
Logic App code for the ASA
Virtual deployment, scale-in and scale-out workflow: logic_app.txt available in the folder azure_autoscale_clustering/asav_cluster/logic_app/.
Input Parameters
The following table defines the template parameters and provides an example. Once you
decide on these values, you can use these parameters to create the ASA
Virtual when you deploy the Azure Resource Manager (ARM)
template into your Azure subscription.In the clustering with autoscale soultion
with GWLB for Azure, networking infrastructure is also created due to which
additional input parameters have to be configured in the template. The parameter
descriptions are self-explanatory.
Table 2. Template Parameters
Parameter Name
Allowed Values/Type
Description
Resource Creation Type
resourceNamePrefix
String* (3-10 characters)
All the resources are created with name containing this prefix.
Note: Use only lowercase letters.
Example: asav
New
virtualNetworkRg
String
The virtual network resource group name.
Example: cisco-virtualnet-rg
Existing
virtualNetworkName
String
The virtual network name (already created).
Example: cisco-virtualnet
Existing
mgmtSubnet
String
The management subnet name (already created).
Example: cisco-mgmt-subnet
Existing
dataSubnet
String
The data subnet name (already created)
Example: cisco-data-subnet
cclSubnet
String
The cluster control link subnet name.
Example: cisco-ccl-subnet
cclSubnetStartAddr
String
The starting range of CCL subnet IP address.
Example: 3.4.5.6
cclSubnetEndAddr
String
The ending range of CCL subnet IP address.
Example: 5.6.7.8
gwlbIP
String
GWLB is created in existing data subnet.
Example: 10.0.2.4
dataNetworkGatewayIp
String
The gateway IP address of the data subnet.
Example: 10.0.2.7
insideSubnet
String
The inside Subnet name (already created).
Example: cisco-inside-subnet
Existing
internalLbIp
String
The internal load balancer IP address for the inside subnet (already created).
Example: 1.2.3.4
Existing
outsideSubnet
String
The outside subnet name (already created).
Example: cisco-outside-subnet
Existing
softwareVersion
String
The ASA
Virtual Version (selected from drop-down list during deployment).
Existing
vmSize
String
Size of ASA
Virtual instance (selected from drop-down list during deployment).
N/A
asaAdminUserName
String*
User name for the ASA
Virtual 'admin' user.
This cannot be ‘admin’. See Azure for VM administrator user name guidelines.
Note
There is no compliance check for this in the template.
New
asaAdminUserPassword
String*
Password for the ASA
Virtual administrator user.
Passwords must be 12 to 72 characters long, and must have: lowercase, uppercase, numbers, and special characters; and must
have no more than 2 repeating characters.
Note
There is no compliance check for this in the template.
New
clusterGroupName
String
The name of the cluster group to be used while registering the ASA virtual device.
Example: asav-cluster
asaLicensingSku
String
The licensing mode (PAYG or BYOL) of ASA Virtual.
healthCheckPortNumber
String
The health check port number used while creating the health probe in the Gateway Load balancer.
Example: 8080
functionHostingPlan
String
Function deployment hosting plan (consumption uses the consumption hosting plan, premium: uses the premium hosting plan).
Default: consumption
functionAppSubnet
String
The function app subnet name (already created).
Example: asav-fapp-subnet
functionAppSubnetCIDR
String
The CIDR of the function app subnet (already created).
Example: 10.0.4.0/24
scalingMetricsList
String
The metrics used in determining the scaling the scaling decision.
Allowed: CPU
scalingPolicy
POLICY-1 / POLICY-2
POLICY-1: Scale-Out will be triggered when the average load of any ASA
Virtual goes beyond the Scale Out threshold for the configured duration.
POLICY-2: Scale-Out will be triggered when average load of all the ASA
Virtual devices in the VMSS goes beyond the Scale Out threshold for the configured duration.
In both cases Scale-In logic remains the same: Scale-In will be triggered when average load of all the ASA
Virtual devices comes below the Scale In threshold for the configured duration.
N/A
scalingMetricsList
String
Metrics used in making the scaling decision.
Allowed: CPU
Default: CPU
N/A
scaleInThreshold
String
The scale-in threshold in percentage.
Default: 10
When the ASA
Virtual metric goes below this value the scale-in will be triggered.
N/A
scaleOutThreshold
String
The Scale-out threshold in percentage .
Default: 80
When the ASA
Virtual metric goes above this value, the Scale-Out will be triggered.
The ‘scaleOutThreshold’ should always be greater than the ‘scaleInThreshold’.
N/A
asavClusterSize
String
The default node count of ASA Virtual instances available in the scale set at any given time.
Example: 4
minAsaCount
Integer
The minimum ASA
Virtual instances available in the scale set at any given time.
Example: 2
N/A
maxAsaCount
Integer
The maximum ASA
Virtual instances allowed in the Scale set.
Example: 10
Note
The Auto Scale logic will not check the range of this variable, hence fill this carefully.
N/A
metricsAverageDuration
Integer
Select from the drop-down.
This number represents the time (in minutes) over which the metrics are averaged out.
If the value of this variable is 5 (i.e. 5min), when the Auto Scale Manager is scheduled it will check the past 5 minutes
average of metrics and based on this it will make a scaling decision.
Note
Only numbers 1, 5, 15, and 30 are valid due to Azure limitations.
N/A
initDeploymentMode
BULK / STEP
Primarily applicable for the first deployment, or when the Scale Set does not contain any ASA
Virtual instances.
BULK: The Auto Scale Manager will try to deploy 'minAsaCount' number of ASA
Virtual instances in parallel at one time.
STEP: The Auto Scale Manager will deploy the 'minAsaCount' number of ASA
Virtual devices one by one at each scheduled interval.
smartLicenseToken
String
The smart license token for registering the ASA
Virtual.
licenseThroughput
String
The smart license entitlement tier for the ASA
Virtual.
asavConfigFileUrl
String
The file path to the ASA
Virtual configuration file.
Make sure the configuration file is accessible from the ASAv.
N/A
*Azure has restrictions on the naming convention for new resources. Review the limitations or simply use all lowercase. Do not use spaces or any other special characters.
ASA
Virtual Cluster with Autoscale Deployment Process and Resources
ASA
Virtual cluster with autoscale deployment process on Azure involves the following:
Deploy the ARM template.
Build and deploy the clustering function.
Update and enable the Logic application.
The following resources are created within a resource group when you deploy ASA
Virtual cluster with autoscale in Azure using the ARM template for Sandwich Topology (NLB) - azure_asav_nlb_cluster_autoscale.json
Virtual Machine Scale Set (VMSS)
External Load Balancer
Internal Load Balancer
Azure Function App
Logic App
Security groups (For Data and Management interfaces)
The following resources are created within a resource group when you deploy ASA
Virtual cluster with autoscale in Azure using the ARM template for GWLB - azure_asav_gwlb_cluster_autoscale.json
Virtual Machine (VM) or Virtual Machine Scale Set (VMSS)
Gateway Load Balancer (GWLB)
Azure Function App
Logic App
Networking Infrastructure
Security Groups and other miscellaneous components needed for deployment.
Deploy ASA
Virtual Cluster with Autoscale Solution
Deploy the ASA
Virtual clustering with autoscale solution on Azure using the ARM template. Based on the topology, Sandwich (NLB) or GWLB use case,
you are required to download and configure the appropriate ARM template for deploying the ASA
Virtual clustering with autoscale solution on Azure.
Before you begin
Download the Deployment Package from GitHub
The ASA
Virtual clustering autoscale with NLB solution for Azure is an Azure Resource Manager (ARM) template-based deployment which makes
use of the serverless infrastructure provided by Azure (Logic App, Azure Functions, Load Balancers, Virtual Machine Scale
Set, and so on).
The ASA
Virtual clustering autoscale with GWLB solution for Azure is an ARM template-based deployment that creates the GWLB, networking infrastructure,
virtual machine scale set, serverless components, and other required resources.
The deployment procedures for both solutions are similar.
Download the files required to launch the ASA
Virtual clustering with autoscale solution for Azure.
Deployment scripts and templates for your version are available in the GitHub repository.
Procedure
Step 1
Log in to the Microsoft Azure portal (https://portal.azure.com) using your Microsoft account username and password.
Step 2
Click Resource groups from the menu of services to access the Resource Groups blade. You will see all the resource groups in your subscription listed in the blade. Create a new resource group or select
an existing, empty resource group. For example,secure-firewall-asav-demo.
Step 3
Click Create a resource (+) to create a new resource for template deployment. The Create Resource Group blade appears.
Step 4
Click Virtual Network from the menu of services to access the Virtual network blade. Create a virtual network with subnets.
For GWLB deployment, create virtual network with management, data, and CCL subnets.
For NLB deployment, create virtual network with management, inside, outside, and CCL subnets.
Step 5
In Search the Marketplace, type Template deployment (deploy using custom templates), and then press Enter.
Step 6
Click Create. There are several options for creating a template. Choose Build your own template in editor.
Step 7
In the Edit template window, delete all the default content and copy the contents from the updated azure_asav_gwlb_cluster_custom_image.json or azure_asav_nlb_cluster_custom_image.json (depending on the type of autoscale solution you are deploying on Azure) and click Save. Or Click Load file to browse and upload this file from your computer.
Step 8
In the parameter field sections, fill all the parameters. Refer to Input Parameters for details about each parameter, then click Review+Create.
Step 9
When a template deployment is successful, it creates all the required resources for the ASA
Virtual auto scale for Azure solution. The Type column describes each resource, including the Logic App, VMSS, Load Balancers, Public
IP address, etc.
Deploy the Azure Cluster Autoscale Function to the Function App
After the ARM template deployment is complete, the function app is created with the name <resourceNamePrefix>-function-app. After the function app is created, perform the steps given below to deploy the Azure cluster autoscale function to the function
app.
Procedure
Step 1
On your local computer, go to the target folder and run the following command to deploy the Azure cluster autoscale function
to the function app.
az functionapp deployment source config-zip -g <Resource Group Name> -n <Function App Name> --src <cluster_functions.zip> --build-remote true
Step 2
Verify successful deployment of the functions by checking if the uploaded functions are visible in the Overview section of the function app as shown below.
Update the Azure Logic App
The Logic App acts as the orchestrator for the Autoscale functionality. The ARM template creates a skeleton Logic App, which
you then need to update manually to provide the information necessary to function as the auto scale orchestrator.
Procedure
Step 1
From the repository, retrieve the file LogicApp.txt to the local system and edit as shown below.
Important
Read and understand all of these steps before proceeding.
These manual steps are not automated in the ARM template so that only the Logic App can be upgraded independently later in
time.
Find and replace all the occurrences of “SUBSCRIPTION_ID” with your subscription ID information.
Find and replace all the occurrences of “RG_NAME” with your resource group name.
Find and replace all of the occurrences of “FUNCTIONAPPNAME” to your function app name.
The following example shows a few of these lines in the LogicApp.txt file:
(Optional) Edit the trigger interval, or leave the default value (5). This is the time interval at which the Autoscale functionality
is periodically triggered. The following example shows these lines in the LogicApp.txt file:
(Optional) Edit the time to drain, or leave the default value (5). This is the time interval to drain existing connections from the ASA virtual before deleting the device during the Scale-In operation. The following example shows these lines in the LogicApp.txt file:
(Optional) Edit the cool down time, or leave the default value (10). This is the time to perform NO ACTION after the Scale-Out is complete.
The following example shows these lines in the LogicApp.txt file:
These steps can also be done from the Azure portal. Consult the Azure documentation for more information.
Step 2
Go to the Logic App code view, delete the default contents and paste the contents from the edited LogicApp.txt file, and click Save.
Figure 8. Logic App Code View
Step 3
When you save the Logic App, it is in a 'Disabled' state. Click Enable when you want to start the Auto Scale Manager.
Figure 9. Enable Logic App
Step 4
Once enabled, the tasks start running. Click the 'Running' status to see the activity.
Figure 10. Logic App Running Status
Step 5
Once the Logic App starts, all the deployment-related steps are complete.
Step 6
Verify in the VMSS that ASA virtual instances are being created.
Figure 11. ASA Virtual Instances Running
In this example, three ASA virtual instances are launched because 'minAsaCount' was set to '3' and 'initDeploymentMode' was set to 'BULK' in the ARM template deployment.
ASA Virtual Clustering with Autoscale Solution in GCP
From Release 9.24.1, the ASA Virtual clustering solution in Google Cloud Platform (GCP) is enhanced with dynamic autoscaling
capabilities. The autoscale solution is based on CPU utilization metrics and helps to achieve optimal resource usage. It is
deployed using Terraform-based templates.
You can choose the scaling option as either dynamic clustering or fixed-node clustering, depending on your requirements. You
can also define the CPU threshold value, beyond which scaling will be initiated.
Sample Topology of GCP Clustering Autoscale Solution
Figure 12. Sample Topology
The topology shows both inbound and outbound traffic flow.
The ASA Virtual cluster is placed between the internal and external load balancers.
Inbound traffic from the internet goes to the external load balancer, which then transmits the traffic to the ASA Virtual
cluster.
The ASA Virtual instance in the cluster inspects the traffic, and after inspection, forwards the traffic to the application
VM.
Outbound traffic from the application VM goes to the internal load balancer. The load balancer forwards this traffic to the
ASA Virtual cluster, which sends it to the internet.
Requirements and Prerequisites
This section lists the requirements and supported configurations for ASA Virtual clustering autoscale solution on GCP .
Model Requirements
Supported ASA Virtual models:
A valid Google Cloud Platform (GCP) account is required.
Google Cloud SDK must be installed locally, or you should have access to GCP Cloud Shell.
Licensing
The license entitlement of the control node applies to all data nodes in a cluster, regardless of their initial performance
tier configuration during boot-up.
After cluster formation, changing the performance tier of any individual ASA Virtual is not allowed.
By default, each unit includes a 100 kbps evaluation license.
License behavior after deregistration:
Until reboot: The unit retains the existing throughput.
After reboot: The throughput reverts to the default 100 kbps.
Only BYOL (Bring Your Own License) license type is supported.
PAYG (Pay-As-You-Go) license type is not supported.
Supported configurations
Cluster size: 1-16 nodes.
Traffic topologies: North-South and East-West.
Deployment mode: Deployment using Terraform templates.
Templates
The following templates are available on GitHub.
infrastructure/main.tf – Template for infrastructure deployment.
cluster_deployment/main.tf – Template for cluster deployment.
Deploying ASA Virtual Clustering Autoscale Solution on GCP
There are two steps in the deployment process:
Infrastructure deployment (optional) – to deploy the required network infrastructure.
Cluster deployment – to deploy the ASA Virtual cluster.
Note
If you choose to use your own infrastructure for deploying the ASA Virtual, then you can skip the infrastructure deployment
step. However, it is essential to make sure that all the required resources are provided for the proper functioning of the
solution.
Infrastructure Deployment Parameters
The following parameters are used for the infrastructure deployment:
Table 3. List of template parameters for infrastructure deployment (infrastructure_params.tfvars)
Parameter
Description
Example
project_id
GCP project ID
test-project-12345
resource_name_prefix
String (lowercase alphabets only.)
demoasav
region
GCP region to deploy
us-central1
mgmt_ip_cidr_range
Mgmt Subnet CIDR
10.112.0.0/24
vpc_connector_ip_cidr_range
Mgmt VPC Connector CIDR /28 subnet only
10.112.50.0/28
inside_ip_cidr_range
Inside Subnet CIDR
10.112.1.0/24
outside_ip_cidr_range
Outside Subnet CIDR
10.112.2.0/24
ccl_ip_cidr_range
CCL Subnet CIDR (/27 subnet recommended)
10.112.100.0/27
Deploy Infrastructure Using Terraform on GCP
The GCP Infrastructure Manager facilitates Terraform deployments as a stack. From this interface, you can manage resources
and perform cleanups.
Procedure
Step 1
Navigate to the GCP console and log in using your credentials.
Step 2
Open Cloud Shell or local terminal.
If you are using local terminal, make sure that GCP CLI is configured on your system.
Step 3
Create a new directory.
Example:
Use the command mkdir infra to create a directory named infra in Cloud Shell or your local terminal.
Step 4
Navigate to the newly created directory.
Example:
Use the command cd infra to change to the new directory.
Step 5
Copy or download the infrastructure_params.tfvars file from Cisco GitHub repository and save it to the new infra folder.
Name of the Terraform deployment stack that will be shown in GCP Infrastructure Manager.
location
The location or region where the deployment will be applied.
git-source-repo
The name of the Git repository that contains the source code (Cisco GitHub Link).
git-source-directory
The directory in the Git repository where the infrastructure code is located.
git-source-ref
The branch name in the Git repository to be used for the deployment.
service-account
Name of the service account.
artifacts-gcs-bucket
The Google Cloud Storage bucket to store artifacts related to the deployment (optional).
inputs-file
The file path to the input parameters for the infrastructure configuration.
Note
If you do not use the template to deploy the infrastructure, then you must provide the following resources for proper deployment
and functioning of the solution.
Management VPC
Management Subnet
Management Subnet for VPC connector
Management Firewall rule name
Inside VPC
Inside Subnet
Inside firewall rule name
Outside VPC
Outside Subnet
Outside Firewall rule name
Nat GW
CCL VPC
CCL Subnet
CCL firewall rule name.
Diagnostic VPC (optional)
Diagnostic Firewall rule name
VPC Connector with management subnet
Cluster Deployment Parameters
The following input parameters are used to deploy the cluster.
Table 5. List of template parameters for cluster deployment
Parameter
Description
Example
Project configuration
project_id
The GCP project ID
test-project-12345
resource_name_prefix
Prefix for naming resources
democluster
type_of_deployment
Type of deployment (north_south or east_west)
north_south
region
GCP region
us-east1
zone1
Deployment zone
a
zone2
Deployment zone
b
zone3
Deployment zone
c
VM configuration
machine_type
VM instance type
n1-standard-4
source_image_url
URL of the source image
projects/my-project/global/images/my-image
assign_public_ip_to_mgmt
Whether to assign a public IP to the management interface (true/false)
false
public_key
SSH public key for authentication
ssh-rsa AAAAB3NzaC1yc2EAAAADAQABAAABAQ...
service_account_mail_id
Service account email
service-account-mail@example-
project.iam.gserviceaccount.com
asav_password_secret_name
Secret name for ASAv password
asav_password_secret in GCP Secret Manager
asav_en_password_secret_name
Secret name for ASAv encrypted password
asav_en_password_secret" in GCP Secret Manager
VPC configuration
mgmt_vpc_name
Management VPC name
<resource_name_prefix>-mgmt-vpc
mgmt_subnet_name
Management subnet name
<resource_name_prefix>-mgmt-subnet
inside_vpc_name
Inside VPC name
<resource_name_prefix>-inside-vpc
inside_subnet_name
Inside subnet name
<resource_name_prefix>-inside-subnet
outside_vpc_name
Outside VPC name
<resource_name_prefix>-outside-vpc
outside_subnet_name
Outside subnet name
<resource_name_prefix>-outside-subnet
ccl_vpc_name
Name of the clustering VPC
<resource_name_prefix>-ccl-vpc
ccl_subnet_name
Name of the clustering subnet
<resource_name_prefix>-ccl-subnet
vpc_connector_name
Name of the VPC connector
my-vpc-connector
Firewall rules
ccl_firewall_rule_name
Name of the clustering firewall rule
<resource_name_prefix>-mgmt-firewall-rule
mgmt_firewall_rule_name
Name of the management firewall rule
<resource_name_prefix>-mgmt-firewall-rule
inside_firewall_rule_name
Name of the inside firewall rule
<resource_name_prefix>-in-firewall-rule
outside_firewall_rule_name
Name of the outside firewall rule
<resource_name_prefix>-out-firewall-rule
Cluster
cluster_grp_name
Name of the cluster group
cluster-group-name
ccl_subnet_firstIp
First IP address in the clustering subnet
10.0.0.1
ccl_subnet_lastIp
Last IP address in the clustering subnet
10.0.0.254
Autoscaling configuration
auto_scaling
Enable or disabling autoscaling
true/false
cpu_utilization_target
Target CPU utilization for autoscaling [0.0-1.0]
0.2
min_asa_count
Minimum number of ASA Virtual instances in the autoscaling group
1
max_asa_count
Maximum number of ASA Virtual instances in the autoscaling group
2
Internal Load Balancer configuration
ilb_frontend_protocol
Frontend protocol (TCP/UDP)
TCP
ilb_backend_protocol
Backend protocol
TCP
ilb_health_check_port
ILB Health-check balancer port
80
ilb_timeout_sec
Load balancer timeout (seconds)
5
ilb_check_interval_sec
Interval between health checks for ILB (seconds)
10
ilb_unhealthy_threshold
Unhealthy threshold for the internal load balancer
3
External Load Balancer configuration
elb_frontend_protocol
Frontend protocol name for External Load Balancer (TCP/UDP)
TCP
elb_backend_protocol
Backend protocol name for External Load Balancer (TCP/UDP/UNSPECIFIED)
TCP
elb_front_end_ports
List of ELB frontend (listener) ports
all or [80, 443]
elb_health_check_port
ELB health-check port
80
elb_timeout_sec
Load balancer timeout (seconds)
5
elb_unhealthy_threshold
Unhealthy threshold for the external load balancer
2
elb_check_interval_sec
Interval between health checks for ELB (seconds)
10
Licensing
license_throughput
Throughput for the license
10G
license_id_token
License ID token
my-license-id-token
Deploy Cluster Using Terraform on GCP
The GCP Infrastructure Manager facilitates Terraform deployments as a stack. From this interface, you can manage resources
and perform cleanups.
Procedure
Step 1
Navigate to the GCP console and log in using your credentials.
Step 2
Open Cloud Shell or local terminal.
If you are using local terminal, make sure that GCP CLI is configured on your system.
Step 3
Create a new directory.
Example:
Use the command mkdir cluster to create a directory named cluster in Cloud Shell or your local terminal.
Step 4
Navigate to the newly created directory.
Example:
Use the command cd cluster to change to the new directory.
Step 5
Copy or download the cluster_params.tfvars file from Cisco GitHub repository and save it to the new cluster folder.
Step 6
Open the cluster_params.tfvars file and update all the placeholder values as required. Refer to Cluster Deployment Parameters.
Step 7
Use the following commands after updating placeholder values to start the deployment.
Check the IP address of NVE-only cluster interface. Make sure you can ping the NVE-only cluster interface of other nodes.
Make sure that the IP addresses of the NVE-only cluster interfaces are part of the object group.
Make sure that the NVE (Network Virtualization Edge) interface is configured with the corresponding object group.
Make sure that the cluster interface in the cluster group has the correct VNI (Virtual Network Identifier) interface. This
VNI interface should have the NVE with the corresponding object group.
Each node has its own cluster interface IP address. Make sure the nodes can ping each other to verify connectivity.
Customize the Clustering Operation
You can customize clustering health monitoring, TCP connection replication delay, flow
mobility and other optimizations, either as part of the Day 0 configuration or after you
deploy the cluster.
Perform these procedures on the control node.
Configure Basic ASA Cluster Parameters
You can customize cluster settings on the control node.
Procedure
Step 1
Enter cluster configuration mode:
cluster groupname
Step 2
(Optional) Enable console replication from data nodes to the control node:
console-replicate
This feature is disabled by default. The ASA prints out some messages
directly to the console for certain critical events. If you enable console
replication, data nodes send the console messages to the control node so
that you only need to monitor one console port for the cluster.
Step 3
Set the minimum trace level for clustering events:
trace-levellevel
Set the minimum level as desired:
critical—Critical events (severity=1)
warning—Warnings (severity=2)
informational—Informational events
(severity=3)
debug—Debugging events (severity=4)
Step 4
Set the keepalive interval for flow state refresh messages (clu_keepalive and
clu_update messages) from the flow owner to the director and backup owner.
clu-keepalive-intervalseconds
seconds—15 to 55. The default is 15.
You may want to set the interval to be longer than the default to reduce the
amount of traffic on the cluster control link.
Step 5
Enable concurrent join.
concurrent-join
This feature is enabled by default. When enabled, cluster nodes join
concurrently instead of sequentially. If you have NAT and VPN distributed
mode enabled, you cannot use concurrent join. To view incompatible
configuration, enter show cluster info concurrent-join
incompatible-config.
Example:
ciscoasa(cfg-cluster)# concurrent-join
ciscoasa(cfg-cluster)# show cluster info concurrent-join incompatible-config

INFO: Clustering is not compatible with following commands. User must
manually remove them to activate the cluster concurrent-join feature.
nat (gre_outside,gre_inside) source static any interface destination static interface any unidirectional

ciscoasa(cfg-cluster)# no nat (gre_outside,gre_inside) source static any interface destination static interface any unidirectional
ciscoasa(cfg-cluster)# show cluster info concurrent-join incompatible-config

INFO: No concurrent-join incompatible config found.
Configure Health Monitoring and Auto-Rejoin
Settings
This procedure configures node and interface health monitoring.
You might want to disable health monitoring of non-essential interfaces, for example,
the management interface. Health monitoring is not performed on VLAN subinterfaces.
You cannot configure monitoring for the cluster control link; it is always
monitored.
Procedure
Step 1
Enter cluster configuration mode.
cluster groupname
Example:
ciscoasa(config)# cluster group test
ciscoasa(cfg-cluster)#
Step 2
Customize the cluster node health check feature.
health-check [holdtimetimeout]
To determine node health, the ASA cluster nodes send heartbeat messages on
the cluster control link to other nodes. If a node does not receive any
heartbeat messages from a peer node within the holdtime period, the peer
node is considered unresponsive or dead.
holdtimetimeout—Determines the amount of time between
node heartbeat status messages, between .3 and 45 seconds; The
default is 3 seconds.
When any topology changes occur (such as adding or removing a data interface,
enabling or disabling an interface on the ASA or the switch) you should
disable the health check feature and also disable interface monitoring for
the disabled interfaces (no health-check
monitor-interface). When the topology change is complete,
and the configuration change is synced to all nodes, you can re-enable the
health check feature.
Example:
ciscoasa(cfg-cluster)# health-check holdtime 5
Step 3
Configure the CPU usage threshold to suspend the health check on the cluster
control link.
cpu-healthcheck-thresholdpercent
percent—Between 70 and 100. The default is 90.
When a cluster node CPU usage is high, the health check will be suspended,
and the node will not be marked as unhealthy.
Step 4
Disable the interface health check on an interface.
nohealth-checkmonitor-interfaceinterface_id
The interface health check monitors for link failures.
The amount of time before the ASA removes a member from the cluster depends
on whether the node is an established member or is joining the cluster.
Health check is enabled by default for all interfaces. You can disable it
per interface using the no form of this
command. You might want to disable health monitoring of non-essential
interfaces, for example, the management interface.
interface_id—Disables monitoring of an
interface. Health monitoring is not performed on VLAN subinterfaces.
You cannot configure monitoring for the cluster control link; it is
always monitored.
When any topology changes occur (such as adding or removing a data interface,
enabling or disabling an interface on the ASA or the switch) you should
disable the health check feature (no health-check)
and also disable interface monitoring for the disabled interfaces. When the
topology change is complete, and the configuration change is synced to all
nodes, you can re-enable the health check feature.
Example:
ciscoasa(cfg-cluster)# no health-check monitor-interface management1/1
Step 5
Customize the auto-rejoin cluster settings after a health check failure.
system—Specifies the auto-rejoin settings
for internal errors. Internal failures include: application sync
timeout; inconsistent application statuses; and so on.
unlimited—(Default for the
cluster-interface) Does not limit
the number of rejoin attempts.
auto-rejoin-max—Sets the number of rejoin
attempts, between 0 and 65535. 0 disables
auto-rejoining. The default for the
data-interface and
system is 3.
auto_rejoin_interval—Defines the interval
duration in minutes between rejoin attempts, between 2 and 60. The
default value is 5 minutes. The maximum total time that the node
attempts to rejoin the cluster is limited to 14400 minutes (10 days)
from the time of last failure.
auto_rejoin_interval_variation—Defines if
the interval duration increases. Set the value between 1 and 3:
1 (no change);
2 (2 x the previous duration), or
3 (3 x the previous duration). For
example, if you set the interval duration to 5 minutes, and set the
variation to 2, then the first attempt is after 5 minutes; the 2nd
attempt is 10 minutes (2 x 5); the 3rd attempt 20 minutes (2 x 10),
and so on. The default value is 1 for the
cluster-interface and 2 for the
data-interface and system.
Set the debounce time between 300 and 9000 ms. The default is 500 ms. Lower
values allow for faster detection of interface failures. Note that
configuring a lower debounce time increases the chances of false-positives.
When an interface status update occurs, the ASA waits the number of
milliseconds specified before marking the interface as failed and the node
is removed from the cluster.
frequencyseconds—Sets the time in seconds between
monitoring messages, between 10 and 360 seconds. The default is 20
seconds.
intervalsintervals—Sets the number of intervals for
which the ASA maintains data, between 1 and 60. The default is
30.
You can monitor the traffic load for cluster members, including total
connection count, CPU and memory usage, and buffer drops. If the load is too
high, you can choose to manually disable clustering on the node if the
remaining nodes can handle the load, or adjust the load balancing on the
external switch. This feature is enabled by default. You can periodically
monitor the traffic load. If the load is too high, you can choose to
manually disable clustering on the node.
Use the show cluster info load-monitor command to
view the traffic load.
Example:
ciscoasa(cfg-cluster)# load-monitor frequency 50 intervals 25
ciscoasa(cfg-cluster)# show cluster info load-monitor
ID  Unit Name
0  B
1  A_1
Information from all units with 50 second interval:
Unit     Connections    Buffer Drops   Memory Used   CPU Used
Average from last 1 interval:
   0           0            0            14              25
   1           0            0            16              20
Average from last 25 interval:
   0           0            0            12              28
   1           0            0            13              27
Example
The following example configures the health-check holdtime to .3 seconds; disables
monitoring on the Management 0/0 interface; sets the auto-rejoin for data interfaces
to 4 attempts starting at 2 minutes, increasing the duration by 3 x the previous
interval; and sets the auto-rejoin for the cluster control link to 6 attempts every
2 minutes.
ciscoasa(config)# cluster group test
ciscoasa(cfg-cluster)# health-check holdtime .3
ciscoasa(cfg-cluster)# no health-check monitor-interface management0/0
ciscoasa(cfg-cluster)# health-check data-interface auto-rejoin 4 2 3
ciscoasa(cfg-cluster)# health-check cluster-interface auto-rejoin 6 2 1
Manage Cluster Nodes
After you deploy the cluster, you can change the configuration and manage cluster nodes.
Become an Inactive Node
To become an inactive member of the cluster, disable clustering
on the node while leaving the clustering configuration intact.
Note
When an ASA becomes inactive (either manually or through a
health check failure), all data interfaces are shut down; only the
management-only interface can send and receive traffic. To resume traffic flow,
re-enable clustering; or you can remove the node altogether from the cluster.
The management interface remains up using the IP address the node received from
the cluster IP pool. However if you reload, and the node is still inactive in
the cluster (for example, you saved the configuration with clustering disabled),
then the management interface is disabled. You must use the console port for any
further configuration.
Procedure
Step 1
Enter cluster configuration mode:
cluster groupname
Example:
ciscoasa(config)# cluster group pod1
Step 2
Disable clustering:
noenable
If this node was the control node, a new control
election takes place, and a different member becomes the control node.
The cluster configuration is maintained, so that you
can enable clustering again later.
Deactivate a Data Node from the Control Node
To deactivate a member other than the node you are logged into, perform
the following steps.
Note
When an ASA becomes inactive, all data interfaces are shut
down; only the management-only interface can send and receive traffic. To resume
traffic flow, re-enable clustering. The management interface remains up using
the IP address the node received from the cluster IP pool. However if you
reload, and the node is still inactive in the cluster (for example, if you saved
the configuration with clustering disabled), the management interface is
disabled. You must use the console port for any further configuration.
Procedure
Remove the node from the cluster.
cluster removeunitnode_name
The bootstrap configuration remains intact, as well as
the last configuration synched from the control node, so that you can later
re-add the node without losing your configuration. If you enter this command
on a data node to remove the control node, a new control node is elected.
To view member names, enter cluster remove unit ?, or enter the show
cluster info command.
Example:
ciscoasa(config)# cluster remove unit ?

Current active units in the cluster:
asa2

ciscoasa(config)# cluster remove unit asa2
WARNING: Clustering will be disabled on unit asa2. To bring it back
to the cluster please logon to that unit and re-enable clustering
Rejoin the Cluster
If a node was removed from the cluster, for example for a failed interface or if you
manually deactivated a member, you must manually rejoin the cluster.
Procedure
Step 1
At the
console, enter cluster configuration mode:
cluster groupname
Example:
ciscoasa(config)# cluster group pod1
Step 2
Enable clustering.
enable
Leave the Cluster
If you want to leave the cluster altogether, you need to remove
the entire cluster bootstrap configuration. Because the current configuration on
each node is the same (synced from the active unit), leaving the cluster also means
either restoring a pre-clustering configuration from backup, or clearing your
configuration and starting over to avoid IP address conflicts.
Procedure
Step 1
For a data node, disable clustering:
cluster groupcluster_name no enable
Example:
ciscoasa(config)# cluster group cluster1
ciscoasa(cfg-cluster)# no enable
You cannot make configuration changes while clustering
is enabled on a data node.
Step 2
Clear the cluster configuration:
clear configure cluster
The ASA shuts down all interfaces including the
management interface and cluster control link.
Step 3
Disable cluster interface mode:
no cluster interface-mode
The mode is not stored in the configuration and must be
reset manually.
Step 4
If you have a backup configuration, copy the backup
configuration to the running configuration:
If you do not have a backup configuration, reconfigure
management access. Be sure to change the interface IP addresses, and restore the
correct hostname, for example.
Change the Control Node
Caution
The best method to change the control node is to disable
clustering on the control node, wait for a new control election, and then
re-enable clustering. If you must specify the exact node you want to become the
control node, use the procedure in this section. Note, however, that for
centralized features, if you force a control node change using this procedure,
then all connections are dropped, and you have to re-establish the connections
on the new control node.
To change the control node, perform the following steps.
Procedure
Set a new node as the control node:
clustercontrol-nodeunitnode_name
Example:
ciscoasa(config)# cluster control-node unit asa2
You will need to reconnect to the Main cluster IP
address.
To view member names, enter cluster control-node unit ? (to see
all names except the current node), or enter the show cluster info command.
Execute a Command Cluster-Wide
To send a command to all nodes in the cluster, or to a specific
node, perform the following steps. Sending a show
command to all nodes collects all output and displays it on the console of the
current node. Other commands, such as capture and copy, can also take advantage of cluster-wide
execution.
Procedure
Send a command to all nodes, or if you specify the node
name, a specific node:
cluster exec [unitnode_name] command
Example:
ciscoasa# cluster exec show xlate
To view node names, enter cluster exec unit ? (to see all names except the current node), or
enter the show cluster info command.
Examples
To copy the same capture file from all nodes in the cluster at
the same time to a TFTP server, enter the following command on the control node:
Multiple PCAP files, one from each node, are copied to the TFTP
server. The destination capture file name is automatically attached with the node
name, such as capture1_asa1.pcap, capture1_asa2.pcap, and so on. In this example,
asa1 and asa2 are cluster node names.
Monitoring the Cluster
You can monitor and troubleshoot cluster status and connections.
Monitoring Cluster Status
See the following
commands for monitoring cluster
status:
show cluster info [health[details]]
With no keywords, the show cluster
info command shows the status of all members of the cluster.
The show cluster info health command
shows the current health of interfaces, nodes, and the cluster overall. The details keyword shows the number heartbeat message
failures.
See the following output for the show
cluster info command:
ciscoasa# show cluster info
Cluster stbu: On
  This is "C" in state DATA_NODE
      ID        : 0
      Site ID   : 1
            Version   : 9.4(1)
      Serial No.: P3000000025
      CCL IP    : 10.0.0.3
      CCL MAC   : 000b.fcf8.c192
      Last join : 17:08:59 UTC Sep 26 2011
      Last leave: N/A
Other members in the cluster:
  Unit "D" in state DATA_NODE
      ID        : 1
      Site ID   : 1
            Version   : 9.4(1)
      Serial No.: P3000000001
      CCL IP    : 10.0.0.4
      CCL MAC   : 000b.fcf8.c162
      Last join : 19:13:11 UTC Sep 23 2011
      Last leave: N/A
  Unit "A" in state CONTROL_NODE
      ID        : 2
      Site ID   : 2
            Version   : 9.4(1)
      Serial No.: JAB0815R0JY
      CCL IP    : 10.0.0.1
      CCL MAC   : 000f.f775.541e
      Last join : 19:13:20 UTC Sep 23 2011
      Last leave: N/A
  Unit "B" in state DATA_NODE
      ID        : 3
      Site ID   : 2
            Version   : 9.4(1)
      Serial No.: P3000000191
      CCL IP    : 10.0.0.2
      CCL MAC   : 000b.fcf8.c61e
      Last join : 19:13:50 UTC Sep 23 2011
      Last leave: 19:13:36 UTC Sep 23 2011
show cluster info auto-join
Shows whether the cluster node will automatically rejoin the cluster after a time delay
and if the failure conditions (such as waiting for the license, chassis health check
failure, and so on) are cleared. If the node is permanently disabled, or if the node is
already in the cluster, then this command will not show any output.
See the following outputs for the show cluster info auto-join command:
ciscoasa(cfg-cluster)# show cluster info auto-join
Unit will try to join cluster in 253 seconds.
Quit reason: Received control message DISABLE

ciscoasa(cfg-cluster)# show cluster info auto-join
Unit will try to join cluster when quit reason is cleared.
Quit reason: Control node has application down that data node has up.

ciscoasa(cfg-cluster)# show cluster info auto-join
Unit will try to join cluster when quit reason is cleared.
Quit reason: Chassis-blade health check failed.

ciscoasa(cfg-cluster)# show cluster info auto-join
Unit will try to join cluster when quit reason is cleared.
Quit reason: Service chain application became down.

ciscoasa(cfg-cluster)# show cluster info auto-join
Unit will try to join cluster when quit reason is cleared.
Quit reason: Unit is kicked out from cluster because of Application health check failure.

ciscoasa(cfg-cluster)# show cluster info auto-join
Unit join is pending (waiting for the smart license entitlement: ent1)

ciscoasa(cfg-cluster)# show cluster info auto-join
Unit join is pending (waiting for the smart license export control flag)
show cluster info transport {asp | cp [detail]}
Shows transport related statistics for the following:
asp —Data plane transport statistics.
cp —Control plane transport statistics.
If you enter the detail keyword,
you can view cluster reliable transport protocol usage so you can identify packet
drop issues when the buffer is full in the control plane. See the following output
for the show cluster info transport cp detail command:
ciscoasa# show cluster info transport cp detail
Member ID to name mapping:
  0 - unit-1-1   2 - unit-4-1   3 - unit-2-1

Legend:
  U    - unreliable messages
  UE   - unreliable messages error
  SN   - sequence number
  ESN  - expecting sequence number
  R    - reliable messages
  RE   - reliable messages error
  RDC  - reliable message deliveries confirmed
  RA   - reliable ack packets received
  RFR  - reliable fast retransmits
  RTR  - reliable timer-based retransmits
  RDP  - reliable message dropped
  RDPR - reliable message drops reported
  RI   - reliable message with old sequence number
  RO   - reliable message with out of order sequence number
  ROW  - reliable message with out of window sequence number
  ROB  - out of order reliable messages buffered
  RAS  - reliable ack packets sent

This unit as a sender
--------------------------
        all       0         2         3
  U     123301    3867966   3230662   3850381
  UE    0         0         0         0
  SN    1656a4ce  acb26fe   5f839f76  7b680831
  R     733840    1042168   852285    867311
  RE    0         0         0         0
  RDC   699789    934969    740874    756490
  RA    385525    281198    204021    205384
  RFR   27626     56397     0         0
  RTR   34051     107199    111411    110821
  RDP   0         0         0         0
  RDPR  0         0         0         0

This unit as a receiver of broadcast messages
---------------------------------------------
        0         2         3
  U     111847    121862    120029
  R     7503      665700    749288
  ESN   5d75b4b3  6d81d23   365ddd50
  RI    630       34278     40291
  RO    0         582       850
  ROW   0         566       850
  ROB   0         16        0
  RAS   1571      123289    142256

This unit as a receiver of unicast messages
---------------------------------------------
        0         2         3
  U     1         3308122   4370233
  R     513846    879979    1009492
  ESN   4458903a  6d841a84  7b4e7fa7
  RI    66024     108924    102114
  RO    0         0         0
  ROW   0         0         0
  ROB   0         0         0
  RAS   130258    218924    228303

Gated Tx Buffered Message Statistics
-------------------------------------
    current sequence number: 0

    total:                   0
    current:                 0
    high watermark:          0

    delivered:               0
    deliver failures:        0

    buffer full drops:       0
    message truncate drops:  0

    gate close ref count:    0

    num of supported clients:45

MRT Tx of broadcast messages
=============================
Message high watermark: 3%
  Total messages buffered at high watermark: 5677
  [Per-client message usage at high watermark]
  ---------------------------------------------------------------
  Client name                          Total messages  Percentage
  Cluster Redirect Client                        4153         73%
  Route Cluster Client                            419          7%
  RRI Cluster Client                             1105         19%

Current MRT buffer usage: 0%
  Total messages buffered in real-time: 1
  [Per-client message usage in real-time]
  Legend:
        F - MRT messages sending when buffer is full
        L - MRT messages sending when cluster node leave
        R - MRT messages sending in Rx thread
  ----------------------------------------------------------------------------
  Client name                          Total messages  Percentage    F   L   R
  VPN Clustering HA Client                          1        100%    0   0   0

MRT Tx of unitcast messages(to member_id:0)
============================================
Message high watermark: 31%
  Total messages buffered at high watermark: 4059
  [Per-client message usage at high watermark]
  ---------------------------------------------------------------
  Client name                          Total messages  Percentage
  Cluster Redirect Client                        3731         91%
  RRI Cluster Client                              328          8%

Current MRT buffer usage: 29%
  Total messages buffered in real-time: 3924
  [Per-client message usage in real-time]
  Legend:
        F - MRT messages sending when buffer is full
        L - MRT messages sending when cluster node leave
        R - MRT messages sending in Rx thread
  ----------------------------------------------------------------------------
  Client name                          Total messages  Percentage    F   L   R
  Cluster Redirect Client                        3607         91%    0   0   0
  RRI Cluster Client                              317          8%    0   0   0

MRT Tx of unitcast messages(to member_id:2)
============================================
Message high watermark: 14%
  Total messages buffered at high watermark: 578
  [Per-client message usage at high watermark]
  ---------------------------------------------------------------
  Client name                          Total messages  Percentage
  VPN Clustering HA Client                        578        100%

Current MRT buffer usage: 0%
  Total messages buffered in real-time: 0

MRT Tx of unitcast messages(to member_id:3)
============================================
Message high watermark: 12%
  Total messages buffered at high watermark: 573
  [Per-client message usage at high watermark]
  ---------------------------------------------------------------
  Client name                          Total messages  Percentage
  VPN Clustering HA Client                        572         99%
  Cluster VPN Unique ID Client                      1          0%

Current MRT buffer usage: 0%
  Total messages buffered in real-time: 0
show cluster history
Shows the cluster history, as
well as error messages about why a cluster node failed to join or why a node left the
cluster.
Capturing Packets Cluster-Wide
See the following
command for capturing
packets in a cluster:
cluster exec capture
To support cluster-wide troubleshooting, you can enable capture of
cluster-specific traffic on the control node using the cluster exec capture command, which is
then automatically enabled on all of the data nodes in the cluster.
Monitoring Cluster Resources
See the following command for monitoring
cluster resources:
show cluster {cpu | memory | resource} [options]
Displays aggregated data for the entire cluster. The
options available depends on the data type.
Monitoring Cluster Traffic
See the following commands
for monitoring cluster traffic:
show conn
[detail], cluster exec show conn
The show conn
command shows whether a flow is a director, backup, or
forwarder flow. Use the cluster
exec show conn command on any node to view all
connections. This command can show how traffic for a single
flow arrives at different ASAs in the cluster. The
throughput of the cluster is dependent on the efficiency and
configuration of load balancing. This command provides an
easy way to view how traffic for a connection is flowing
through the cluster, and can help you understand how a load
balancer might affect the performance of a flow.
The show conn detail command also
shows which flows are subject to flow mobility.
The following is sample output for the show conn detail command:
ciscoasa/ASA2/data node# show conn detail
12 in use, 13 most used
Cluster stub connections: 0 in use, 46 most used
Flags: A - awaiting inside ACK to SYN, a - awaiting outside ACK to SYN,
       B - initial SYN from outside, b - TCP state-bypass or nailed,
       C - CTIQBE media, c - cluster centralized,
       D - DNS, d - dump, E - outside back connection, e - semi-distributed,
       F - outside FIN, f - inside FIN,
       G - group, g - MGCP, H - H.323, h - H.225.0, I - inbound data,
       i - incomplete, J - GTP, j - GTP data, K - GTP t3-response
       k - Skinny media, L - LISP triggered flow owner mobility,
       M - SMTP data, m - SIP media, n - GUP
       O - outbound data, o - offloaded,
       P - inside back connection,
       Q - Diameter, q - SQL*Net data,
       R - outside acknowledged FIN,
       R - UDP SUNRPC, r - inside acknowledged FIN, S - awaiting inside SYN,
       s - awaiting outside SYN, T - SIP, t - SIP transient, U - up,
       V - VPN orphan, W - WAAS,
       w - secondary domain backup,
       X - inspected by service module,
       x - per session, Y - director stub flow, y - backup stub flow,
       Z - Scansafe redirection, z - forwarding stub flow
ESP outside: 10.1.227.1/53744 NP Identity Ifc: 10.1.226.1/30604, , flags c, idle 0s, uptime
1m21s, timeout 30s, bytes 7544, cluster sent/rcvd bytes 0/0, owners (0,255) Traffic received
at interface outside Locally received: 7544 (93 byte/s) Traffic received at interface NP
Identity Ifc Locally received: 0 (0 byte/s) UDP outside: 10.1.227.1/500 NP Identity Ifc:
10.1.226.1/500, flags -c, idle 1m22s, uptime 1m22s, timeout 2m0s, bytes 1580, cluster
sent/rcvd bytes 0/0, cluster sent/rcvd total bytes 0/0, owners (0,255) Traffic received at
interface outside Locally received: 864 (10 byte/s) Traffic received at interface NP Identity
Ifc Locally received: 716 (8 byte/s)
To troubleshoot the connection flow, first
see connections on all nodes by entering the cluster exec show conn
command on any node. Look for flows that have the following
flags: director (Y), backup (y), and forwarder (z). The
following example shows an SSH connection from
172.18.124.187:22 to 192.168.103.131:44727 on all three
ASAs; ASA 1 has the z flag showing it is a forwarder for the
connection, ASA3 has the Y flag showing it is the director
for the connection, and ASA2 has no special flags showing it
is the owner. In the outbound direction, the packets for
this connection enter the inside interface on ASA2 and exit
the outside interface. In the inbound direction, the packets
for this connection enter the outside interface on ASA 1 and
ASA3, are forwarded over the cluster control link to ASA2,
and then exit the inside interface on ASA2.
ciscoasa/ASA1/control node# cluster exec show conn
ASA1(LOCAL):**********************************************************
18 in use, 22 most used
Cluster stub connections: 0 in use, 5 most used
TCP outside  172.18.124.187:22 inside  192.168.103.131:44727, idle 0:00:00, bytes 37240828, flags z


ASA2:*****************************************************************
12 in use, 13 most used
Cluster stub connections: 0 in use, 46 most used
TCP outside  172.18.124.187:22 inside  192.168.103.131:44727, idle 0:00:00, bytes 37240828, flags UIO


ASA3:*****************************************************************
10 in use, 12 most used
Cluster stub connections: 2 in use, 29 most used
TCP outside  172.18.124.187:22 inside  192.168.103.131:44727, idle 0:00:03, bytes 0, flags  Y
show cluster
info [conn-distribution |
packet-distribution | loadbalance |
flow-mobility counters]
The show cluster
info conn-distribution and show cluster info
packet-distribution commands show traffic
distribution across all cluster nodes. These commands can
help you to evaluate and adjust the external load balancer.
The show cluster
info loadbalance command shows connection
rebalance statistics.
The show cluster info flow-mobility
counters command shows EID movement and flow
owner movement information. See the following output for
show cluster info flow-mobility counters:
ciscoasa# show cluster info flow-mobility counters
EID movement notification received  : 4
EID movement notification processed : 4
Flow owner moving requested         : 2
show cluster info load-monitor
[details]
The show cluster info load-monitor
command shows the traffic load for cluster members for the
last interval and also the average over total number of
intervals configured (30 by default). Use the
details keyword to view
the value for each measure at each interval.
ciscoasa(cfg-cluster)# show cluster info load-monitor
ID  Unit Name
0  B
1  A_1
Information from all units with 20 second interval:
Unit     Connections    Buffer Drops   Memory Used   CPU Used
Average from last 1 interval:
   0           0            0            14              25
   1           0            0            16              20
Average from last 30 interval:
   0           0            0            12              28
   1           0            0            13              27


ciscoasa(cfg-cluster)# show cluster info load-monitor details

ID  Unit Name
 0  B
 1  A_1
Information from all units with 20 second interval

Connection count captured over 30 intervals:
Unit ID  0
         0          0          0          0          0          0
         0          0          0          0          0          0
         0          0          0          0          0          0
         0          0          0          0          0          0
         0          0          0          0          0          0
Unit ID  1
         0          0          0          0          0          0
         0          0          0          0          0          0
         0          0          0          0          0          0
         0          0          0          0          0          0
         0          0          0          0          0          0

Buffer drops captured over 30 intervals:
Unit ID  0
         0          0          0          0          0          0
         0          0          0          0          0          0
         0          0          0          0          0          0
         0          0          0          0          0          0
         0          0          0          0          0          0
Unit ID  1
         0          0          0          0          0          0
         0          0          0          0          0          0
         0          0          0          0          0          0
         0          0          0          0          0          0
         0          0          0          0          0          0

Memory usage(%) captured over 30 intervals:
Unit ID  0
        25         25         30         30         30         35
        25         25         35         30         30         30
        25         25         30         25         25         35
        30         30         30         25         25         25
        25         20         30         30         30         30
Unit ID  1
        30         25         35         25         30         30
        25         25         35         25         30         35
        30         30         35         30         30         30
        25         20         30         25         25         30
        20         30         35         30         30         35

CPU usage(%) captured over 30 intervals:
Unit ID  0
        25         25         30         30         30         35
        25         25         35         30         30         30
        25         25         30         25         25         35
        30         30         30         25         25         25
        25         20         30         30         30         30
Unit ID  1
        30         25         35         25         30         30
        25         25         35         25         30         35
        30         30         35         30         30         30
        25         20         30         25         25         30
        20         30         35         30         30         35
To display the aggregated count of in-use
connections for all nodes, enter:
ciscoasa# show cluster conn count
Usage Summary In Cluster:*********************************************
  200 in use (cluster-wide aggregated)
     cl2(LOCAL):***********************************************************
  100 in use, 100 most used

  cl1:******************************************************************
  100 in use, 100 most used
show asp cluster
counter
This command is useful for datapath
troubleshooting.
Monitoring Cluster Routing
See the following
commands for cluster
routing:
show route cluster
debug route cluster
Shows cluster information for routing.
show lisp eid
Shows the ASA
EID table showing EIDs and site IDs.
See the
following output from the
cluster exec show lisp eid command.
ciscoasa# cluster exec show lisp eid
L1(LOCAL):************************************************************
     LISP EID       Site ID
    33.44.33.105        2
    33.44.33.201        2
    11.22.11.1             4
    11.22.11.2             4
L2:*******************************************************************
     LISP EID       Site ID
    33.44.33.105        2
    33.44.33.201        2
    11.22.11.1 	 4
    11.22.11.2	 4
show asp table classify
domain inspect-lisp
This command is
useful for troubleshooting.
Configuring Logging for Clustering
See the following
command for configuring
logging for clustering:
logging device-id
Each node in the cluster generates syslog messages independently. You
can use the logging device-id
command to generate syslog messages with identical or different
device IDs to make messages appear to come from the same or different nodes in
the cluster.
Monitoring Cluster Interfaces
See the following commands for monitoring cluster interfaces:
show cluster interface-mode
Shows the cluster interface mode.
Debugging Clustering
See the following commands for debugging clustering:
debug cluster [ccp | datapath
| fsm | general | hc | license | rpc | transport]
Shows debug messages for clustering.
debug cluster flow-mobility
Shows events related to clustering flow mobility.
debug lisp eid-notify-intercept
Shows events when the eid-notify message is intercepted.
show cluster info trace
The show cluster info trace
command shows the debug information for further troubleshooting.
See the following output for the show cluster info trace command:
ciscoasa# show cluster info trace
 Feb 02 14:19:47.456 [DBUG]Receive CCP message: CCP_MSG_LOAD_BALANCE
 Feb 02 14:19:47.456 [DBUG]Receive CCP message: CCP_MSG_LOAD_BALANCE
 Feb 02 14:19:47.456 [DBUG]Send CCP message to all: CCP_MSG_KEEPALIVE from 80-1 at CONTROL_NODE
For example, if you see the following messages showing that two nodes with the same
local-unit name are acting as the control node, it could mean
that either two nodes have the same local-unit name (check your
configuration), or a node is receiving its own broadcast messages (check
your network).
ciscoasa# show cluster info trace
 May 23 07:27:23.113 [CRIT]Received datapath event 'multi control_nodes' with parameter 1.
 May 23 07:27:23.113 [CRIT]Found both unit-9-1 and unit-9-1 as control_node units. Control_node role retained by unit-9-1, unit-9-1 will leave then join as a Data_node
 May 23 07:27:23.113 [DBUG]Send event (DISABLE, RESTART | INTERNAL-EVENT, 5000 msecs, Detected another Control_node, leave and re-join as Data_node) to FSM. Current state CONTROL_NODE
 May 23 07:27:23.113 [INFO]State machine changed from state CONTROL_NODE to DISABLED
Reference for Clustering
This section includes more information about how clustering operates.
ASA Features and Clustering
Some ASA features are not supported with ASA clustering, and some are
only supported on the control node. Other features might have caveats for proper
usage.
Unsupported Features with Clustering
These features cannot be configured with clustering enabled,
and the commands will be rejected.
Unified Communication features that rely on TLS Proxy
Remote access VPN (SSL VPN and IPsec VPN)
Virtual Tunnel Interfaces (VTIs)
The following application inspections:
CTIQBE
H323, H225, and RAS
IPsec passthrough
MGCP
MMP
RTSP
SCCP (Skinny)
WAAS
WCCP
Botnet Traffic Filter
Auto Update Server
DHCP client, server, and proxy. DHCP relay is
supported.
VPN load balancing
Failover on Azure
Integrated Routing and Bridging
FIPS mode
Centralized Features for Clustering
The following features are only supported on the control node, and are
not scaled for the cluster.
Note
Traffic for centralized features is forwarded from member
nodes to the control node over the cluster control link.
If you use the rebalancing feature, traffic for centralized
features may be rebalanced to non-control nodes before the traffic is classified
as a centralized feature; if this occurs, the traffic is then sent back to the
control node.
For centralized features, if the control node fails, all
connections are dropped, and you have to re-establish the connections on the new
control node.
The following application inspections:
DCERPC
ESMTP
IM
NetBIOS
PPTP
RADIUS
RSH
SNMP
SQLNET
SUNRPC
TFTP
XDMCP
Static route monitoring
Authentication and Authorization for network access.
Accounting is decentralized.
Filtering Services
Site-to-site VPN
Multicast routing
Features Applied to Individual Nodes
These features are applied to each ASA node, instead of the cluster as a whole or to
the control node.
QoS—The QoS policy is synced across the cluster as part of configuration
replication. However, the policy is enforced on each node independently. For
example, if you configure policing on output, then the conform rate and
conform burst values are enforced on traffic exiting a particular ASA. In a
cluster with 3 nodes and with traffic evenly distributed, the conform rate
actually becomes 3 times the rate for the cluster.
Threat detection—Threat detection works on each node independently; for
example, the top statistics is node-specific. Port scanning detection, for
example, does not work because scanning traffic will be load-balanced
between all nodes, and one node will not see all traffic.
AAA for Network Access and Clustering
AAA for network access consists of three components: authentication,
authorization, and accounting. Authentication and authorization are implemented
as centralized features on the clustering control node with replication of the
data structures to the cluster data nodes. If a control node is elected, the new
control node will have all the information it needs to continue uninterrupted
operation of the established authenticated users and their associated
authorizations. Idle and absolute timeouts for user authentications are
preserved when a control node change occurs.
Accounting is implemented as a distributed feature in a cluster.
Accounting is done on a per-flow basis, so the cluster node owning a flow will
send accounting start and stop messages to the AAA server when accounting is
configured for a flow.
Connection Settings and Clustering
Connection limits are enforced cluster-wide (see the set connection conn-max, set
connection embryonic-conn-max, set
connection per-client-embryonic-max, and
set connection per-client-max
commands). Each node has an
estimate of the cluster-wide counter values based on broadcast messages. Due to
efficiency considerations, the configured connection limit across the cluster
might not be enforced exactly at the limit number. Each node may overestimate or
underestimate the cluster-wide counter value at any given time. However, the
information will get updated over time in a load-balanced cluster.
Dynamic Routing and Clustering
In Individual interface mode, each node runs the routing protocol as a
standalone router, and routes are learned by each node independently.
Figure 13. Dynamic Routing in Individual Interface Mode
In the above diagram, Router A learns that there are 4 equal-cost paths
to Router B, each through a node. ECMP is used to load balance traffic between
the 4 paths. Each node picks a different router ID when talking to external
routers.
You must configure a cluster pool for the router ID so that each node has
a separate router ID.
EIGRP does not
form neighbor relationships with cluster peers in individual interface mode.
Note
If the cluster has multiple adjacencies to the same router for redundancy purposes,
asymmetric routing can lead to unacceptable traffic loss. To avoid
asymmetric routing, group all of these node interfaces into the same traffic
zone.
FTP and Clustering
If FTP data channel and control channel flows are owned by
different cluster members, then the data channel owner will periodically send
idle timeout updates to the control channel owner and update the idle timeout
value. However, if the control flow owner is reloaded, and the control flow is
re-hosted, the parent/child flow relationship will not longer be maintained;
the control flow idle timeout will not be updated.
If you use AAA for FTP access, then the control channel flow is
centralized on the control node.
ICMP Inspection and Clustering
The flow of ICMP and ICMP error packets through the cluster varies depending on
whether ICMP/ICMP error inspection is enabled. Without ICMP inspection, ICMP is
a one-direction flow, and there is no director flow support. With ICMP
inspection, the ICMP flow becomes two-directional and is backed up by a
director/backup flow. One difference for an inspected ICMP flow is in the
director handling of a forwarded packet: the director will forward the ICMP echo
reply packet to the flow owner instead of returning the packet to the forwarder.
Multicast Routing and Clustering
In Individual interface mode, units do not act independently with
multicast. All data and routing packets are processed and forwarded by the control unit,
thus avoiding packet replication.
NAT and Clustering
NAT can affect the overall throughput of the cluster. Inbound and
outbound NAT packets can be sent to different ASAs in the cluster, because the load balancing algorithm relies on IP addresses
and ports, and NAT causes inbound and outbound packets to have different IP
addresses and/or ports. When a packet arrives at the ASA that is not the NAT owner, it is forwarded over the cluster control link to
the owner, causing large amounts of traffic on the cluster control link. Note
that the receiving node does not create a forwarding flow to the owner, because
the NAT owner may not end up creating a connection for the packet depending on
the results of security and policy checks.
If you still want to use NAT in clustering, then consider the
following guidelines:
No Proxy ARP—For Individual interfaces, a proxy ARP reply is never sent
for mapped addresses. This prevents the adjacent router from maintaining
a peer relationship with an ASA that may no longer be in the cluster.
The upstream router needs a static route or PBR with Object Tracking for
the mapped addresses that points to the Main cluster IP address. This is
not an issue for a Spanned EtherChannel, because there is only one IP
address associated with the cluster interface.
PAT with Port Block Allocation—See the following guidelines for this
feature:
Maximum-per-host limit is not a cluster-wide limit, and is enforced on each node
individually. Thus, in a 3-node cluster with the
maximum-per-host limit configured as 1, if the traffic from a
host is load-balanced across all 3 nodes, then it can get
allocated 3 blocks with 1 in each node.
Port blocks created on the backup node from the backup pools are not accounted for when
enforcing the maximum-per-host limit.
On-the-fly PAT rule modifications, where the PAT pool is modified with a completely new
range of IP addresses, will result in xlate backup creation
failures for the xlate backup requests that were still in
transit while the new pool became effective. This behavior is
not specific to the port block allocation feature, and is a
transient PAT pool issue seen only in cluster deployments where
the pool is distributed and traffic is load-balanced across the
cluster nodes.
When operating in a cluster, you cannot simply change the block allocation size. The new
size is effective only after you reload each device in the
cluster. To avoid having to reload each device, we recommend
that you delete all block allocation rules and clear all xlates
related to those rules. You can then change the block size and
recreate the block allocation rules.
NAT pool address distribution for dynamic PAT—When you configure a PAT pool, the cluster
divides each IP address in the pool into port blocks. By default, each
block is 512 ports, but if you configure port block allocation rules,
your block setting is used instead. These blocks are distributed evenly
among the nodes in the cluster, so that each node has one or more blocks
for each IP address in the PAT pool. Thus, you could have as few as one
IP address in a PAT pool for a cluster, if that is sufficient for the
number of PAT’ed connections you expect. Port blocks cover the
1024-65535 port range, unless you configure the option to include the
reserved ports, 1-1023, on the PAT pool NAT rule.
Reusing a PAT pool in multiple rules—To use the same PAT pool in multiple
rules, you must be careful about the interface selection in the rules.
You must either use specific interfaces in all rules, or "any" in all
rules. You cannot mix specific interfaces and "any" across the rules, or
the system might not be able to match return traffic to the right node
in the cluster. Using unique PAT pools per rule is the most reliable
option.
No round-robin—Round-robin for a PAT pool is not supported with
clustering.
No extended PAT—Extended PAT is not supported with clustering.
Dynamic NAT xlates managed by the control node—The control node
maintains and replicates the xlate table to data nodes. When a data node
receives a connection that requires dynamic NAT, and the xlate is not in
the table, it requests the xlate from the control node. The data node
owns the connection.
Stale xlates—The xlate idle time on the connection owner does not get
updated. Thus, the idle time might exceed the idle timeout. An idle
timer value higher than the configured timeout with a refcnt of 0 is an
indication of a stale xlate.
Per-session PAT feature—Although not exclusive to clustering, the
per-session PAT feature improves the scalability of PAT and, for
clustering, allows each data node to own PAT connections; by contrast,
multi-session PAT connections have to be forwarded to and owned by the
control node. By default, all TCP traffic and UDP DNS traffic use a
per-session PAT xlate, whereas ICMP and all other UDP traffic uses
multi-session. You can configure per-session NAT rules to change these
defaults for TCP and UDP, but you cannot configure per-session PAT for
ICMP. For example, with an increasing use of Quic protocol over UDP/443
as a best performance alternative compared to HTTPS TLS over TCP/443,
you should enable per-session PAT for UDP/443. For traffic that benefits
from multi-session PAT, such as H.323, SIP, or Skinny, you can disable
per-session PAT for the associated TCP ports (the UDP ports for those
H.323 and SIP are already multi-session by default). For more
information about per-session PAT, see the firewall configuration guide.
No static PAT for the following inspections—
FTP
PPTP
RSH
SQLNET
TFTP
XDMCP
SIP
If you have an extremely large number of NAT rules, over ten thousand, you should enable
the transactional commit model using the asp rule-engine
transactional-commit nat command in the device
CLI. Otherwise, the node might not be able to join the cluster.
SCTP and Clustering
An SCTP association can be created on any node (due to load balancing); its multi-homing
connections must reside on the same node.
SIP Inspection and Clustering
A control flow can be created on any node (due to load balancing); its
child data flows must reside on the same node.
TLS Proxy configuration is
not supported.
SNMP and Clustering
An
SNMP agent polls each individual ASA by its Local IP address. You cannot poll consolidated data for
the cluster.
You should always use the Local address, and not the Main cluster IP
address for SNMP polling. If the SNMP agent polls the Main cluster IP address,
if a new control node is elected, the poll to the new control node will fail.
When using SNMPv3 with clustering, if you add a new
cluster node after the initial cluster formation, then SNMPv3 users are not
replicated to the new node.You must re-add them on the
control node to force the users to replicate to the new node, or directly on
the data node.
STUN and Clustering
STUN inspection is supported in failover and cluster modes, as pinholes are replicated.
However, the transaction ID is not replicated among nodes. In the case where a
node fails after receiving a STUN Request and another node received the STUN
Response, the STUN Response will be dropped.
Syslog and Clustering
Syslog—Each node in the cluster generates
its own syslog messages. You can configure logging so that each node
uses either the same or a different device ID in the syslog message
header field. For example, the hostname configuration is replicated and
shared by all nodes in the cluster. If you configure logging to use the
hostname as the device ID, syslog messages generated by all nodes look
as if they come from a single node. If you configure logging to use the
local-node name that is assigned in the cluster bootstrap configuration
as the device ID, syslog messages look as if they come from different
nodes.
NetFlow—Each node in the cluster generates its own NetFlow stream. The
NetFlow collector can only treat each ASA as a separate NetFlow
exporter.
Cisco Trustsec and Clustering
Only the control node learns security group tag (SGT) information. The
control node then populates the SGT to data nodes, and data nodes can make a
match decision for SGT based on the security policy.
VPN and Clustering
Site-to-site VPN is a centralized feature; only the control
node supports VPN connections.
Note
Remote access VPN is not supported with clustering.
VPN functionality is limited to the control node and does not
take advantage of the cluster high availability capabilities. If the control node
fails, all existing VPN connections are lost, and VPN users will see a disruption in
service. When a new control node is elected, you must reestablish the VPN
connections.
For connections to an Individual interface when using PBR or
ECMP, you must always connect to the Main cluster IP address, not a Local address.
VPN-related keys and certificates are replicated to all nodes.
Performance Scaling Factor
When you combine multiple units into a cluster, you can expect the total cluster
performance to be approximately 80% of the maximum combined throughput.
For example, if your model can handle approximately 10 Gbps of traffic when running
alone, then for a cluster of 8 units, the maximum combined throughput will be
approximately 80% of 80 Gbps (8 units x 10 Gbps): 64 Gbps.
Control Node Election
Nodes of the cluster communicate over the cluster control link to
elect a control node as follows:
When you enable clustering for a node (or when it first
starts up with clustering already enabled), it broadcasts an election request
every 3 seconds.
Any other nodes with a higher priority respond to the
election request; the priority is set between 1 and 100, where 1 is the highest
priority.
If after 45 seconds, a node does not receive a response
from another node with a higher priority, then it becomes the control node.
Note
If multiple nodes tie for the highest priority, the
cluster node name and then the serial number is used to determine the
control node.
If a node later joins the cluster with a higher priority,
it does not automatically become the control node; the existing control node
always remains as the control node unless it stops responding, at which point a
new control node is elected.
In a "split brain" scenario when there are temporarily multiple control nodes,
then the node with highest priority retains the role while the other nodes
return to data node roles.
Note
You can manually force a node to become the control node. For
centralized features, if you force a control node change, then all connections are
dropped, and you have to re-establish the connections on the new control node.
High Availability within the Cluster
Clustering provides high availability by monitoring node and
interface health and by replicating connection states between nodes.
Node Health Monitoring
Each node periodically sends a broadcast heartbeat packet over the cluster control link. If the control node
does not receive any heartbeat packets
or other packets from a data node within the configurable timeout period, then the
control node removes the data node from the cluster. If the data nodes do not
receive packets from the control node, then a new control node is elected from
the remaining nodes.
If nodes cannot reach each other over the cluster control link because of a
network failure and not because a node has actually failed, then the cluster may
go into a "split brain" scenario where isolated data nodes will elect their own
control nodes. For example, if a router fails between two cluster locations,
then the original control node at location 1 will remove the location 2 data
nodes from the cluster. Meanwhile, the nodes at location 2 will elect their own
control node and form their own cluster. Note that asymmetric traffic may fail
in this scenario. After the cluster control link is restored, then the control
node that has the higher priority will keep the control node’s role.
Interface Monitoring
Each node monitors the link status of all named hardware
interfaces in use, and reports status changes to the control node.
When you enable health monitoring, all physical interfaces are
monitored by default; you can optionally disable monitoring per interface. Only
named interfaces can be monitored.
A node is removed from the cluster if its monitored interfaces
fail. The amount of time before the ASA removes a member from the cluster depends on
whether the node is an established member or is joining the cluster. The ASA does
not monitor interfaces for the first 90 seconds that a node joins the cluster.
Interface status changes during this time will not cause the ASA to be removed from
the cluster. The node is removed after 500 ms, regardless of the node state.
Status After Failure
If the control node fails, then another member of the cluster with the highest priority (lowest number) becomes the control
node.
The ASA automatically tries to rejoin the cluster, depending on the failure event.
Note
When the ASA becomes inactive and fails to automatically rejoin the cluster, all data interfaces are shut down; only the management-only interface can send and receive traffic. The management interface remains up using the IP address the node received from the cluster IP pool. However if you reload,
and the node is still inactive in the cluster, the management interface is disabled. You must use the console port for any
further configuration.
Rejoining the Cluster
After a cluster node is removed from the cluster, how it can
rejoin the cluster depends on why it was removed:
Failed cluster control link when initially
joining—After you resolve the problem with the cluster control link, you
must manually rejoin the cluster by re-enabling clustering
at the CLI by entering cluster group name, and then enable.
Failed cluster control link after joining the cluster—The ASA automatically
tries to rejoin every 5 minutes, indefinitely. This behavior is
configurable.
Failed data interface—The ASA automatically tries to
rejoin at 5 minutes, then at 10 minutes, and finally at 20 minutes. If the
join is not successful after 20 minutes, then the ASA disables clustering.
After you resolve the problem with the data interface, you have to manually
enable clustering at the CLI by entering
cluster group name, and then enable. This behavior is configurable.
Failed node—If the node was removed from the cluster
because of a node health check failure, then rejoining the cluster depends
on the source of the failure. For example, a temporary power failure means
the node will rejoin the cluster when it starts up again as long as the
cluster control link is up and clustering is still enabled
with the enable command. The ASA
attempts to rejoin the cluster every 5 seconds.
Internal error—Internal failures include: application sync timeout;
inconsistent application statuses; and so on. A node will attempt to rejoin
the cluster automatically at the following intervals: 5 minutes, 10 minutes,
and then 20 minutes. This behavior is configurable.
Data Path Connection State Replication
Every connection has one owner and at least one backup owner in
the cluster. The backup owner does not take over the connection in the event of
a failure; instead, it stores TCP/UDP state information, so that the connection
can be seamlessly transferred to a new owner in case of a failure. The backup
owner is usually also the director.
Some traffic requires state information above the TCP or UDP
layer. See the following table for clustering support or lack of support for
this kind of traffic.
Table 7. Features Replicated Across the Cluster
Traffic
State Support
Notes
Up time
Yes
Keeps track of the system up time.
ARP Table
Yes
—
MAC address table
Yes
—
User Identity
Yes
Includes AAA rules (uauth).
IPv6 Neighbor database
Yes
—
Dynamic routing
Yes
—
SNMP Engine ID
No
—
Distributed VPN (Site-to-Site) for Firepower 4100/9300
Yes
Backup
session becomes the active session, then a new backup session is created.
How the Cluster Manages Connections
Connections can be load-balanced to multiple nodes of the cluster.
Connection roles determine how connections are handled in both normal operation
and in a high availability situation.
Connection Roles
See the following roles defined for each connection:
Owner—Usually, the node that initially receives the connection. The
owner maintains the TCP state and processes packets. A connection has
only one owner. If the original owner fails, then when new nodes receive
packets from the connection, the director chooses a new owner from those
nodes.
Backup owner—The node that stores TCP/UDP state information received from the owner, so that
the connection can be seamlessly transferred to a new owner in case of a
failure. The backup owner does not take over the connection in the event
of a failure. If the owner becomes unavailable, then the first node to
receive packets from the connection (based on load balancing) contacts
the backup owner for the relevant state information so it can become the
new owner.
As long as the director (see below) is not the same node as the owner, then the director is
also the backup owner. If the owner chooses itself as the director, then
a separate backup owner is chosen.
For clustering on the Firepower 9300, which can include up to 3 cluster nodes in one chassis, if the backup owner is on the
same chassis as the owner, then an additional backup owner will be chosen from another chassis to protect flows from a chassis
failure.
If you enable director localization for inter-site clustering, then
there are two backup owner roles: the local backup and the global
backup. The owner always chooses a local backup at the same site as
itself (based on site ID). The global backup can be at any site, and
might even be the same node as the local backup. The owner sends
connection state information to both backups.
If you enable site redundancy, and the backup owner is at the
same site as the owner, then an additional backup owner will be chosen from
another site to protect flows from a site failure. Chassis backup and site
backup are independent, so in some cases a flow will have both a chassis backup
and a site backup.
Director—The node that handles owner lookup requests from forwarders.
When the owner receives a new connection, it chooses a director based on
a hash of the source/destination IP address and ports (see below for
ICMP hash details), and sends a message to the director to register the
new connection. If packets arrive at any node other than the owner, the
node queries the director about which node is the owner so it can
forward the packets. A connection has only one director. If a director
fails, the owner chooses a new director.
As long as the director is not the same node as the owner, then the director is also the
backup owner (see above). If the owner chooses itself as the director,
then a separate backup owner is chosen.
If you enable director localization for inter-site clustering, then
there are two director roles: the local director and the global
director. The owner always chooses a local director at the same site as
itself (based on site ID). The global director can be at any site, and
might even be the same node as the local director. If the original owner
fails, then the local director chooses a new connection owner at the
same site.
ICMP/ICMPv6 hash details:
For Echo packets, the source port is the ICMP identifier, and the
destination port is 0.
For Reply packets, the source port is 0, and the destination port
is the ICMP identifier.
For other packets, both source and destination ports are 0.
Forwarder—A node that forwards packets to the owner. If a forwarder
receives a packet for a connection it does not own, it queries the
director for the owner, and then establishes a flow to the owner for any
other packets it receives for this connection. The director can also be
a forwarder. If you enable director
localization, then the forwarder always queries the local director.
The forwarder only queries the global director if the local director
does not know the owner, for example, if a cluster member receives
packets for a connection that is owned on a different site.
Note that if a forwarder receives the SYN-ACK packet, it can derive
the owner directly from a SYN cookie in the packet, so it does not need
to query the director. (If you disable TCP sequence randomization, the
SYN cookie is not used; a query to the director is required.) For
short-lived flows such as DNS and ICMP, instead of querying, the
forwarder immediately sends the packet to the director, which then sends
them to the owner. A connection can have multiple forwarders; the most
efficient throughput is achieved by a good load-balancing method where
there are no forwarders and all packets of a connection are received by
the owner.
Note
We do not recommend disabling TCP sequence randomization when using
clustering. There is a small chance that some TCP sessions won't be
established, because the SYN/ACK packet might be dropped.
Fragment Owner—For fragmented packets, cluster nodes that receive a fragment determine a
fragment owner using a hash of the fragment source IP address,
destination IP address, and the packet ID. All fragments are then
forwarded to the fragment owner over the cluster control link. Fragments
may be load-balanced to different cluster nodes, because only the first
fragment includes the 5-tuple used in the switch load balance hash.
Other fragments do not contain the source and destination ports and may
be load-balanced to other cluster nodes. The fragment owner temporarily
reassembles the packet so it can determine the director based on a hash
of the source/destination IP address and ports. If it is a new
connection, the fragment owner will register to be the connection owner.
If it is an existing connection, the fragment owner forwards all
fragments to the provided connection owner over the cluster control
link. The connection owner will then reassemble all fragments.
Port Address Translation Connections
When a connection uses Port Address
Translation (PAT), then the PAT type (per-session or multi-session)
influences which member of the cluster becomes the owner of a new
connection:
Per-session PAT—The owner is the node that receives the initial
packet in the connection.
By default, TCP and DNS UDP traffic use per-session PAT.
Multi-session PAT—The owner is always the control node. If a
multi-session PAT connection is initially received by a data node,
then the data node forwards the connection to the control node.
By default, UDP (except for DNS UDP) and ICMP traffic use
multi-session PAT, so these connections are always owned by the
control node.
You can change the per-session PAT defaults
for TCP and UDP so connections for these protocols are handled per-session
or multi-session depending on the configuration. For ICMP, you cannot change
from the default multi-session PAT. For more information about per-session
PAT, see the firewall configuration guide.
New Connection Ownership
When a new connection is directed to a node of the cluster via load balancing, that node owns both directions of the connection.
If any connection packets arrive at a different node, they are forwarded to the owner node over the cluster control link.
For best performance, proper external load balancing is required for both directions of a flow to arrive at the same node,
and for flows to be distributed evenly between nodes. If a reverse flow arrives at a different node, it is redirected back to the original node.
Sample Data Flow for TCP
The following example shows the establishment of a new
connection.
The SYN packet originates from the client and is delivered to one ASA (based on the load balancing method), which becomes the owner. The
owner creates a flow, encodes owner information into a SYN cookie, and
forwards the packet to the server.
The SYN-ACK packet originates from the server and is delivered to a
different ASA (based on the load balancing method). This ASA is the forwarder.
Because the forwarder does not own the connection, it decodes
owner information from the SYN cookie, creates a forwarding flow to the owner,
and forwards the SYN-ACK to the owner.
The owner sends a state update to the director, and forwards the
SYN-ACK to the client.
The director receives the state update from the owner, creates a
flow to the owner, and records the TCP state information as well as the owner.
The director acts as the backup owner for the connection.
Any subsequent packets delivered to the forwarder will be
forwarded to the owner.
If packets are delivered to any additional nodes, it will query the
director for the owner and establish a flow.
Any state change for the flow results in a state update from the
owner to the director.
Sample Data Flow for ICMP and UDP
The following example shows the establishment of a new connection.
Figure 14. ICMP and UDP Data Flow
The first UDP packet originates from the client and is delivered
to one ASA (based on the load balancing method).
The node that received the first packet queries the director node that is chosen based on a
hash of the source/destination IP address and ports.
The director finds no existing flow, creates a director flow and forwards the packet back
to the previous node. In other words, the director has elected an owner
for this flow.
The owner creates the flow, sends a state update to the director, and
forwards the packet to the server.
The second UDP packet originates from the server and is delivered to the
forwarder.
The forwarder queries the director for ownership information. For
short-lived flows such as DNS, instead of querying, the forwarder
immediately sends the packet to the director, which then sends it to the
owner.
The director replies to the forwarder with ownership information.
The forwarder creates a forwarding flow to record owner information and
forwards the packet to the owner.
The owner forwards the packet to the client.
History for ASA Virtual Clustering in the Public Cloud
Feature
Version
Details
Data nodes can join the cluster concurrently
9.24(1)
Formerly, the control node only allowed one data node to join the
cluster at a time. If the configuration sync takes a long time,
data nodes can take a long time to join. Concurrent join is
enabled by default. If you have NAT and VPN distributed mode
enabled, you cannot use concurrent join.
Added/modified commands:
concurrent-join,
show cluster info concurrent-join
incompatible-config
MTU ping test on cluster node join provides more information by
trying smaller MTUs
9.24(1)
When a node joins the cluster, it checks MTU compatibility by
sending a ping to the control node with a packet size matching
the cluster control link MTU. If the ping fails, it tries the
MTU divided by 2 and keeps dividing by 2 until an MTU ping is
successful. A notification is generated so you can fix the MTU
to a working value and try again. We recommend increasing the
switch MTU size to the recommended value, but if you can't
change the switch configuration, a working value for the cluster
control link will let you form the cluster.
Added/modified commands: show cluster
history.
Improved cluster control link health check with high CPU
9.24(1)
When a cluster node CPU usage is high, the health check will be
suspended, and the node will not be marked as unhealthy. You can
configure at what CPU use threshold to suspend the health
check.
When a node joins the cluster, it checks MTU compatibility by
sending a ping to the control node with a packet size matching
the cluster control link MTU. If the ping fails, a notification
is generated so you can fix the MTU mismatch on connecting
switches and try again.
ASA Virtual on Azure: Clustering with Gateway Load Balancing
9.20(2)
We now support the ASA Virtual clustering deployment on Azure using the Azure Resource Manager (ARM) template and then configure
the ASAv clusters to use the Gateway Load Balancer (GWLB) for load balancing the network traffic.
Configure Target Failover for ASA Virtual Clustering
with GWLB in AWS
9.20(2)
The Target Failover feature in AWS enables GWLB to
redirect network packets to a healthy target node in the event of
node deregistration during planned maintenance or a target node
failure. It takes advantage of the cluster's stateful
failover.
Configurable cluster keepalive interval for flow status
9.20(2)
The flow owner sends keepalives (clu_keepalive messages) and
updates (clu_update messages) to the director and backup owner
to refresh the flow state. You can now set the keepalive
interval. The default is 15 seconds, and you can set the
interval between 15 and 55 seconds. You may want to set the
interval to be longer to reduce the amount of traffic on the
cluster control link.
New/Modified commands:
clu-keepalive-interval
ASA Virtual Amazon Web Services (AWS) clustering
9.19(1)
The ASA Virtual supports Individual interface clustering for up to 16 nodes on AWS. You can use clustering with or without
the AWS Gateway Load Balancer.
ASA virtual IMDSv2 support in Amazon Web Services (AWS) clustering
9.22
The ASA Virtual supports IMDSv2 on AWS. You can enable IMDSv2 Required mode by updating the stack.

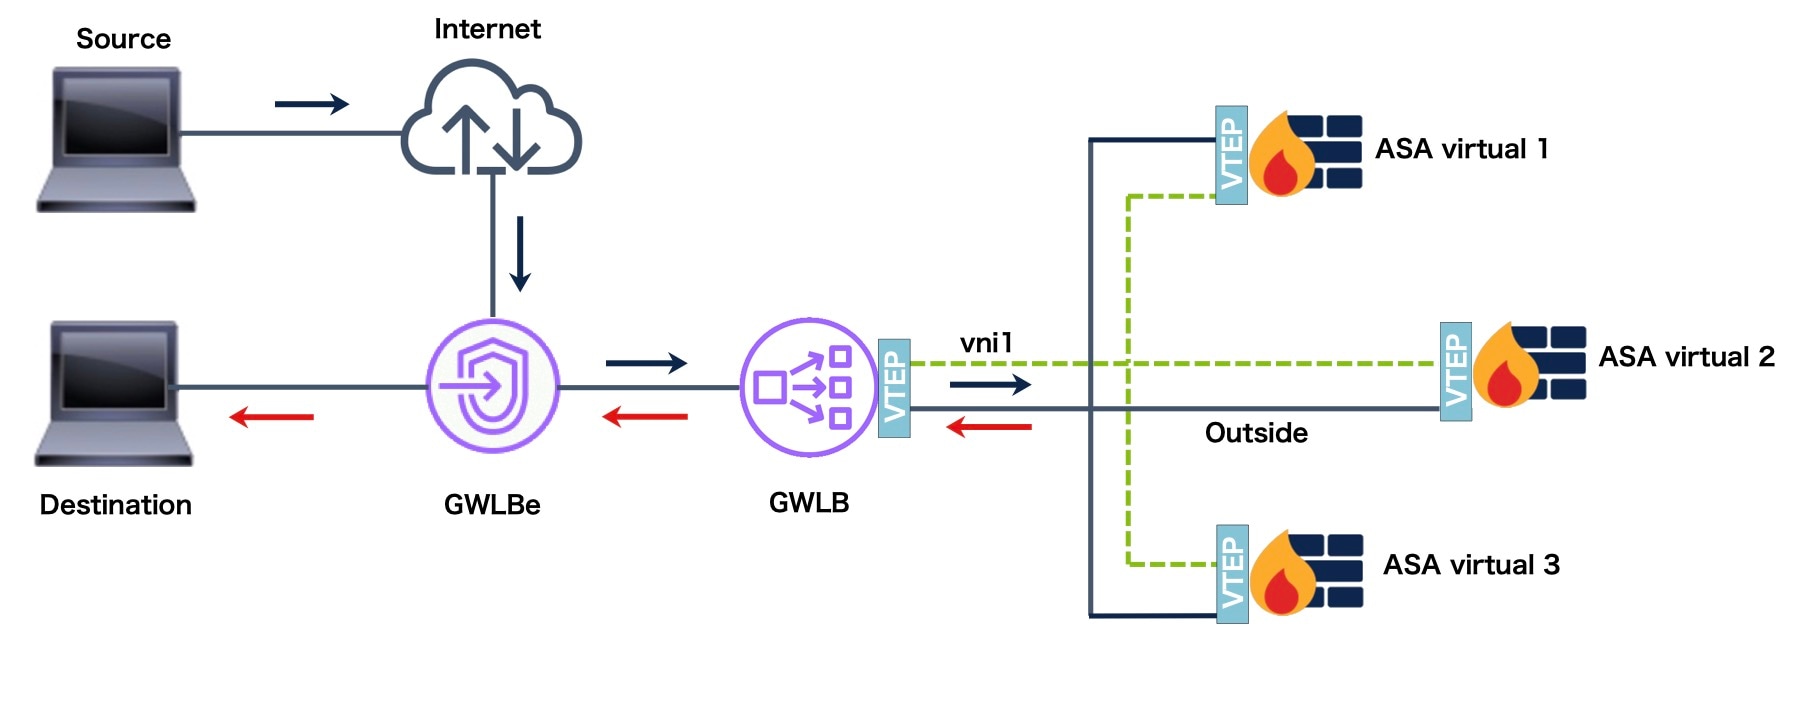
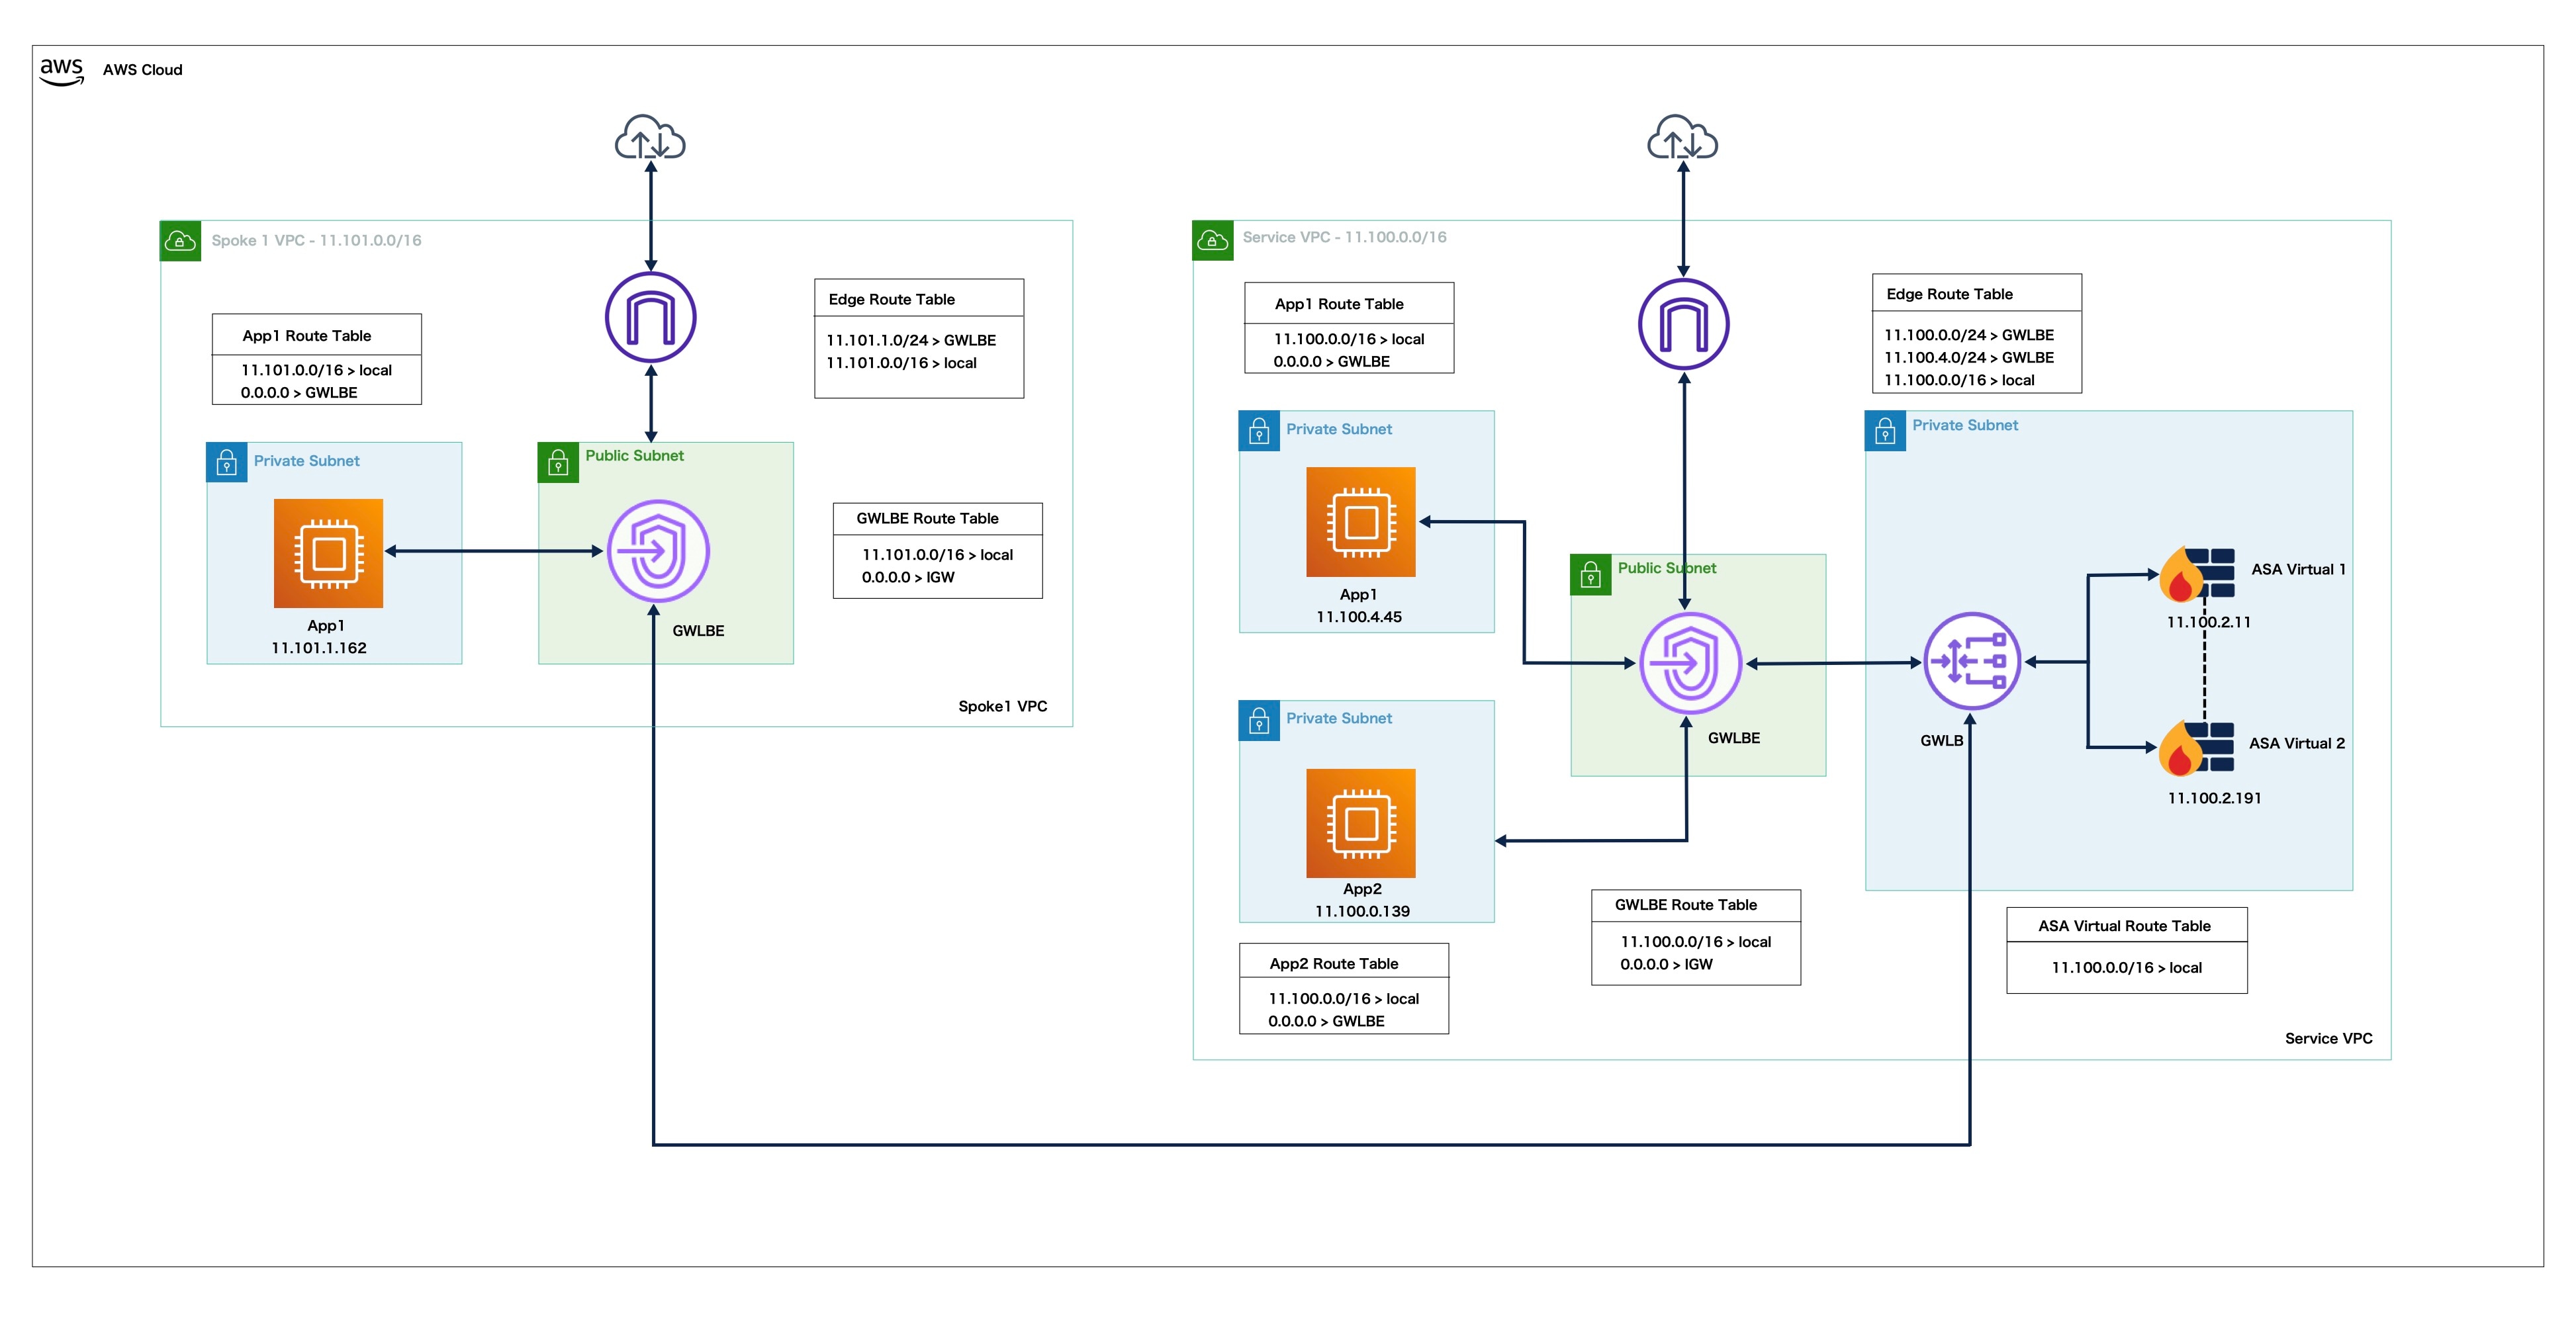
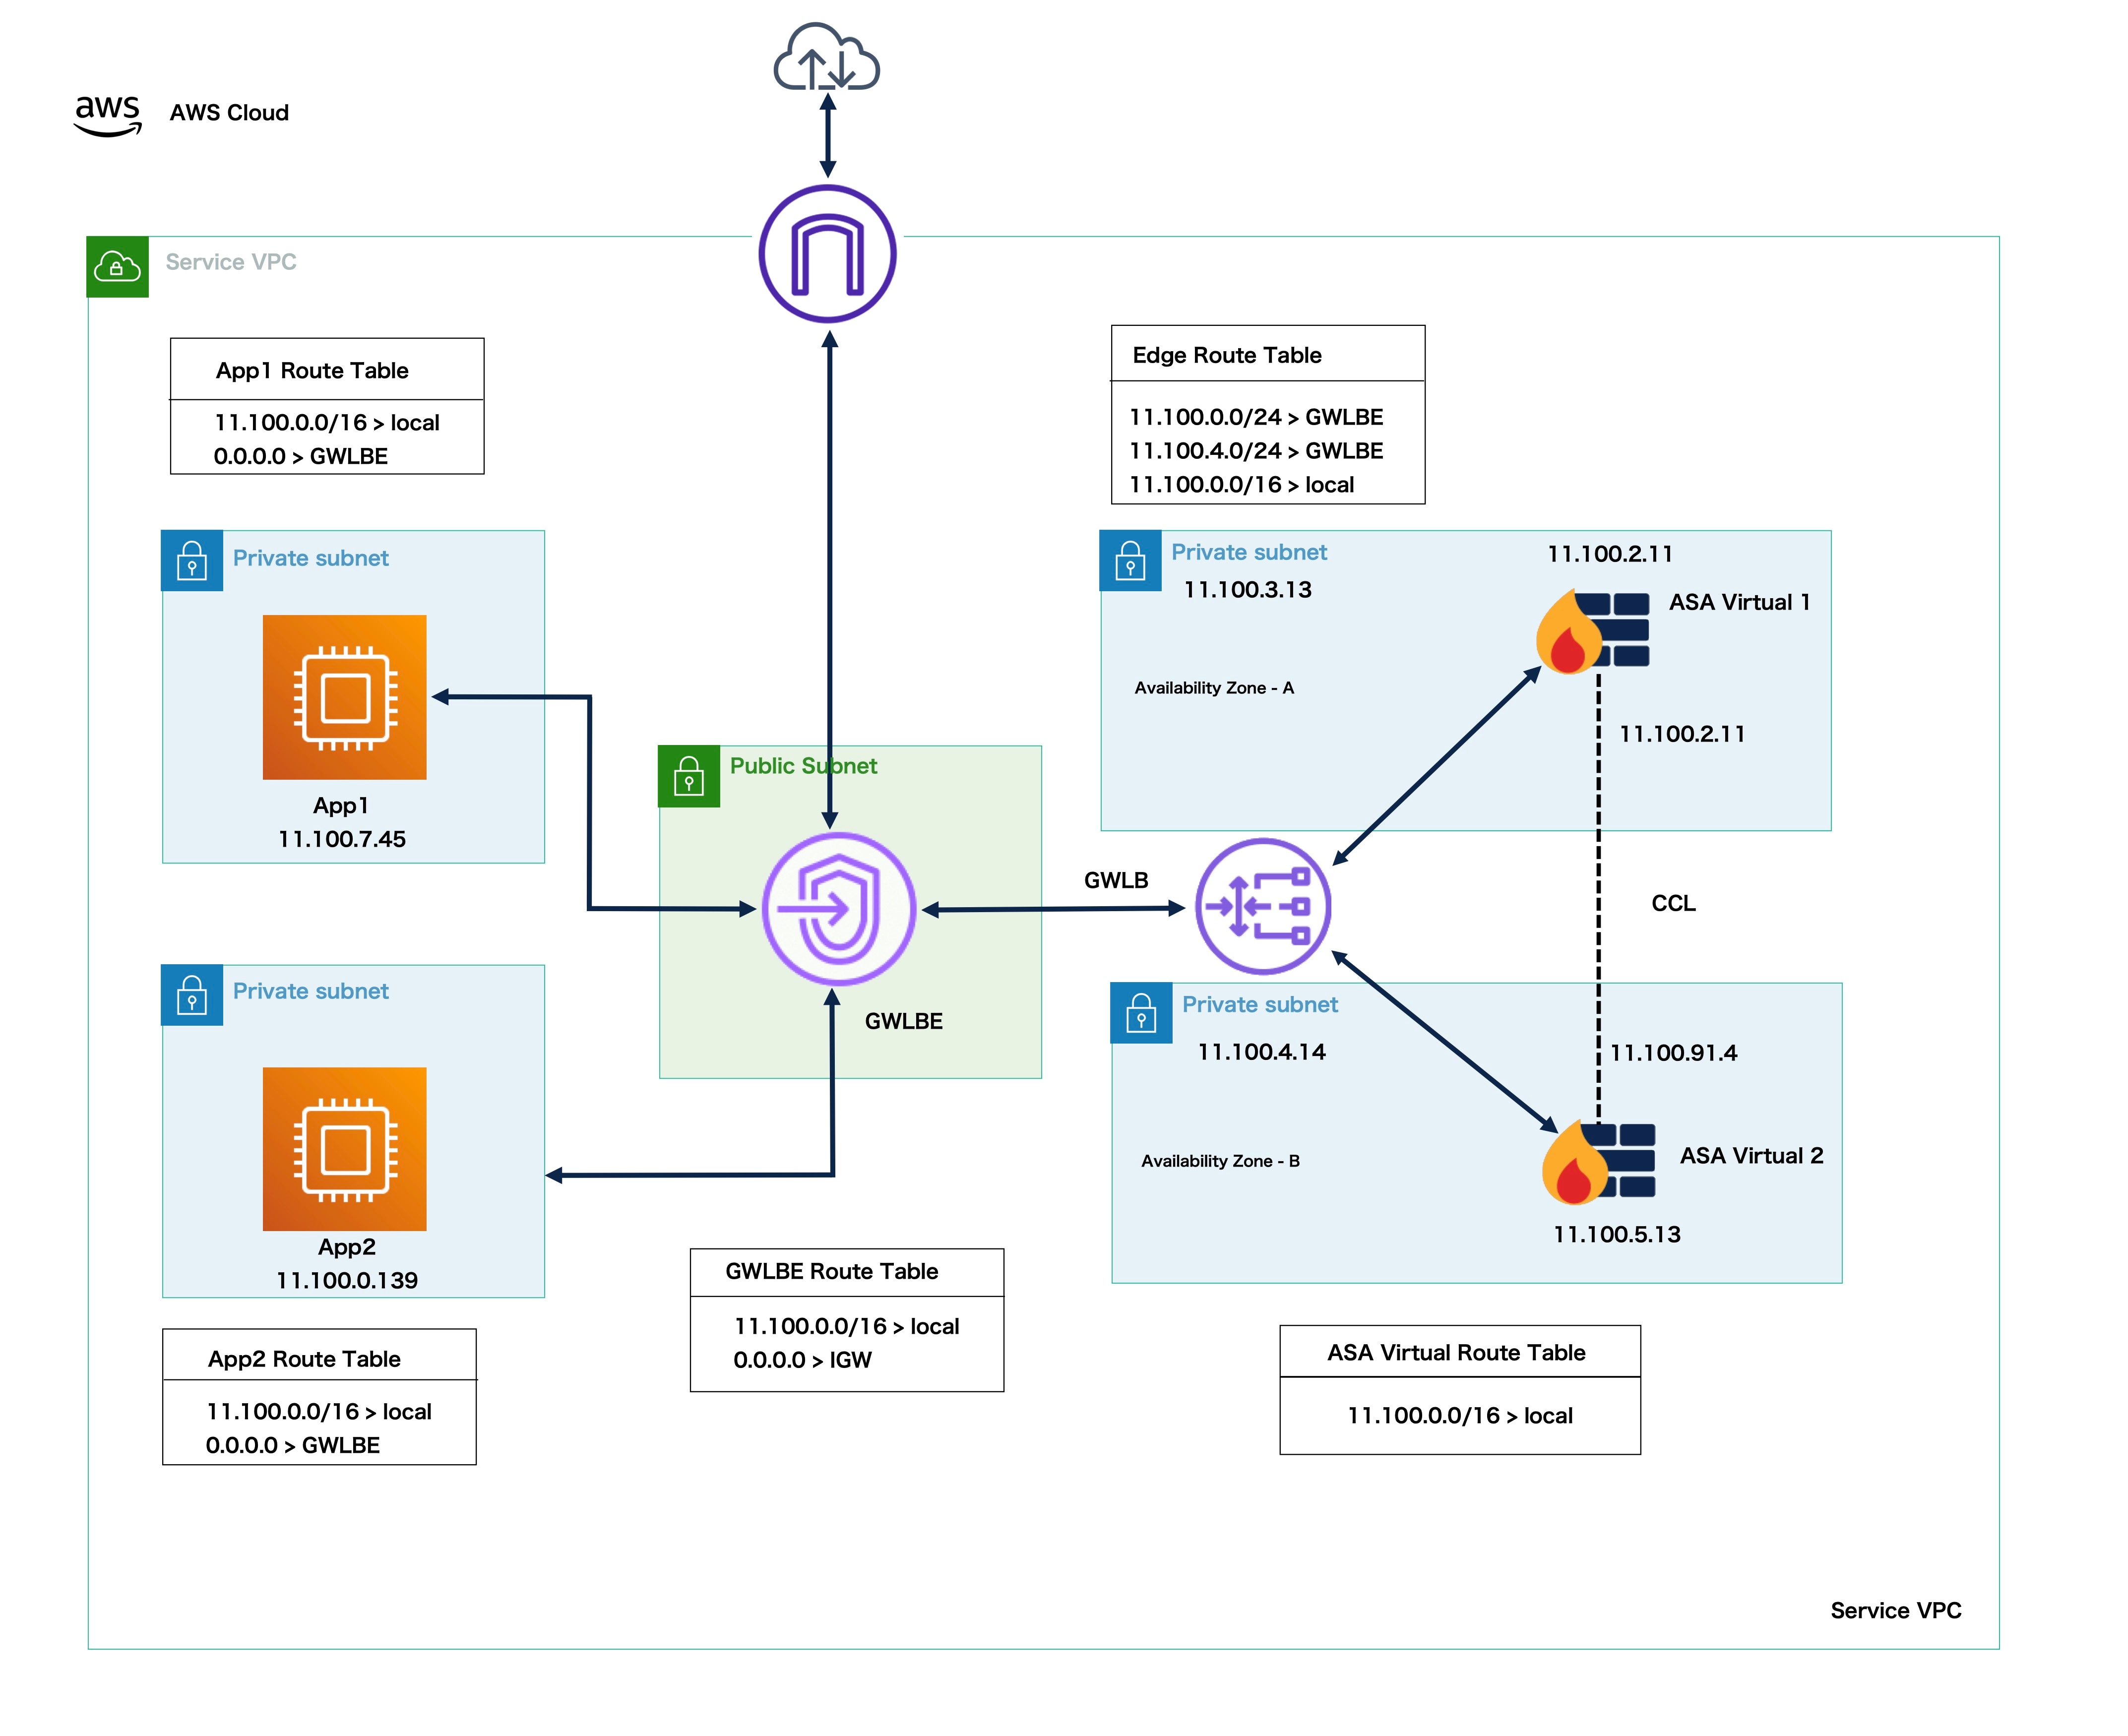
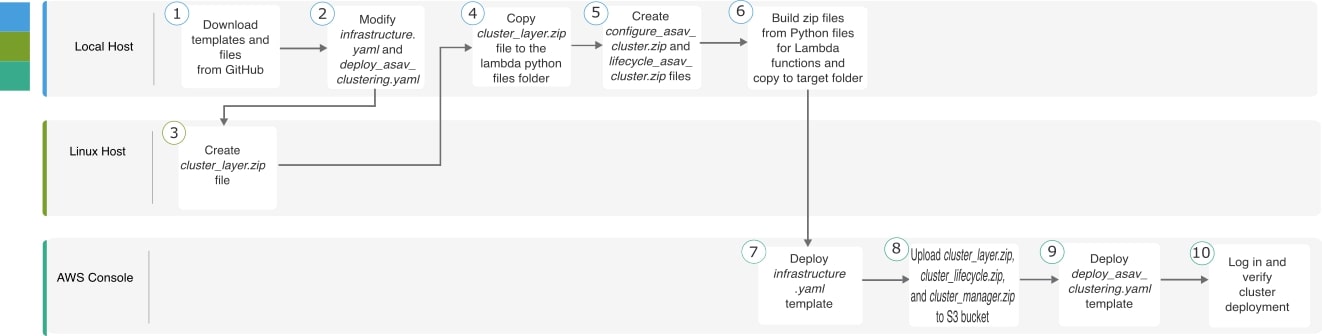
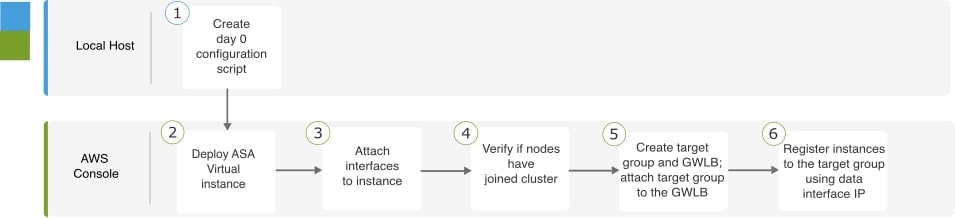
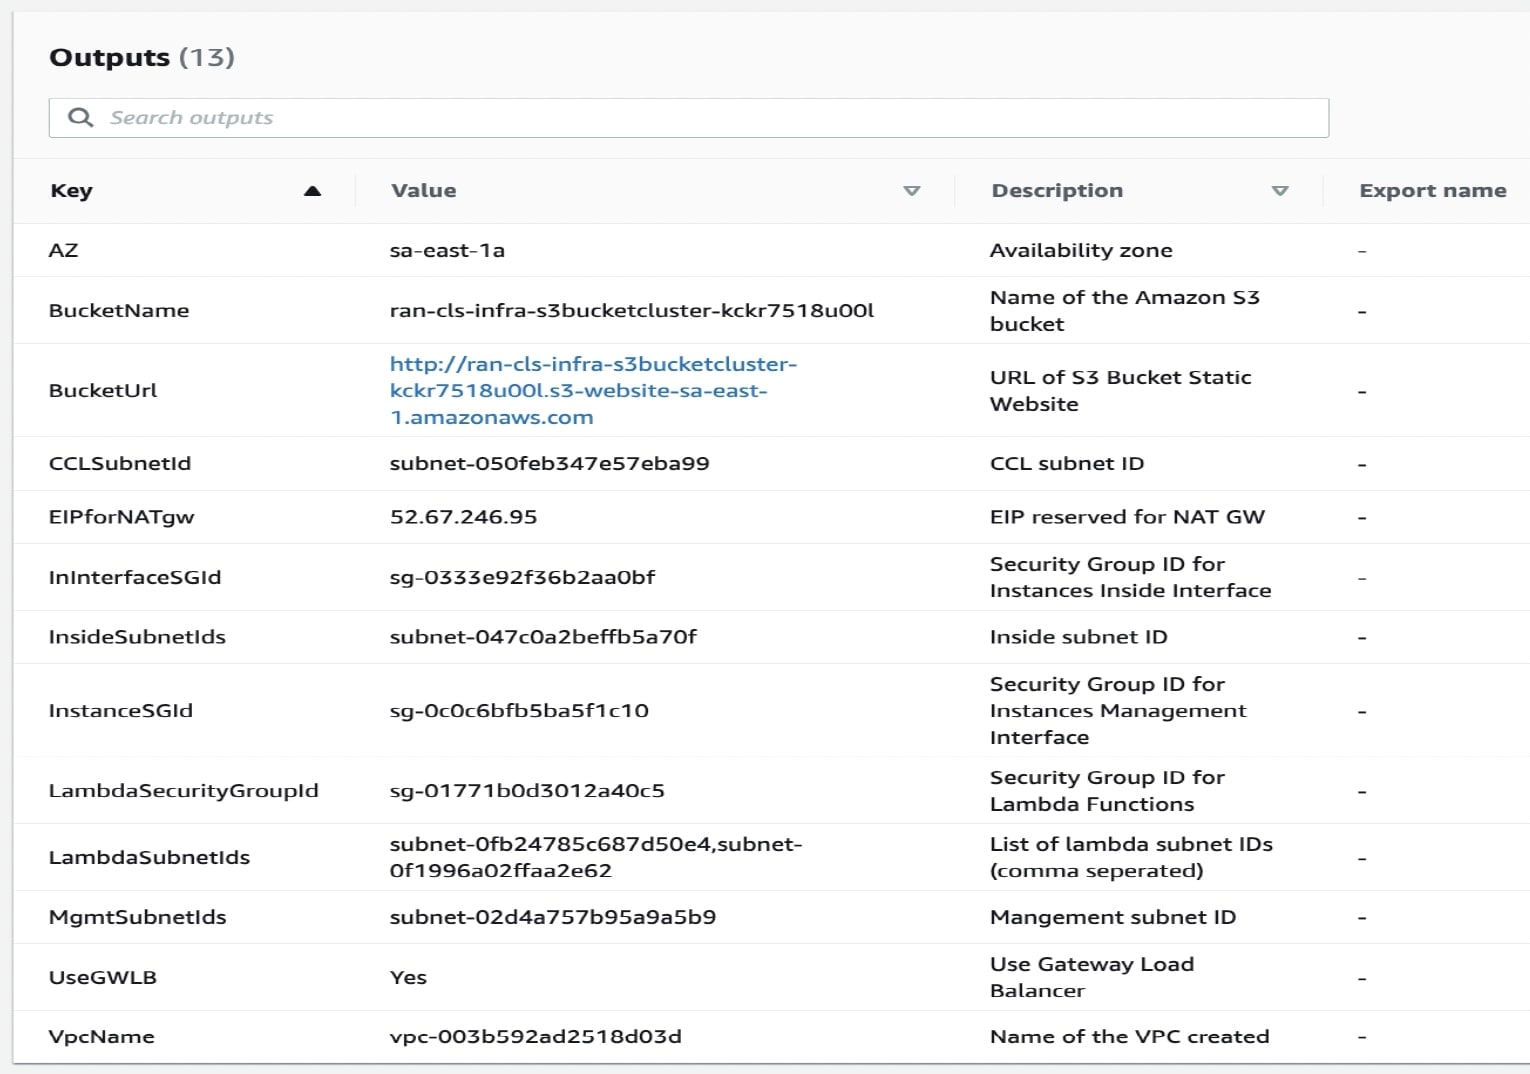
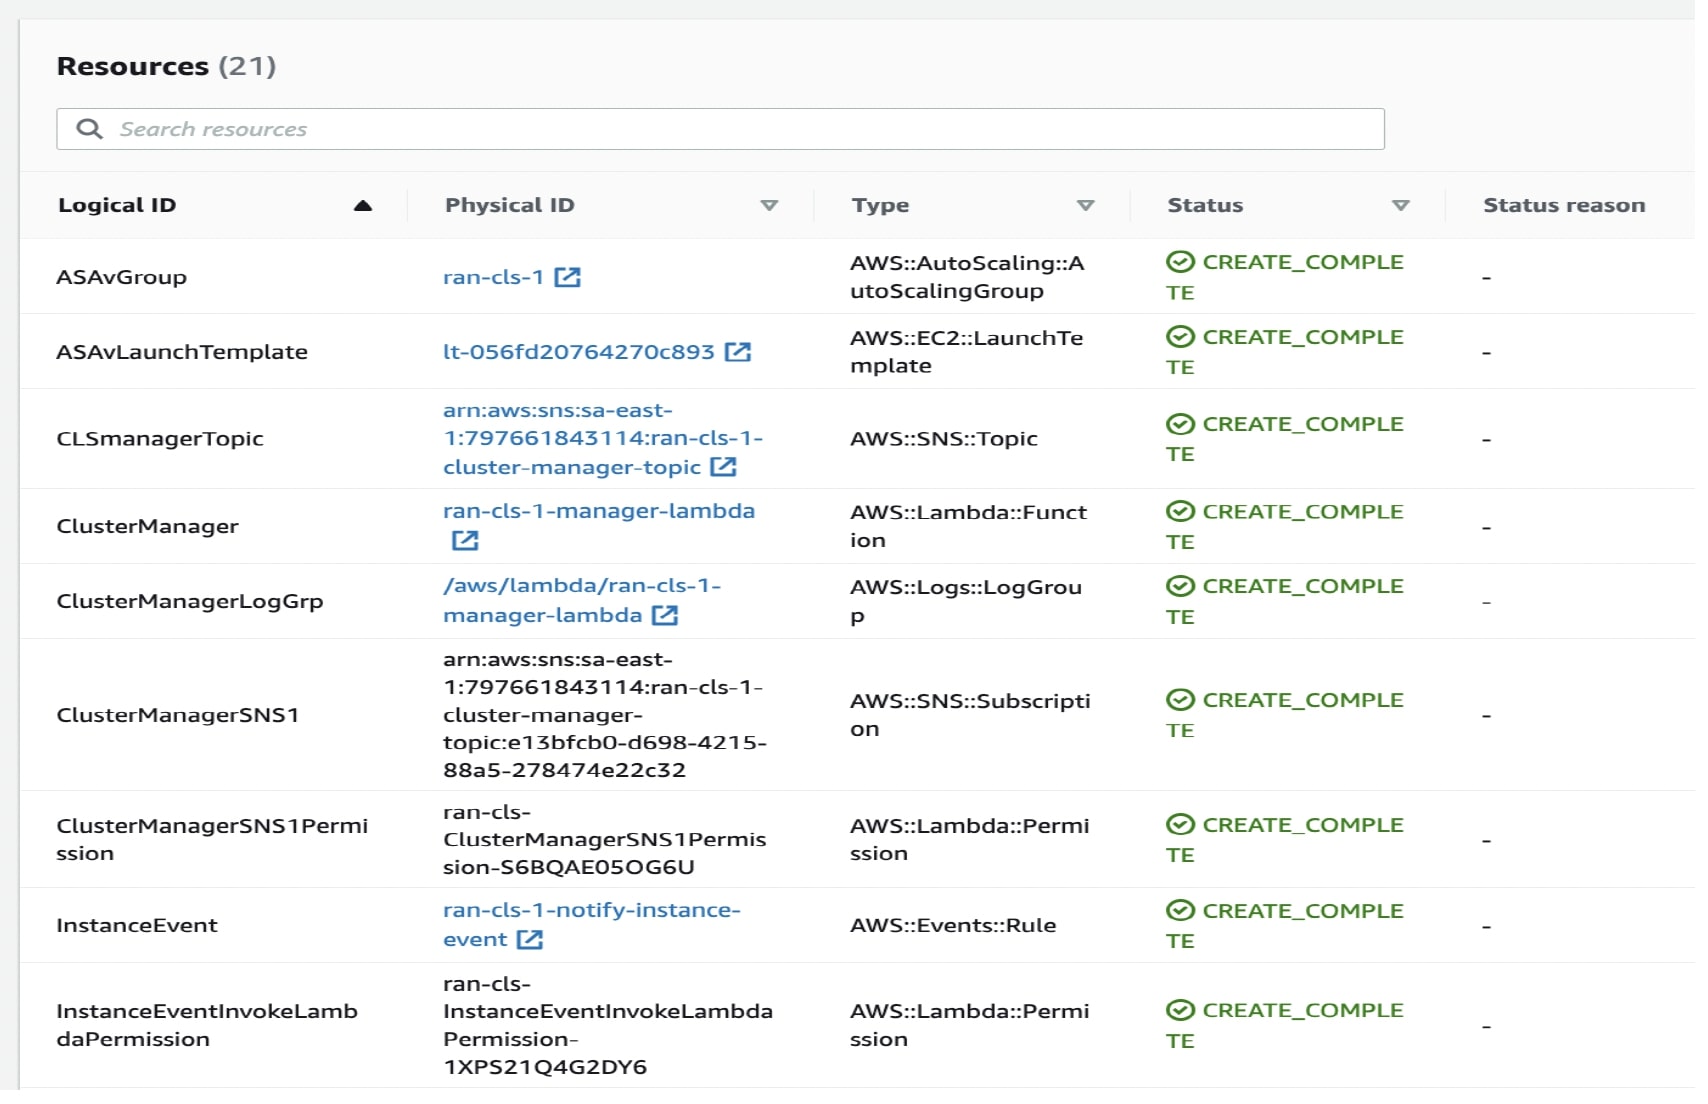
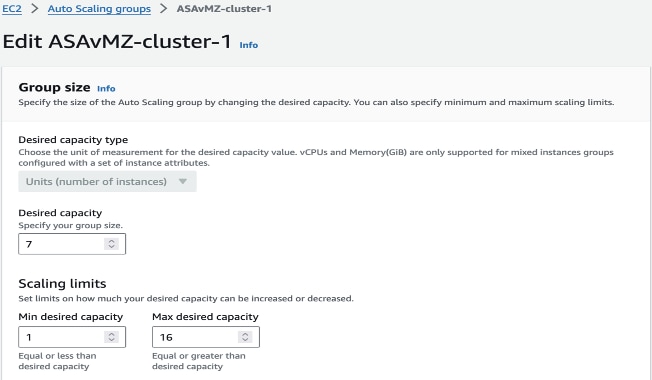
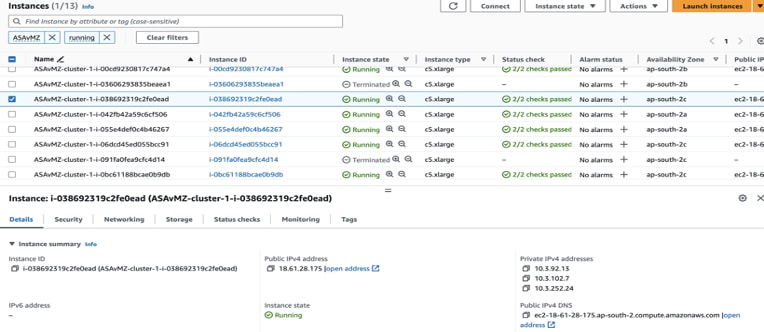
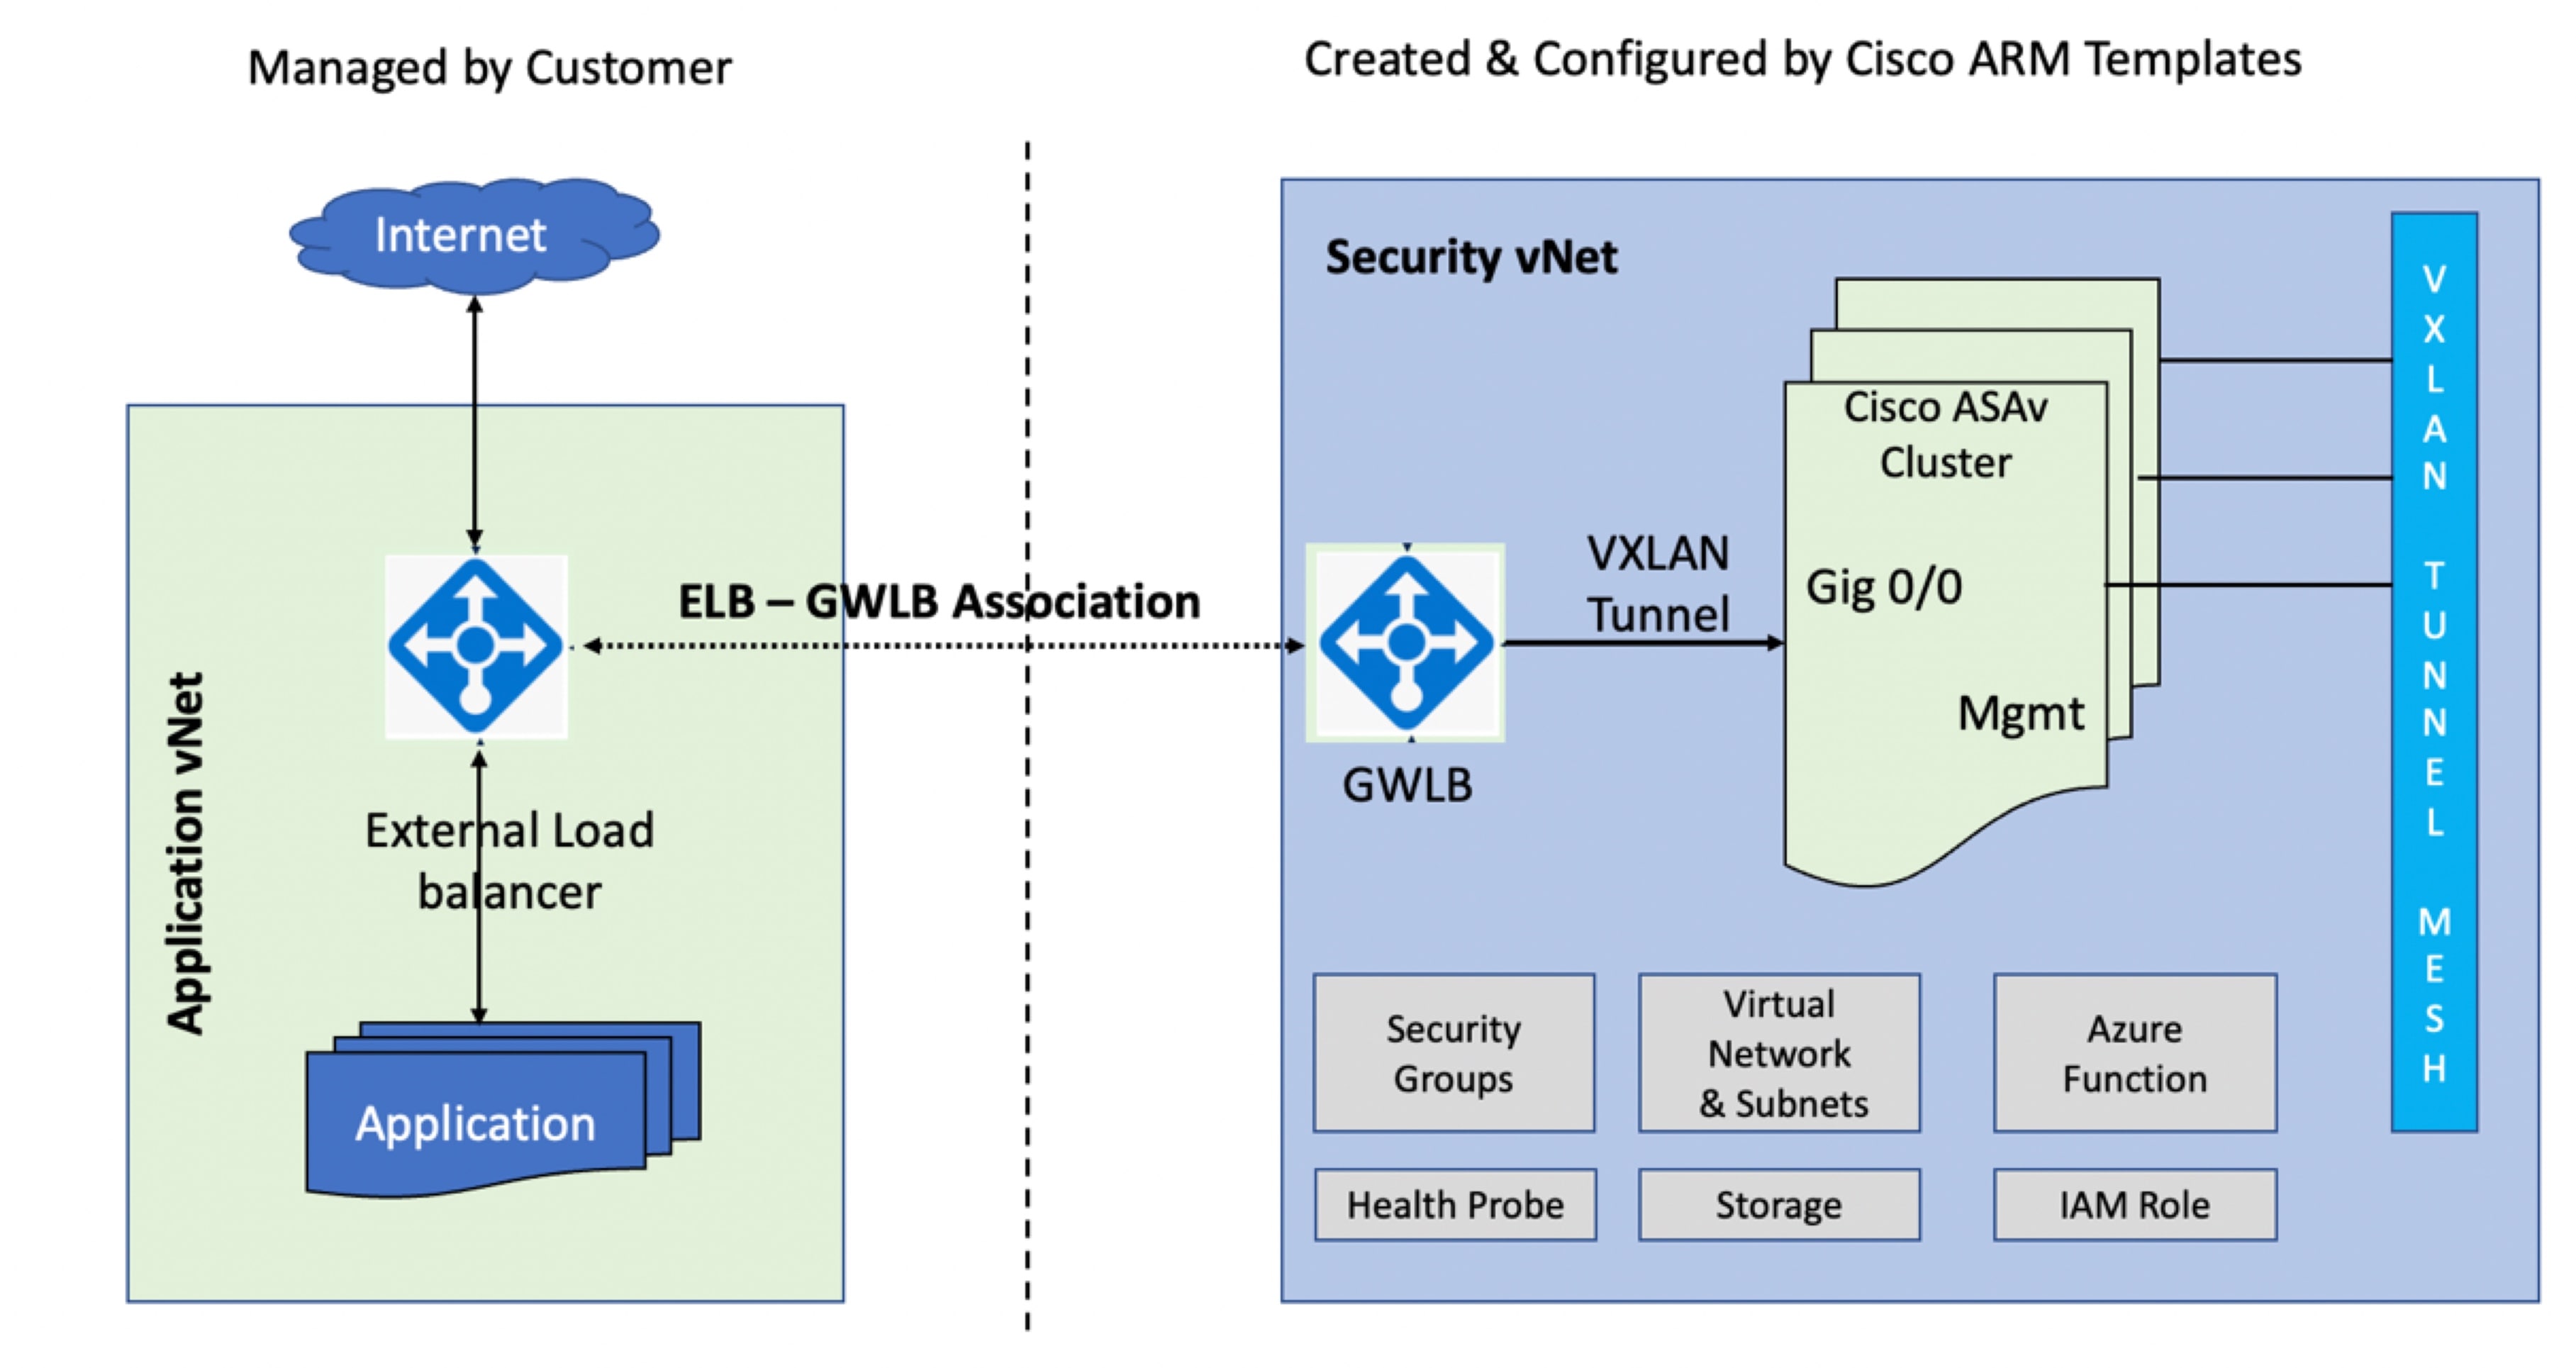
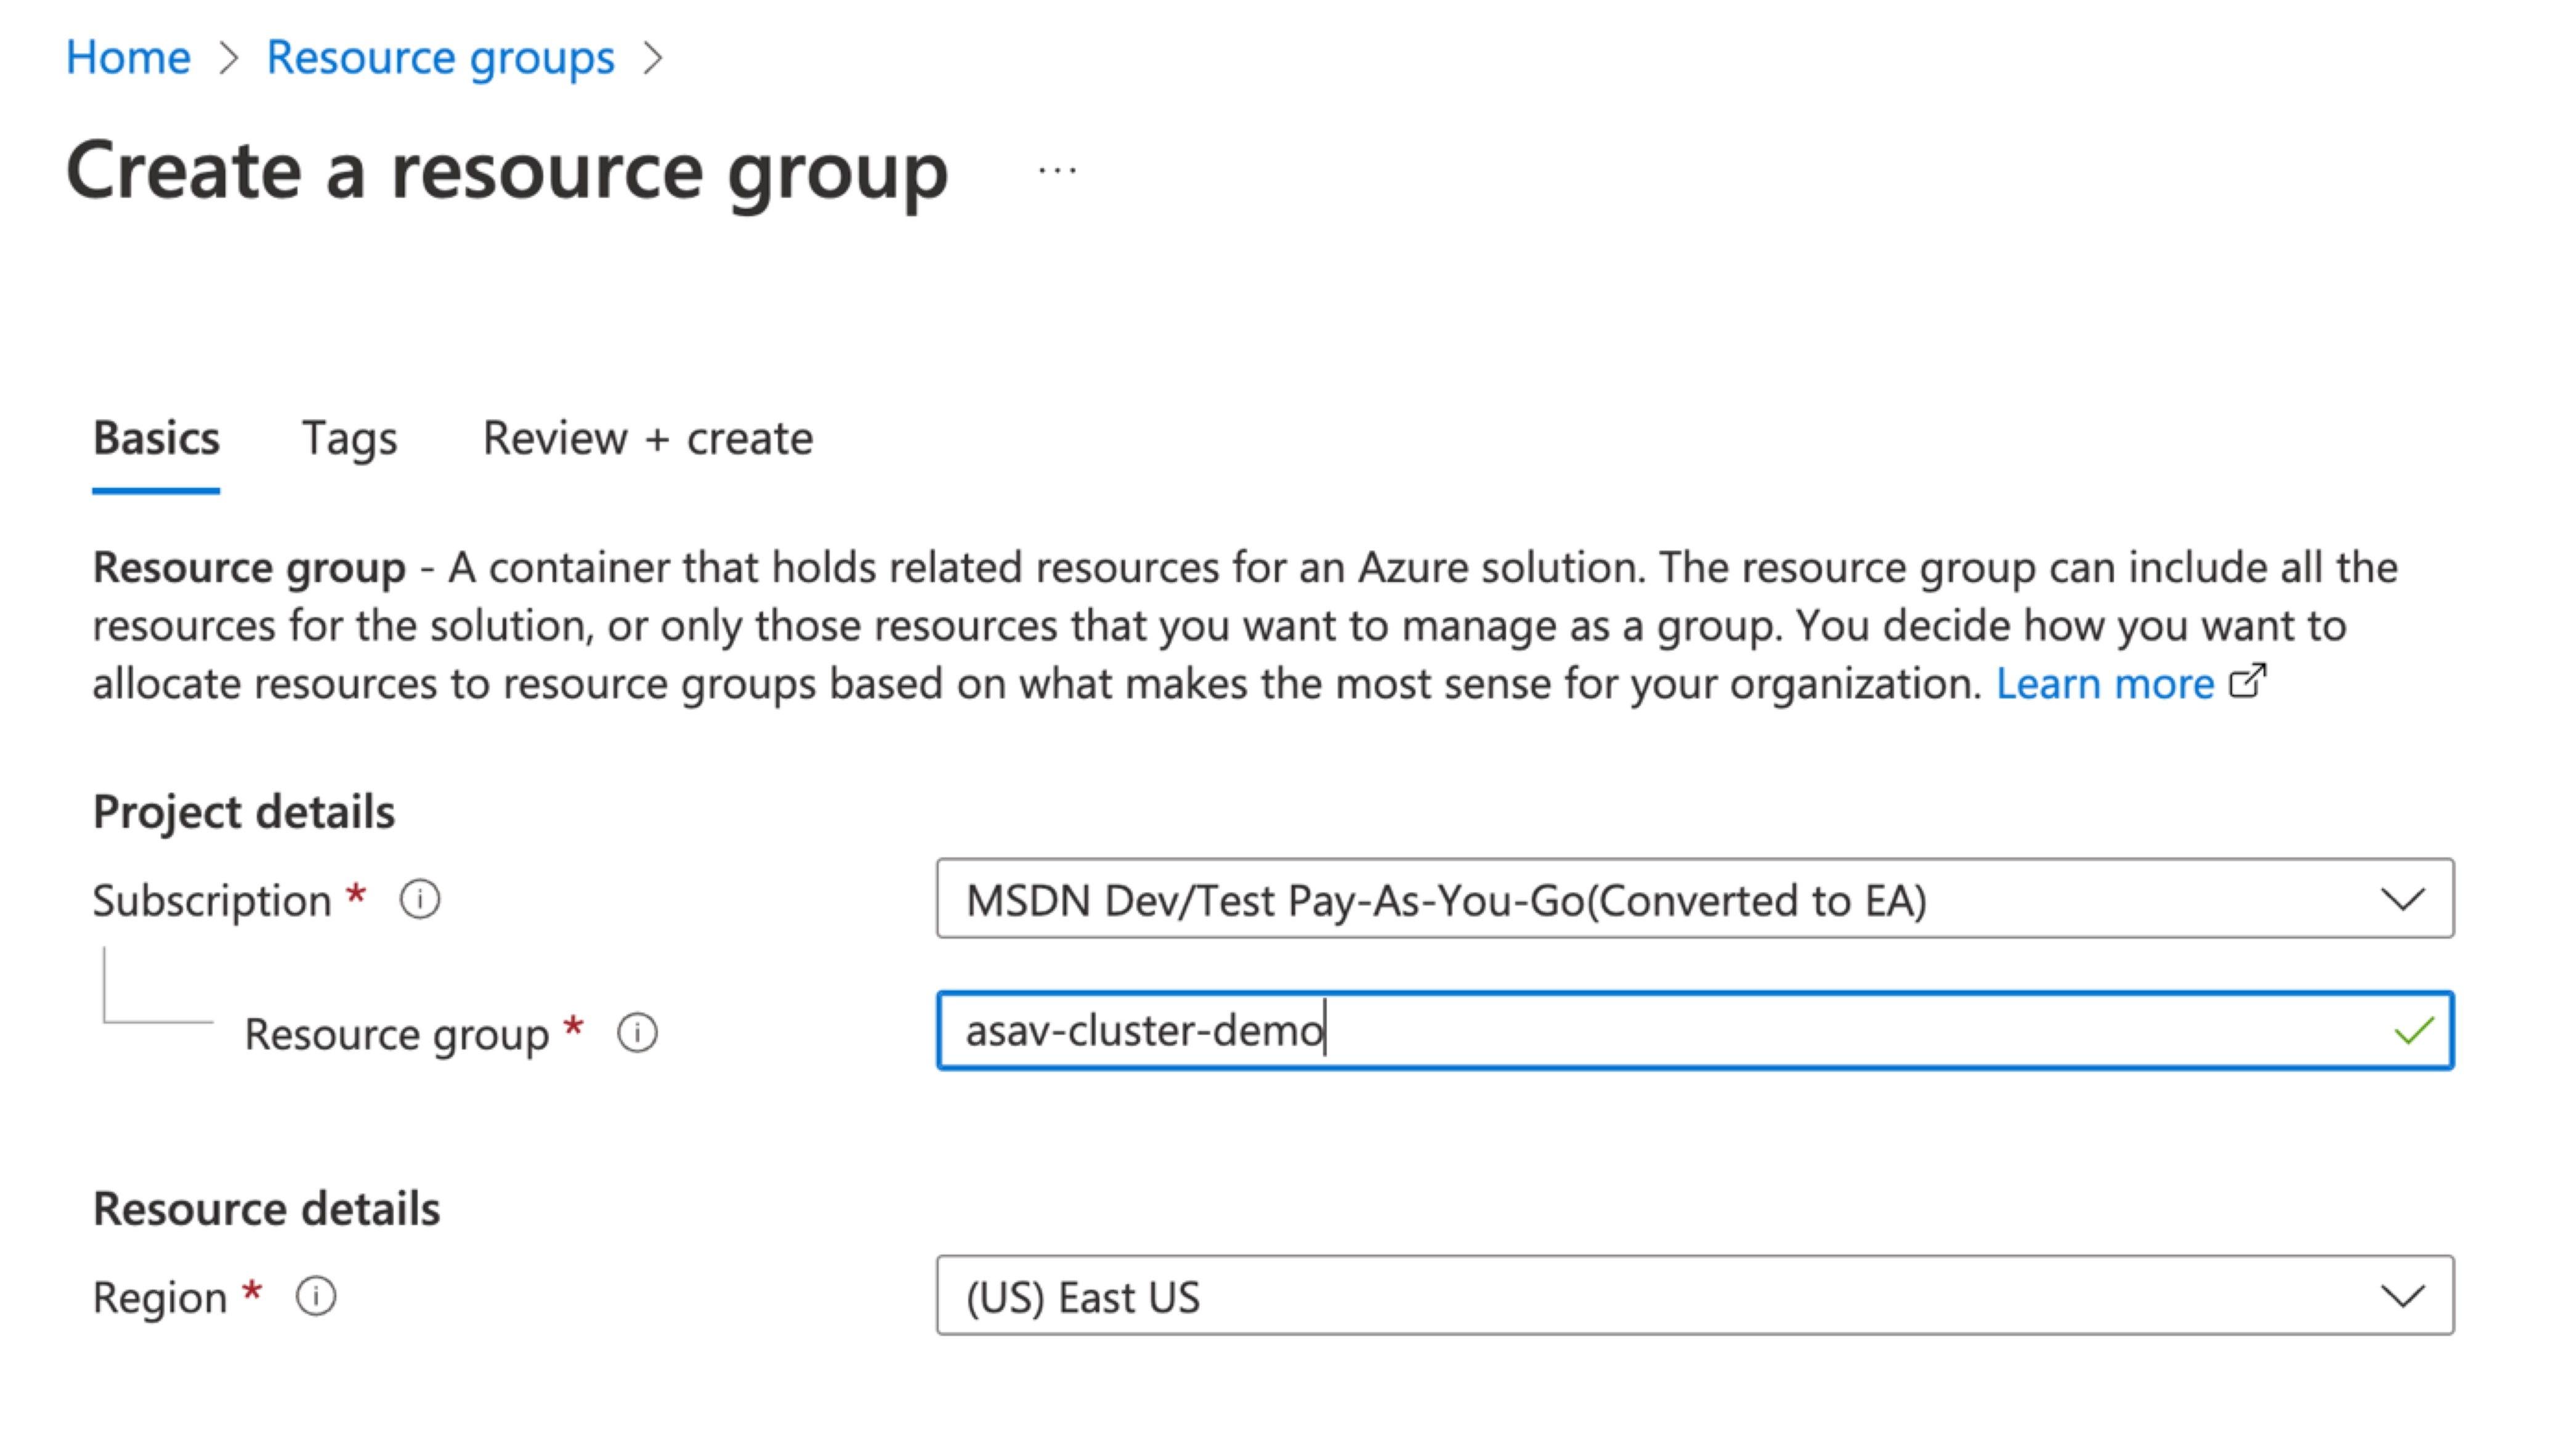
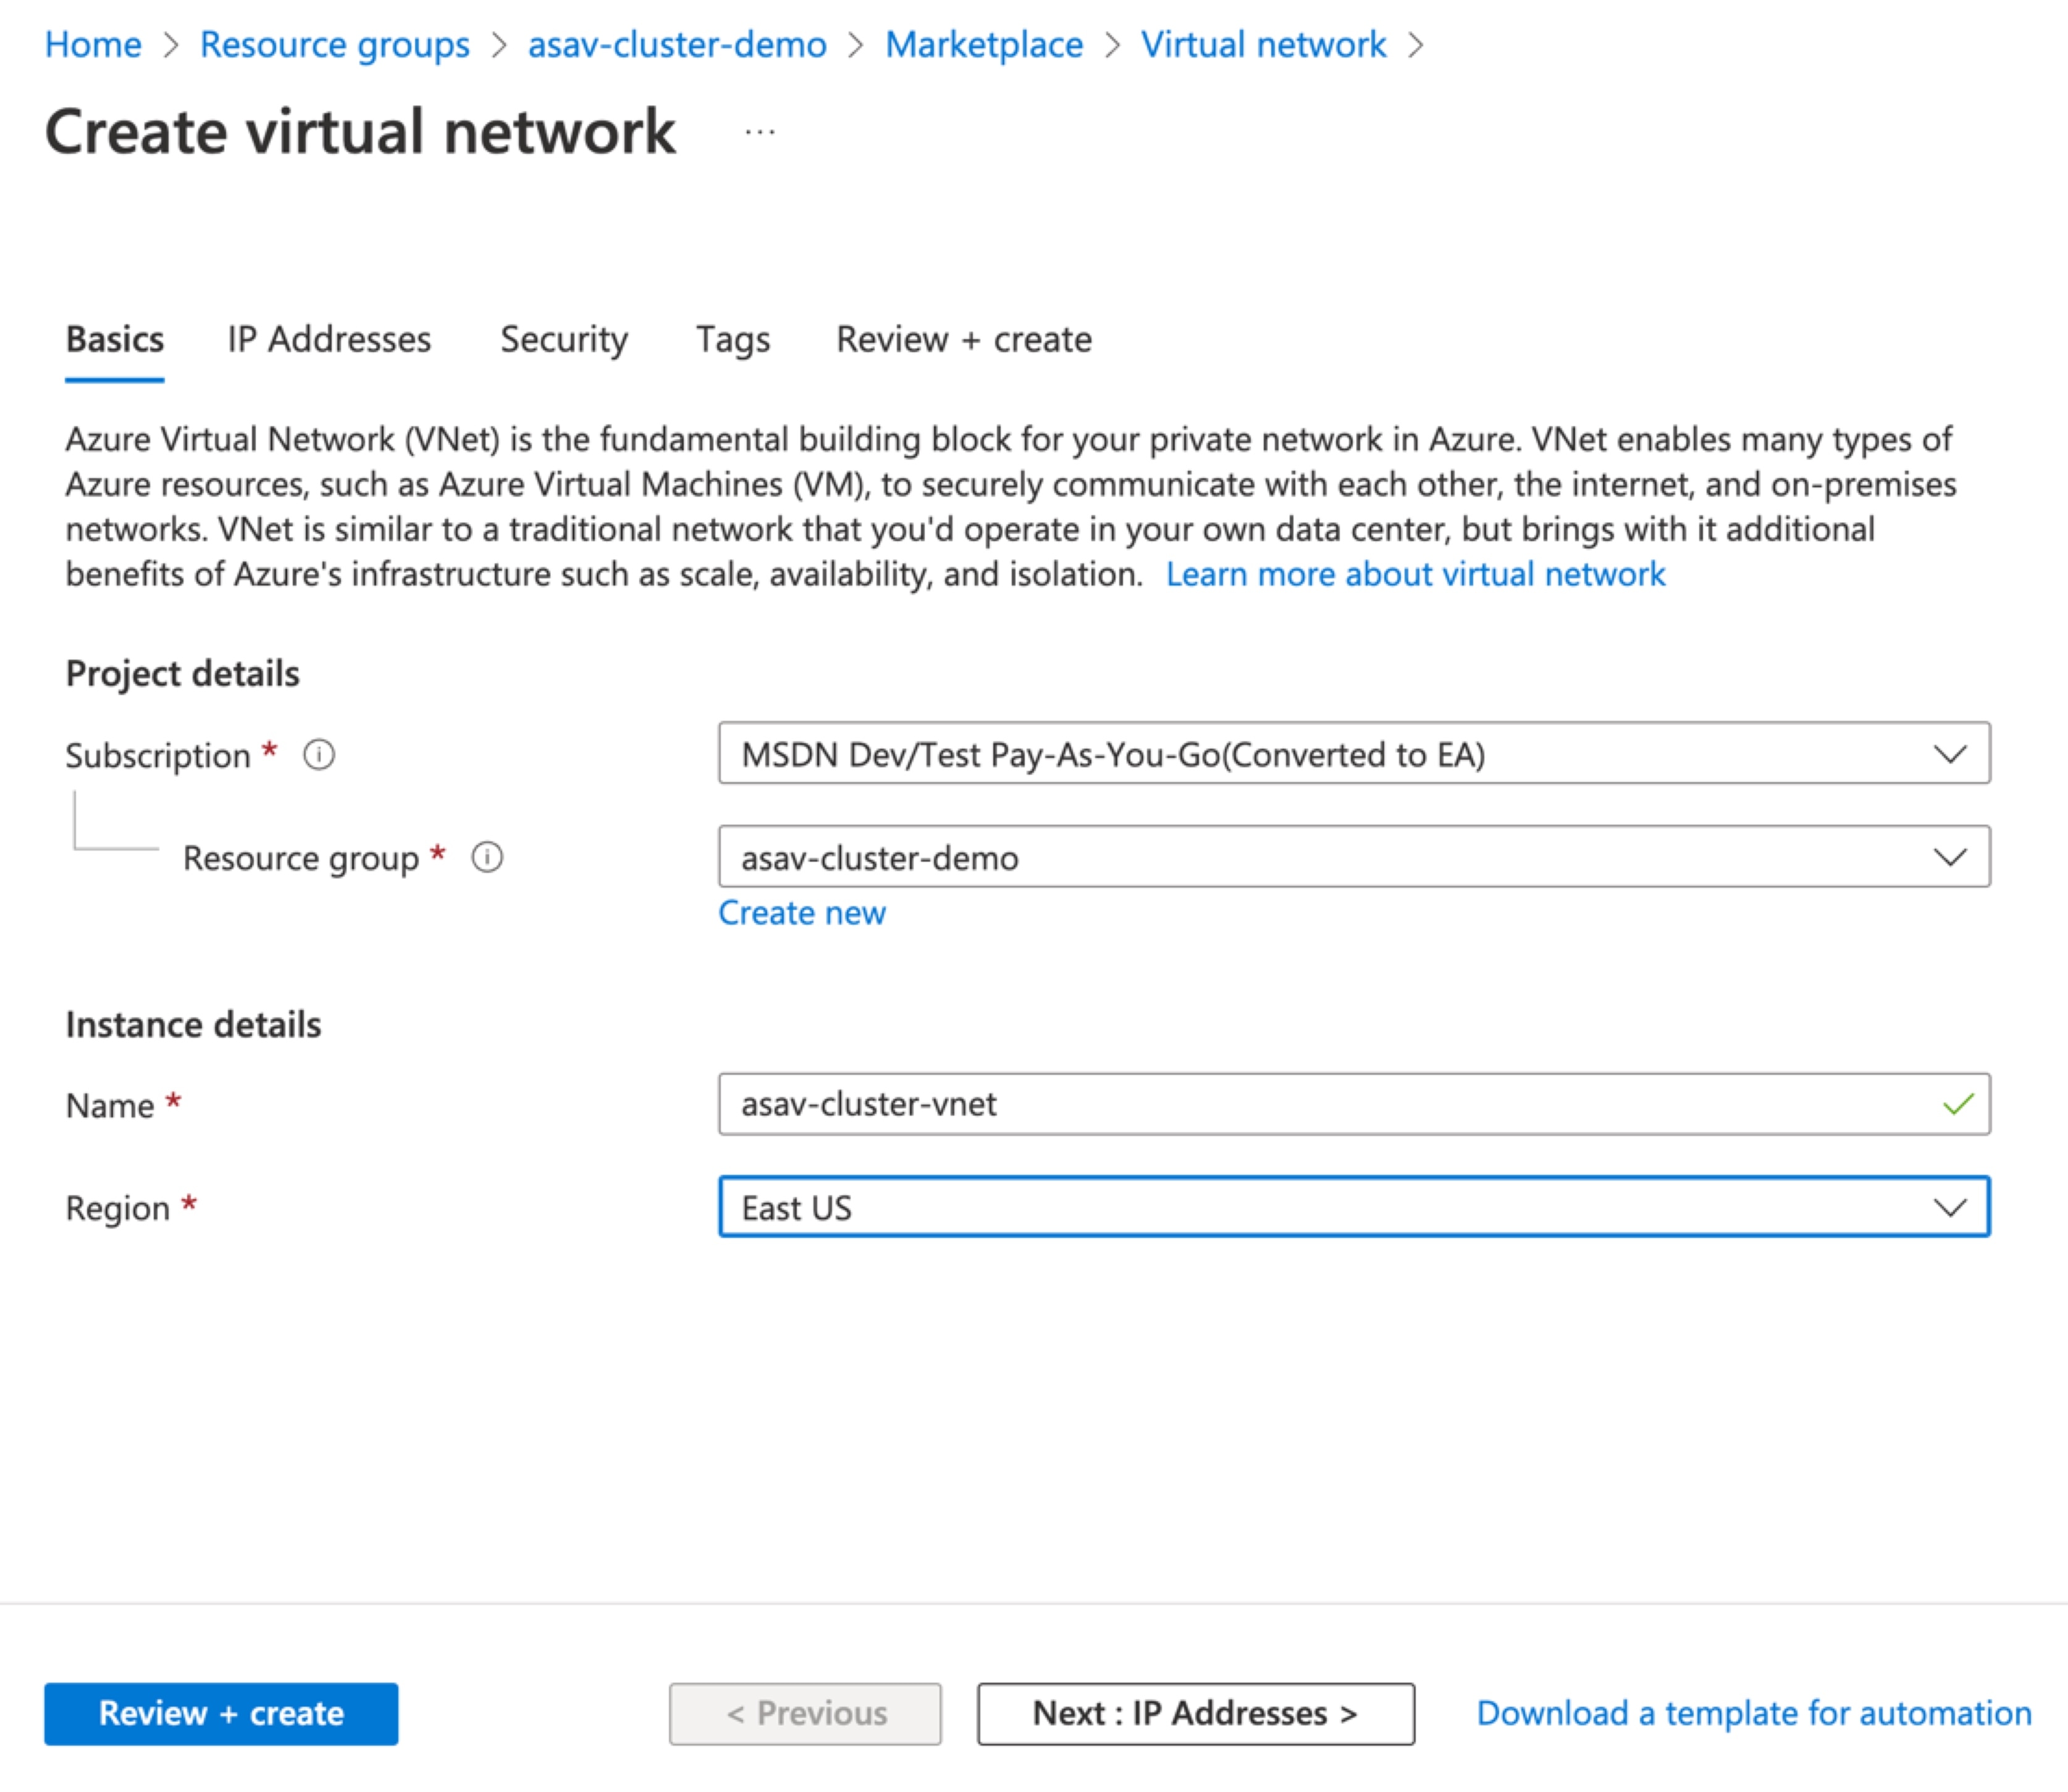
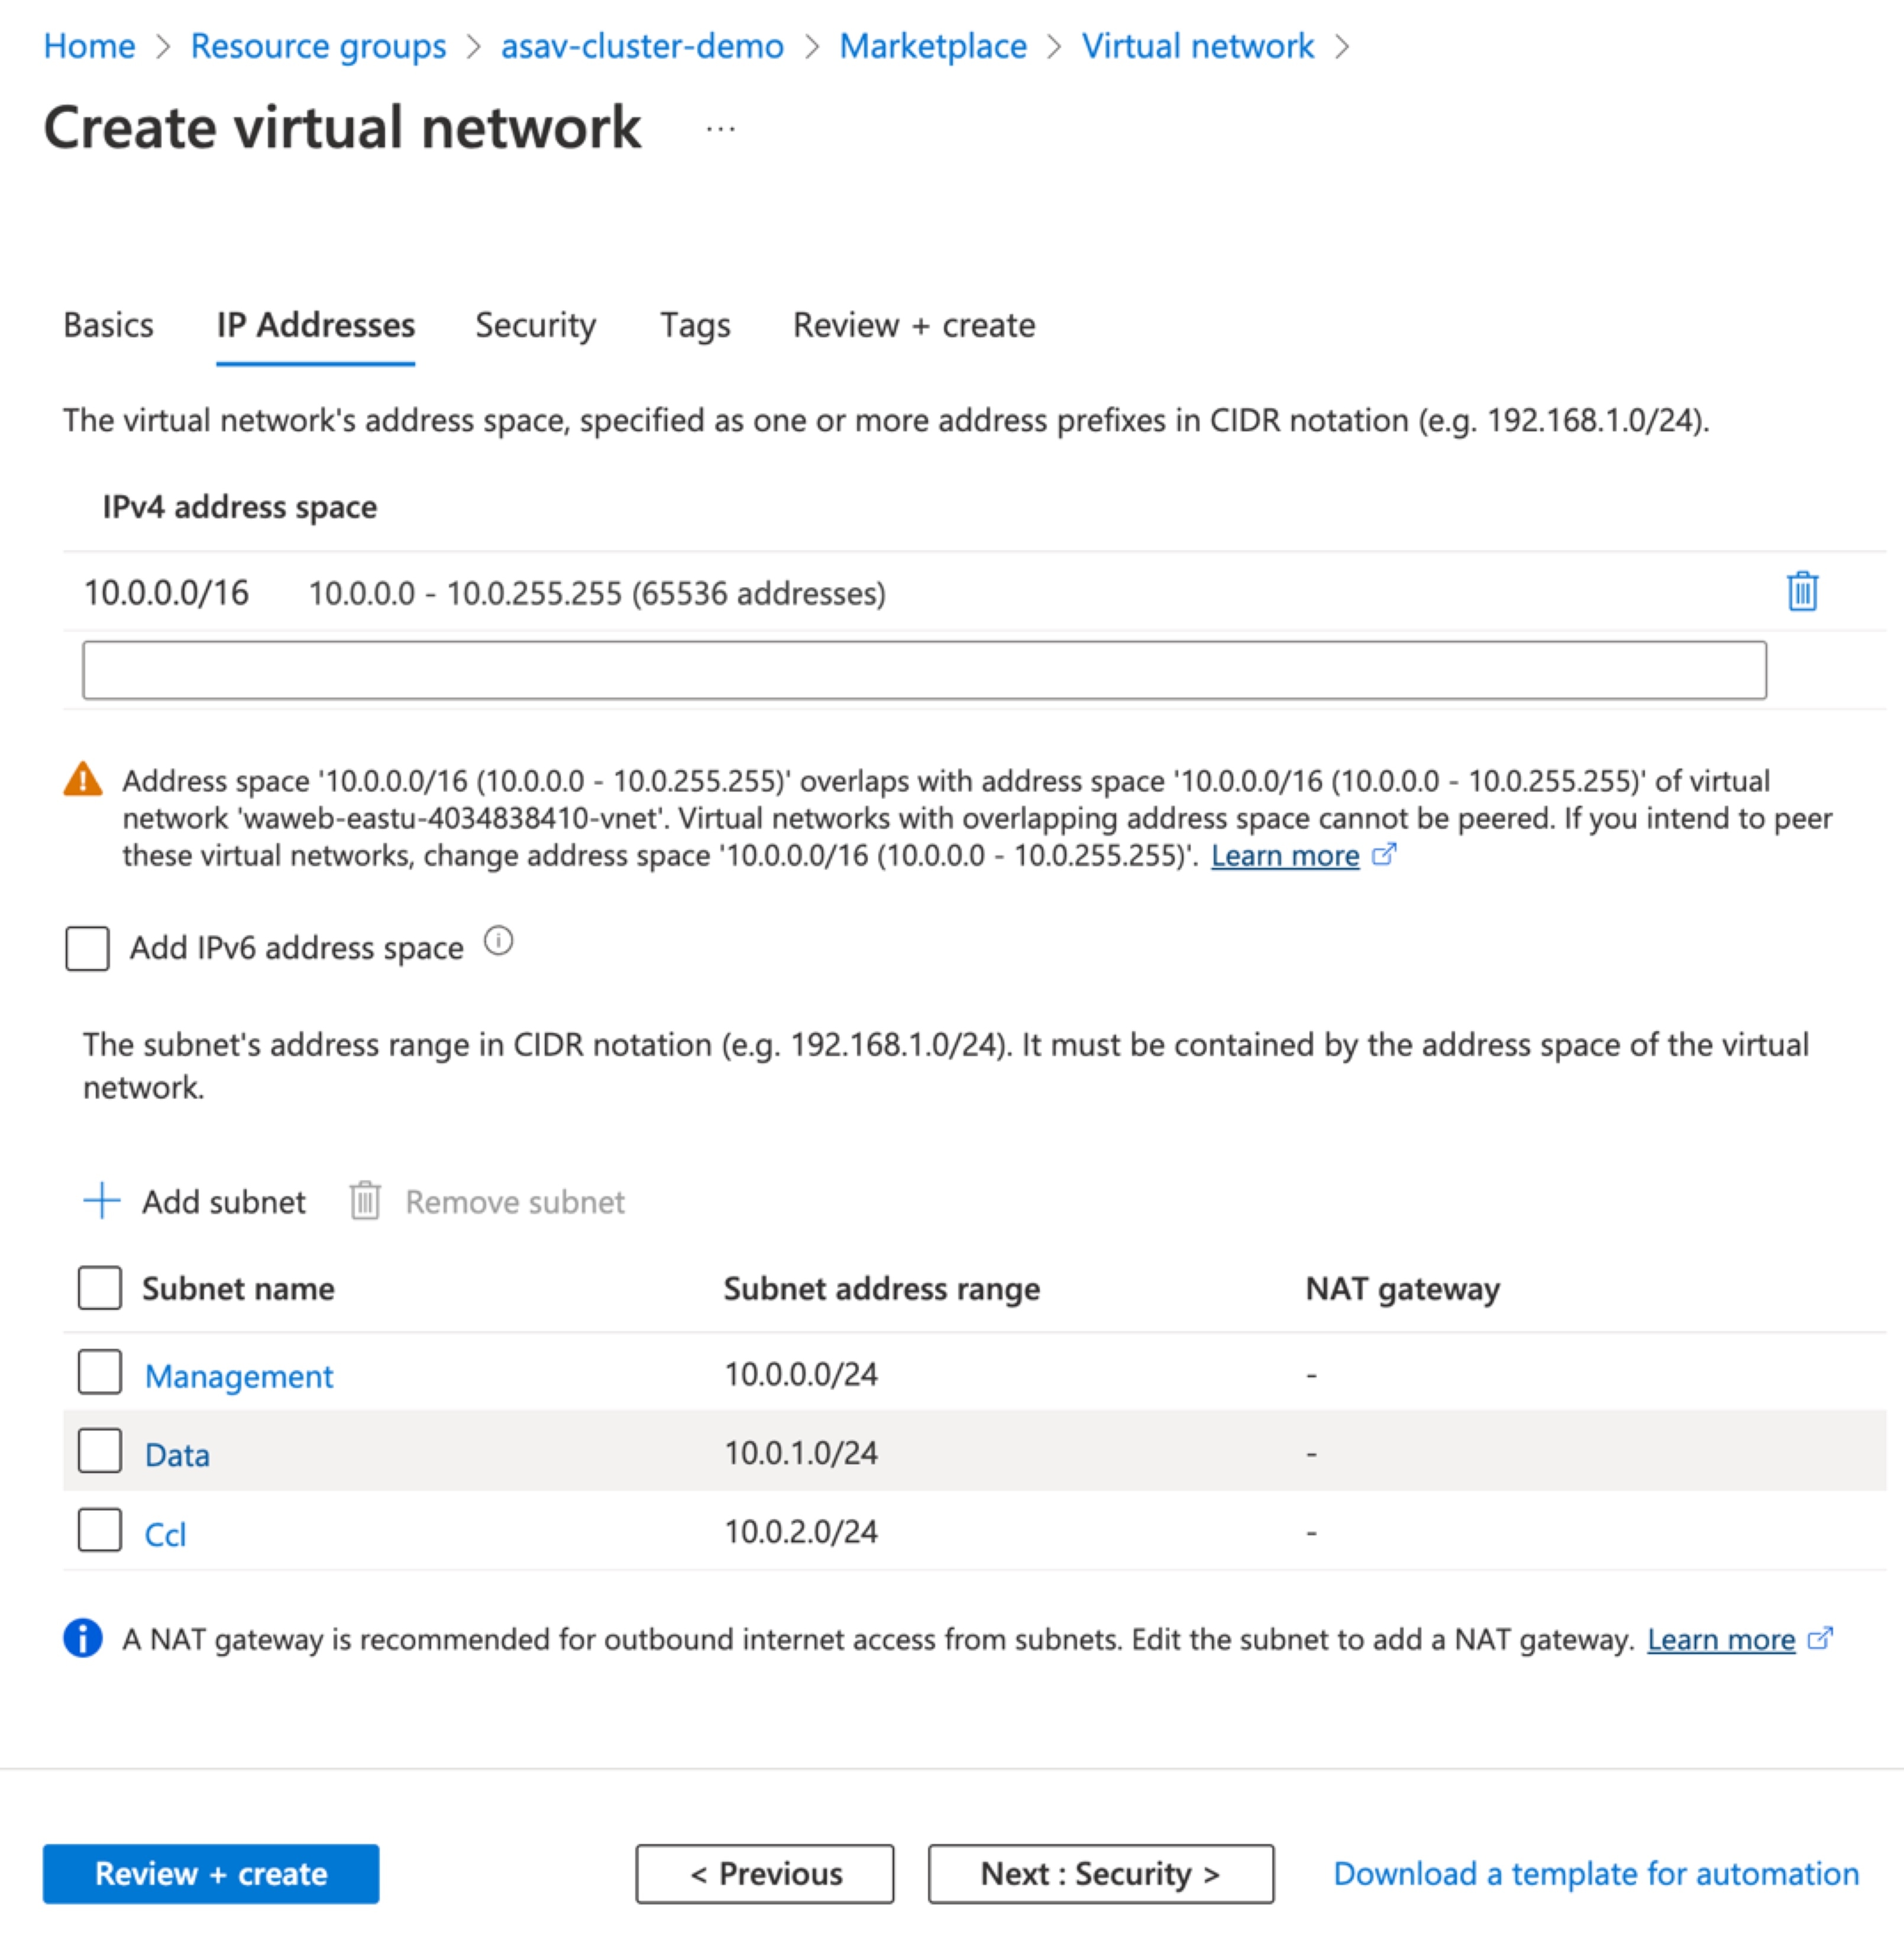
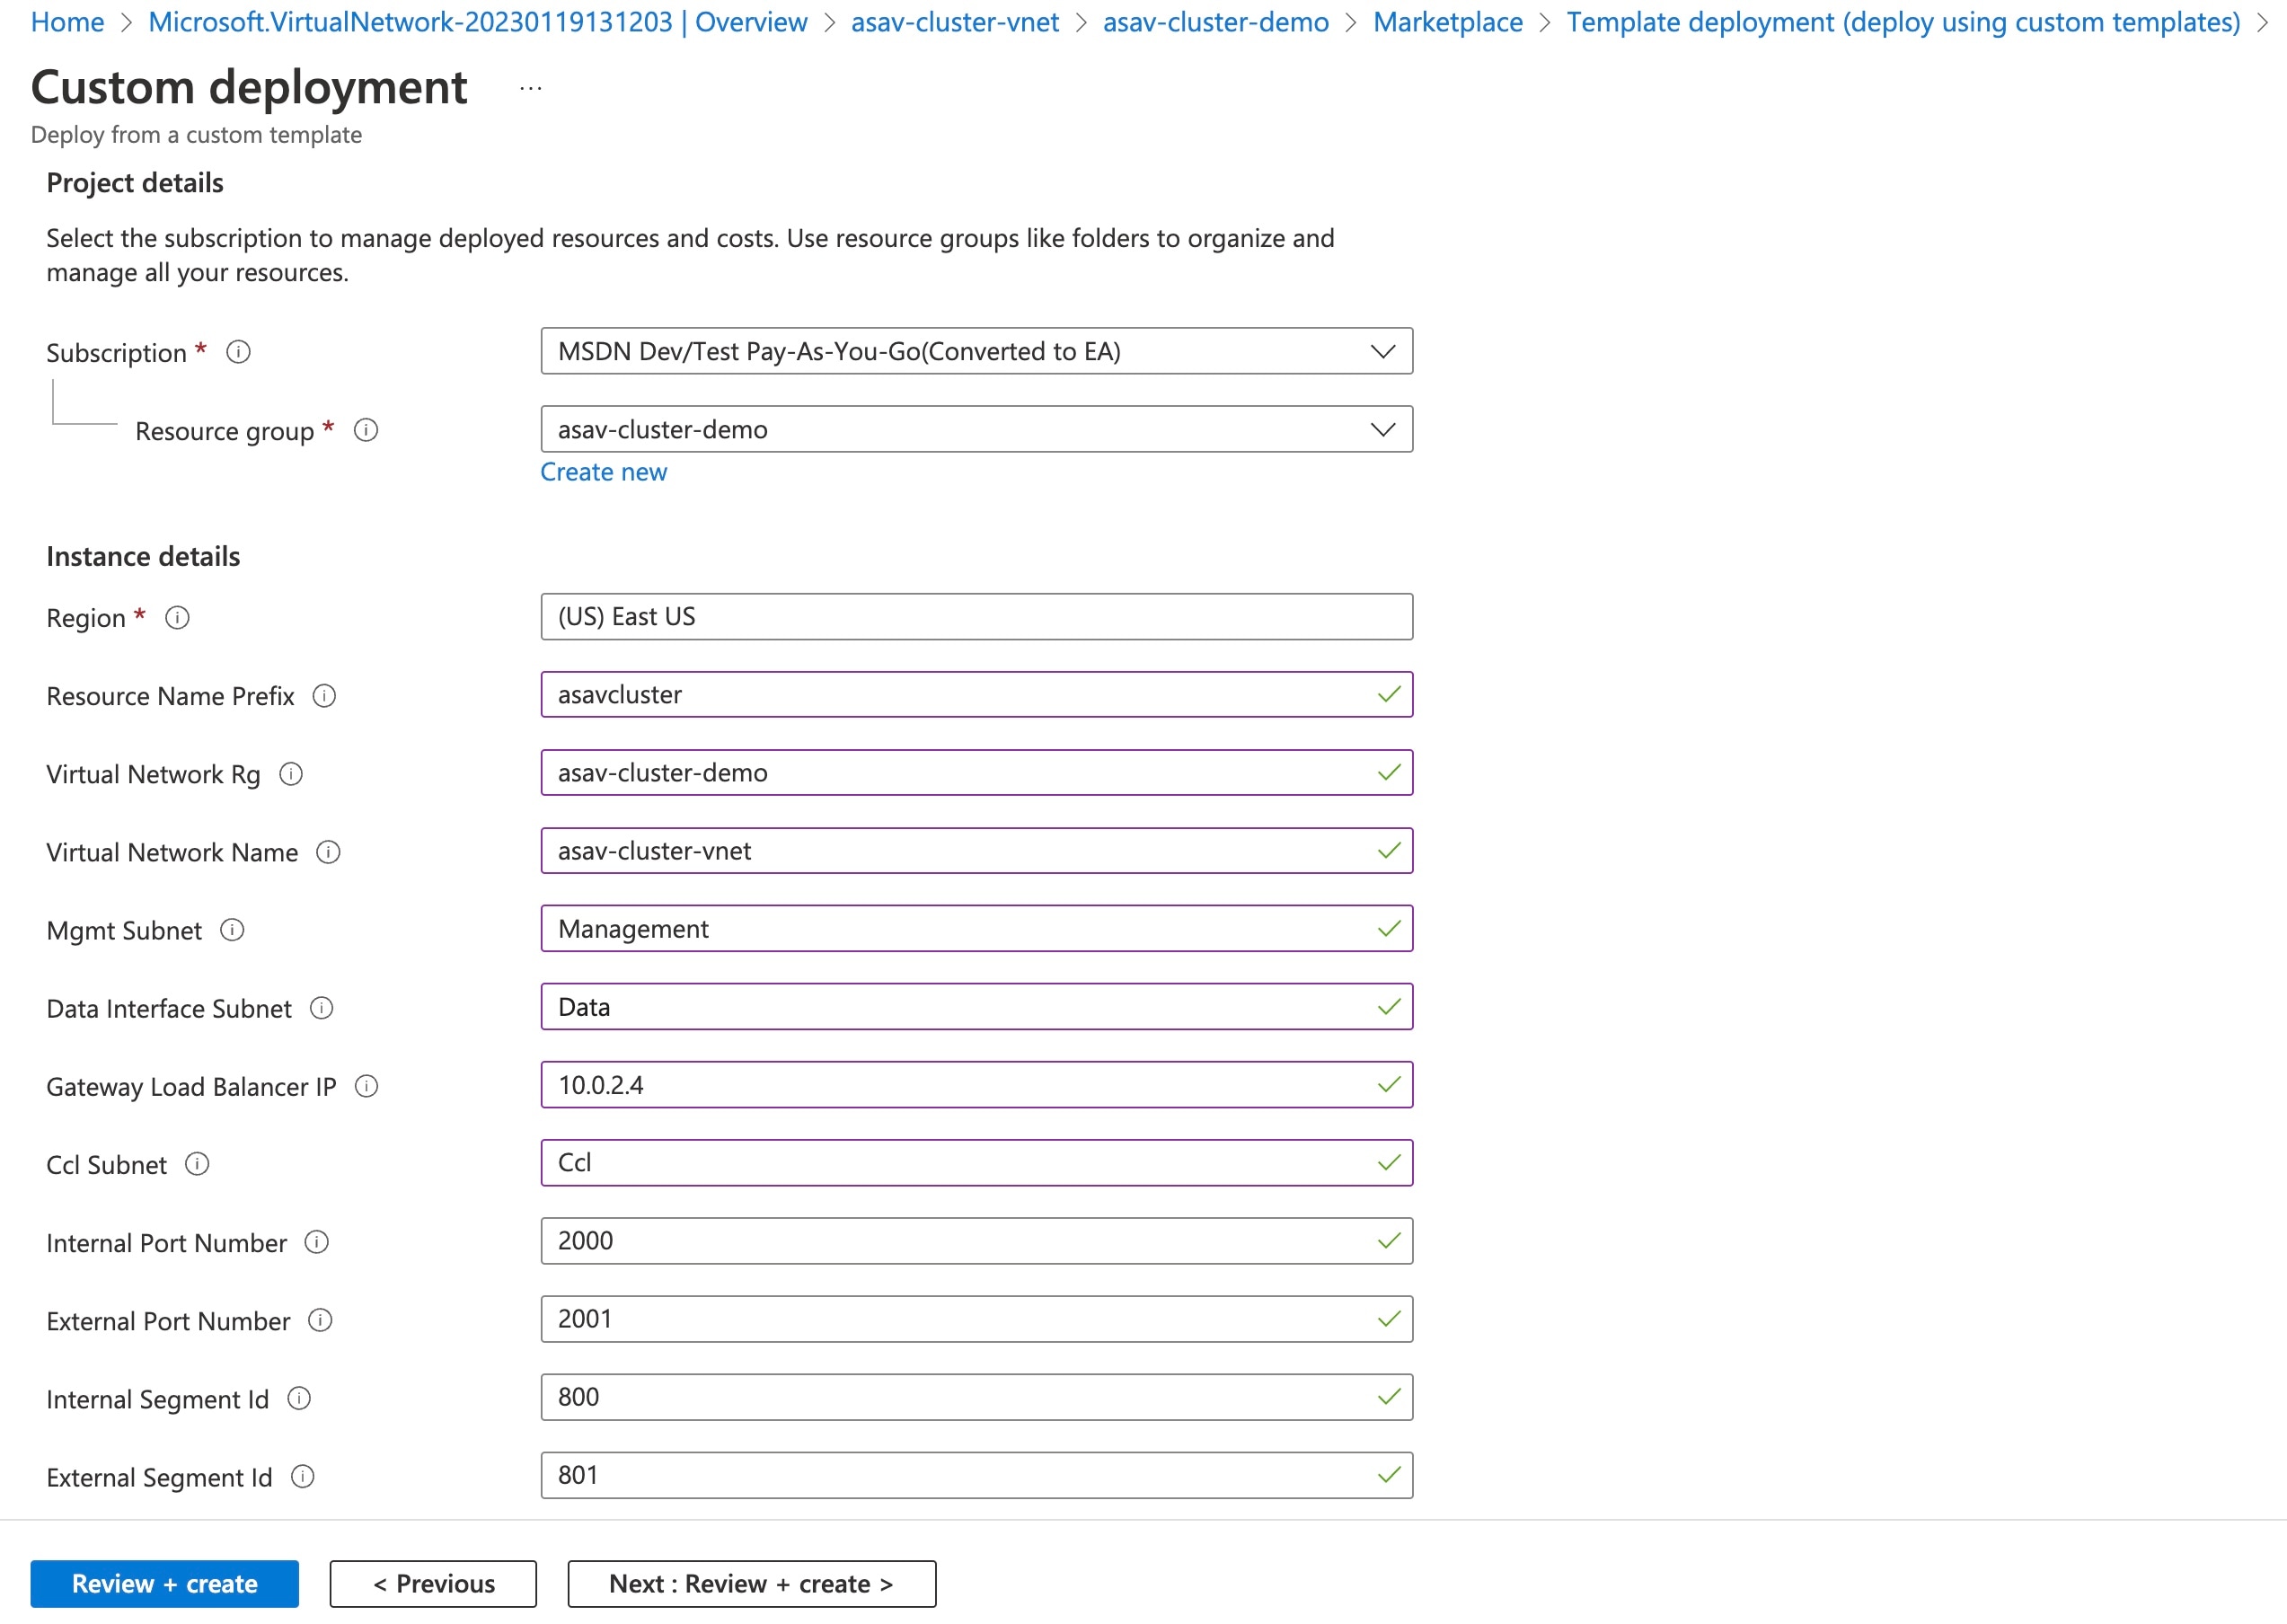
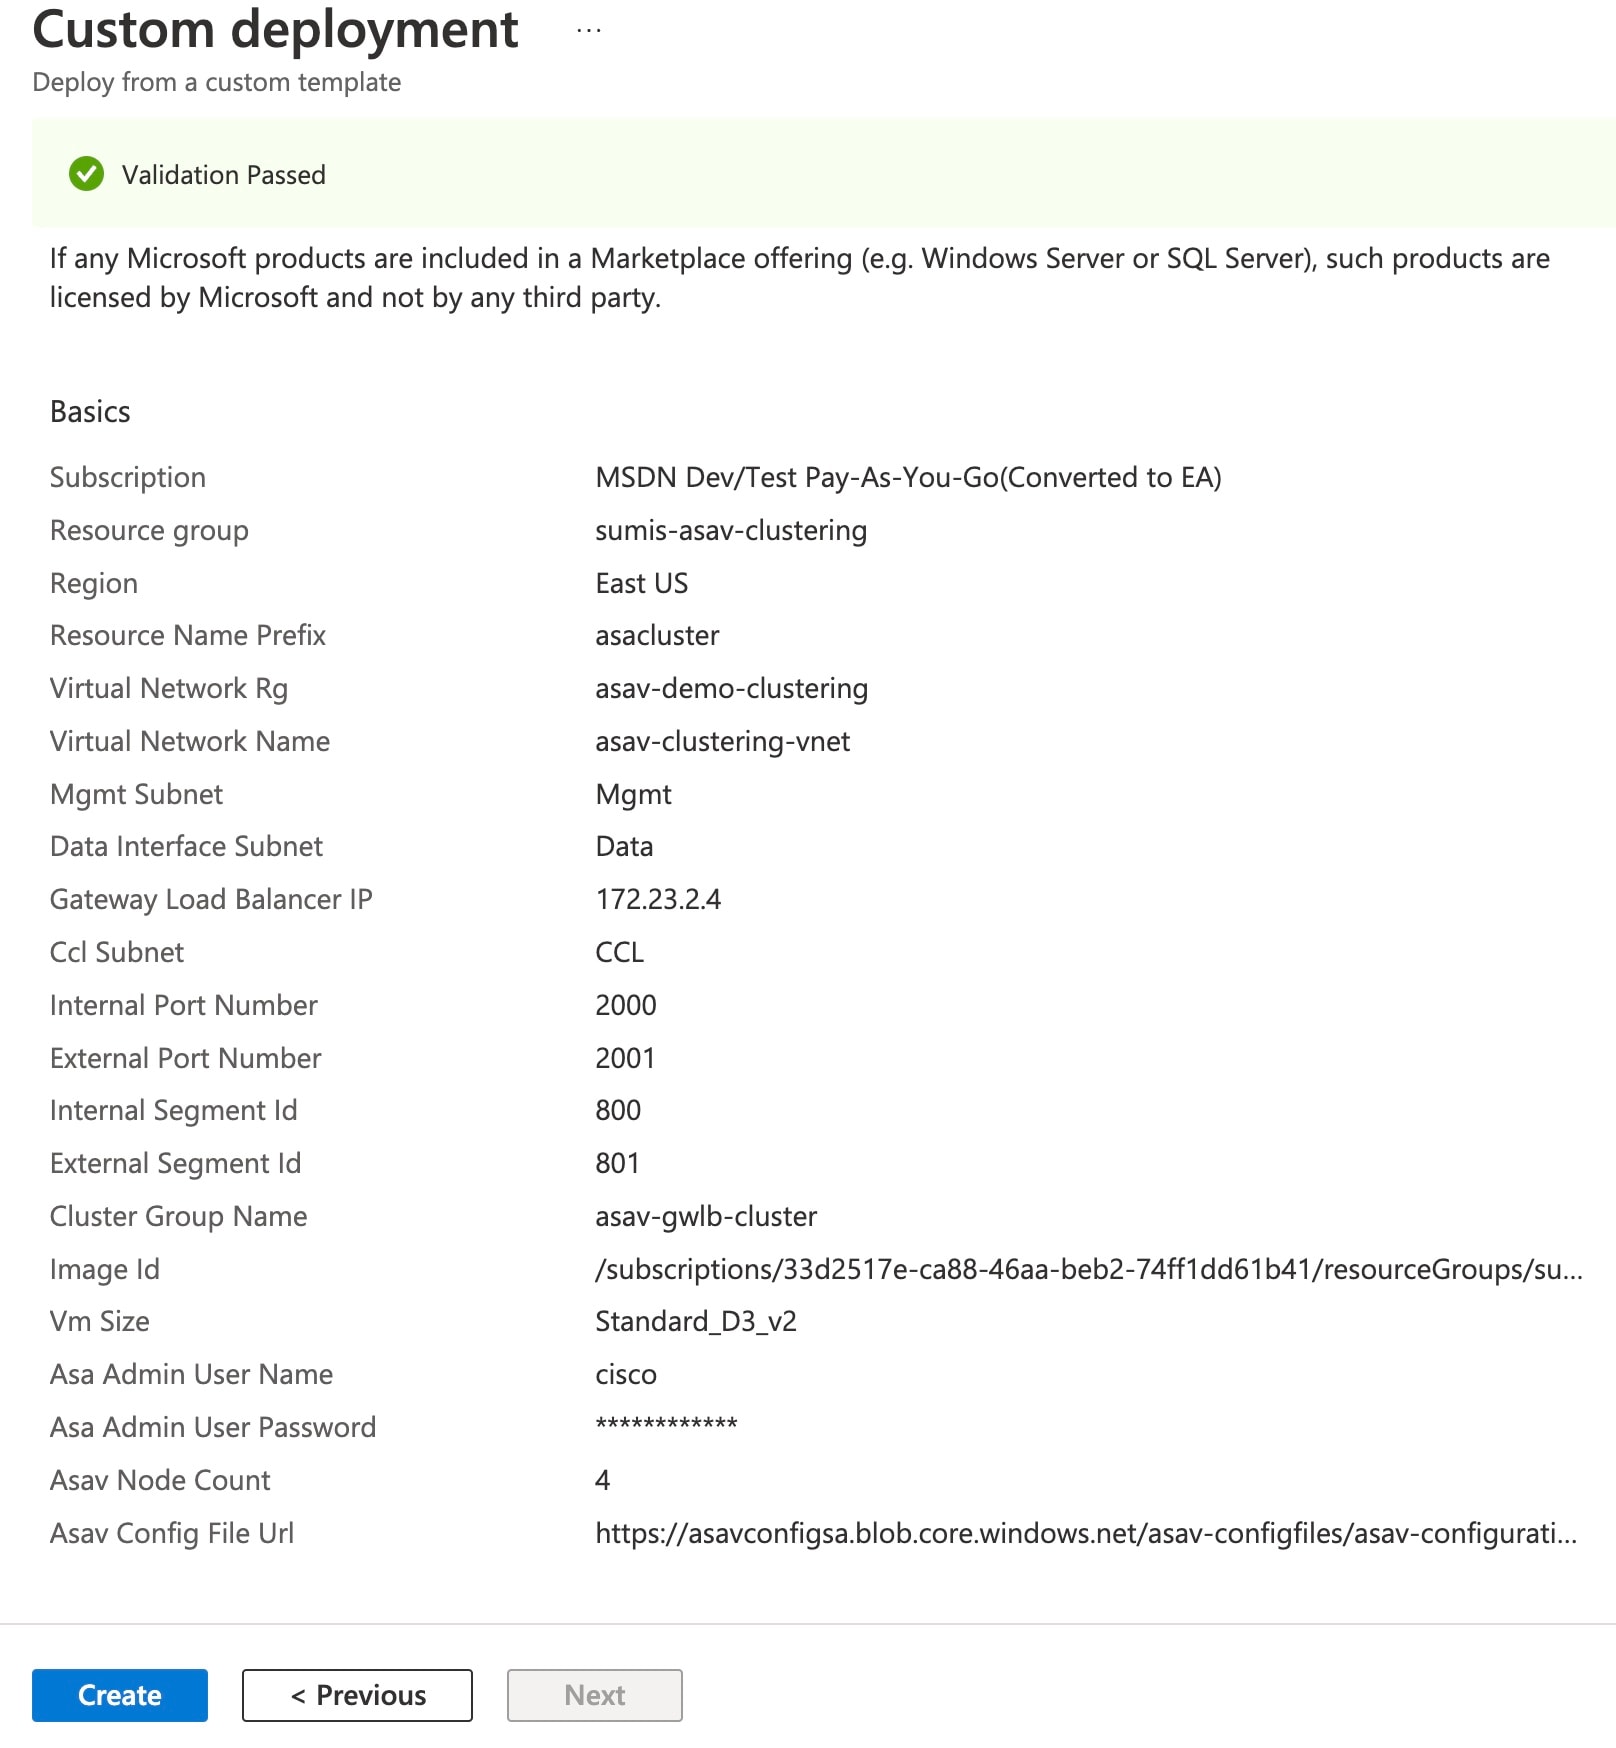
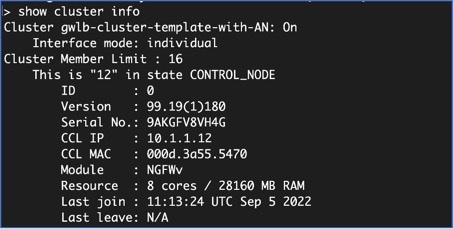
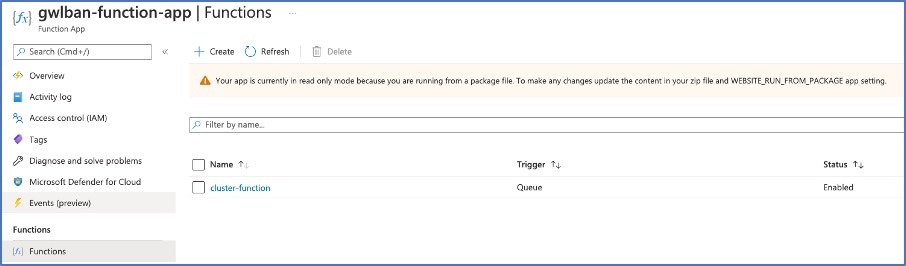
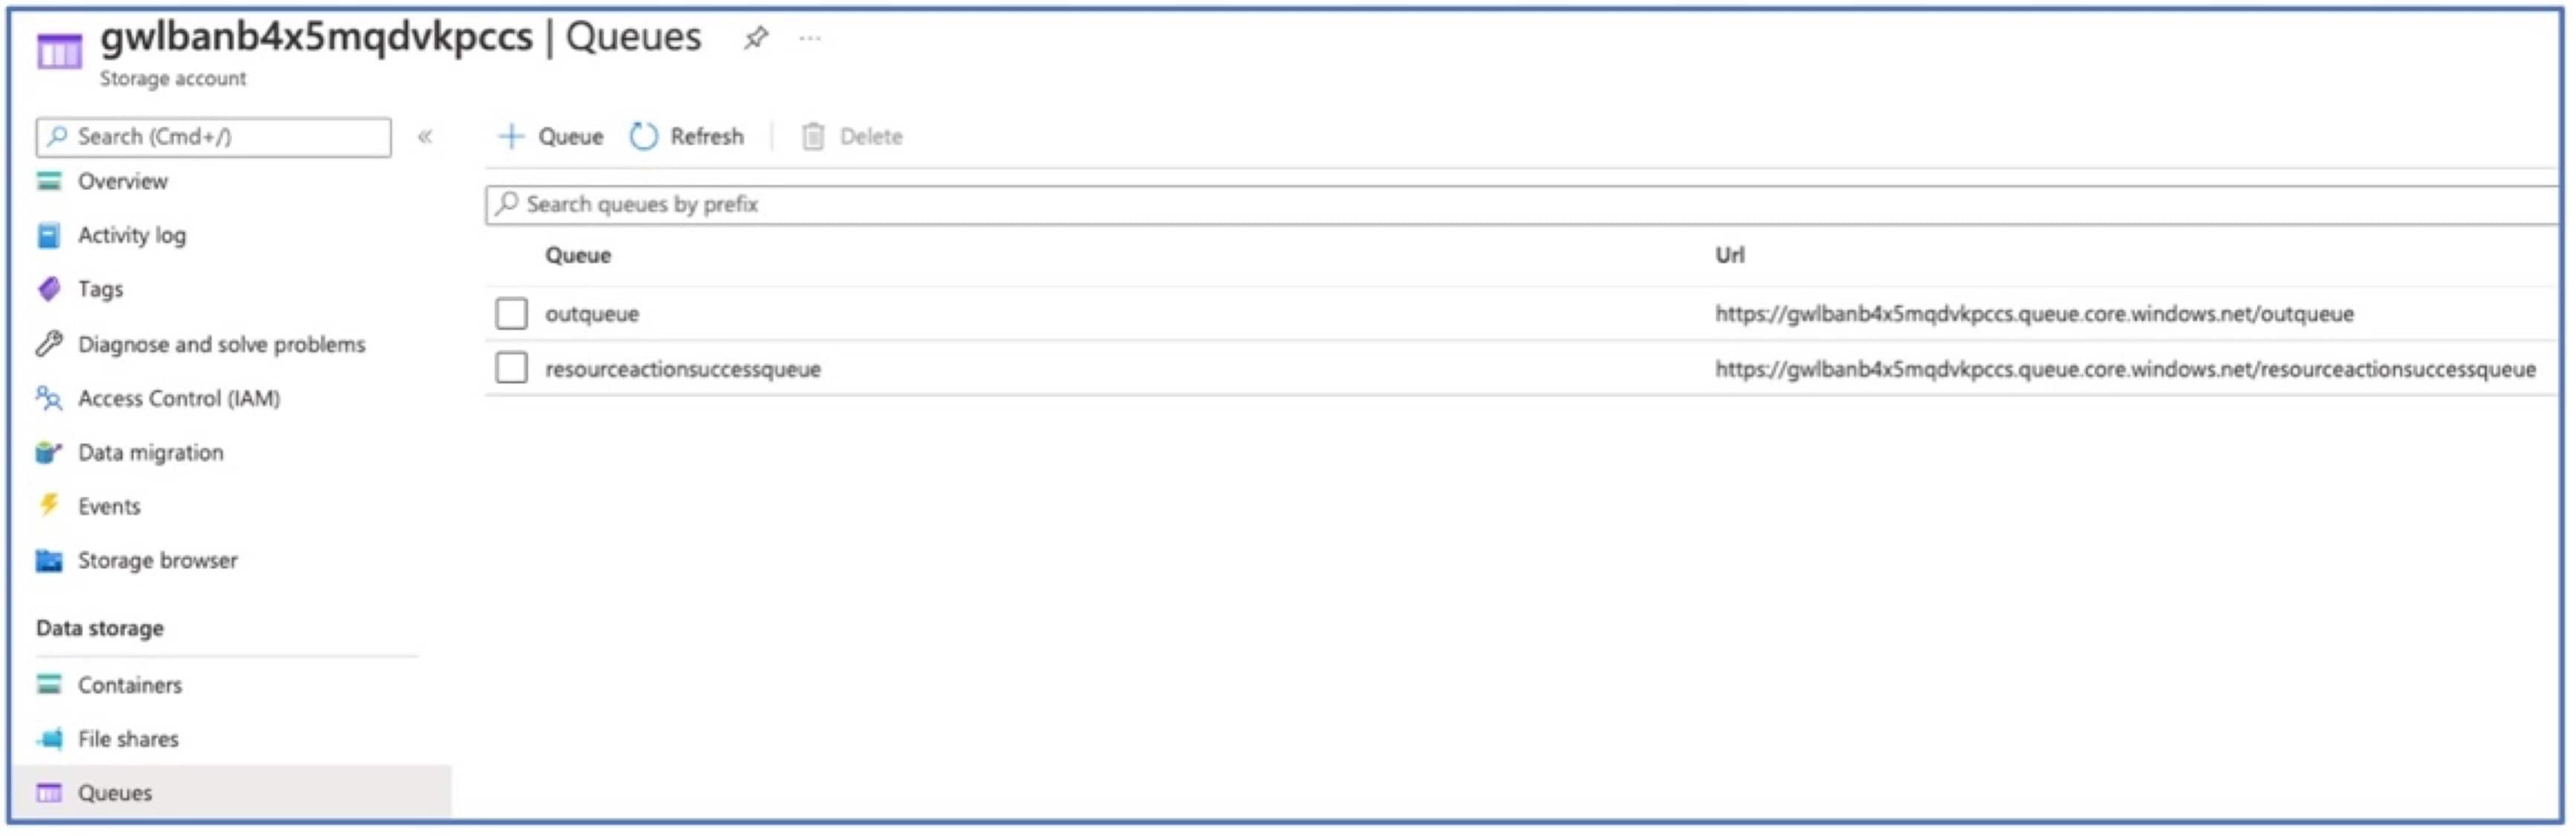
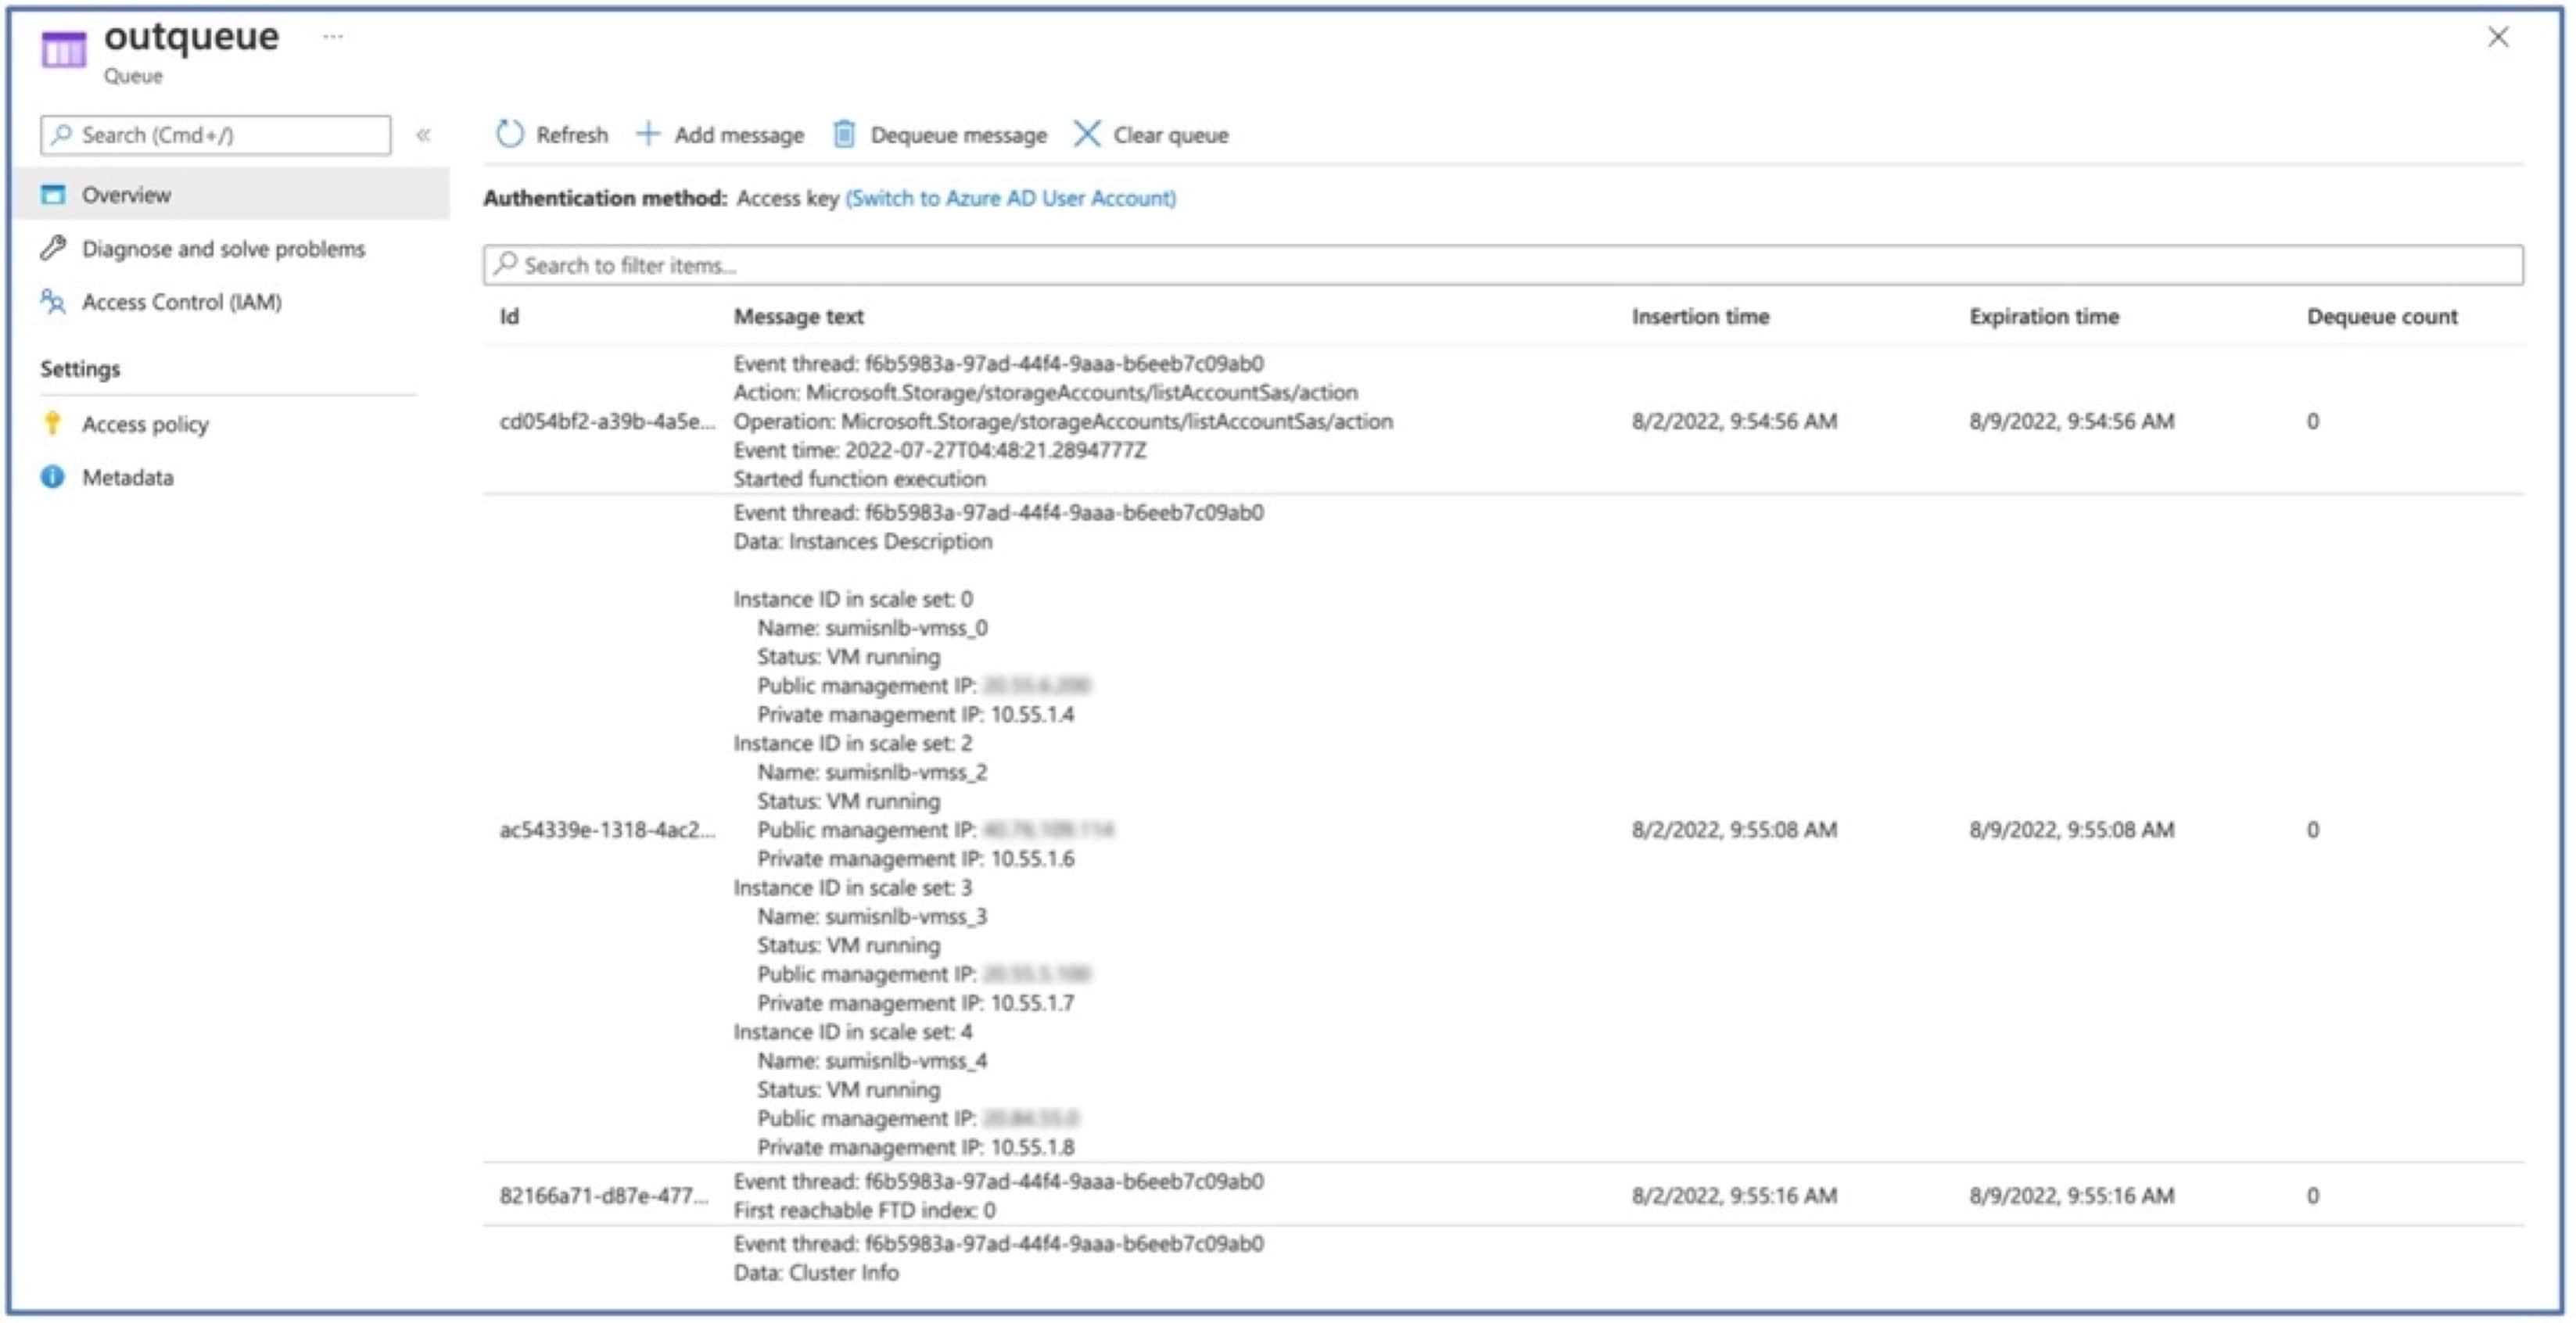
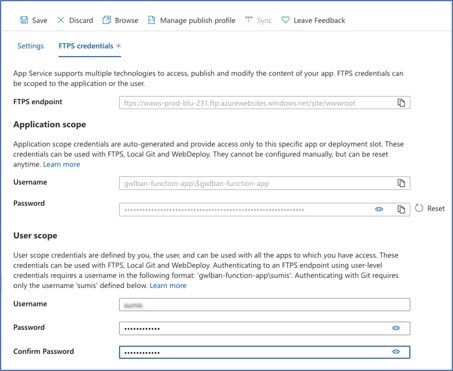
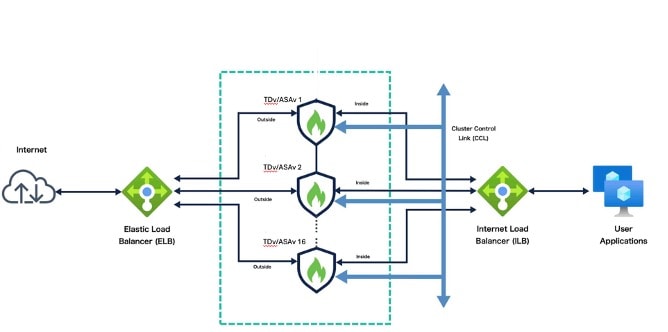

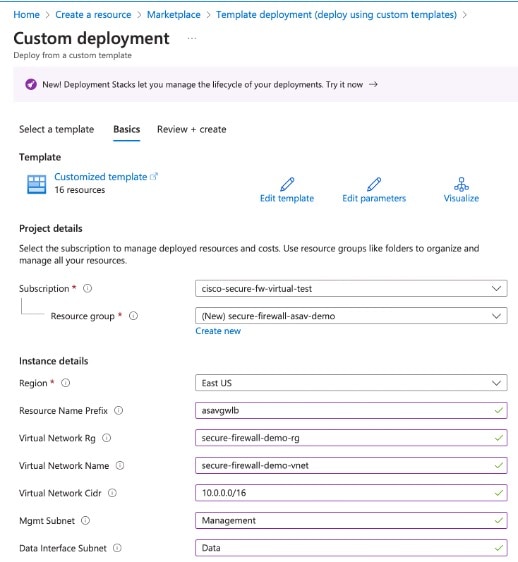
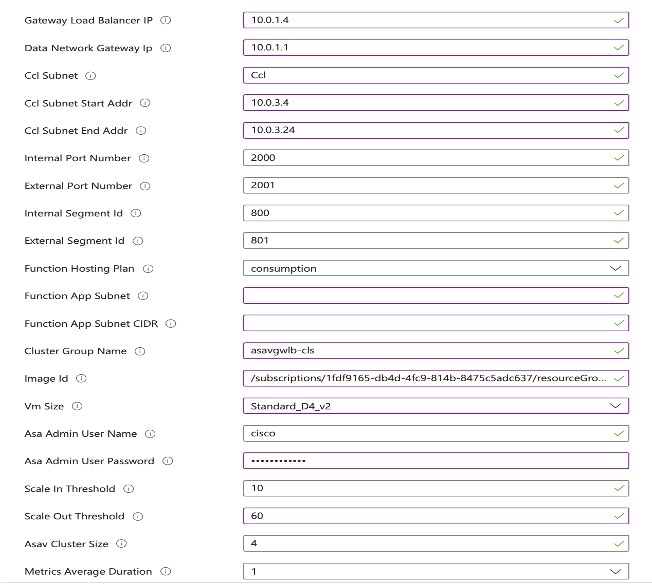
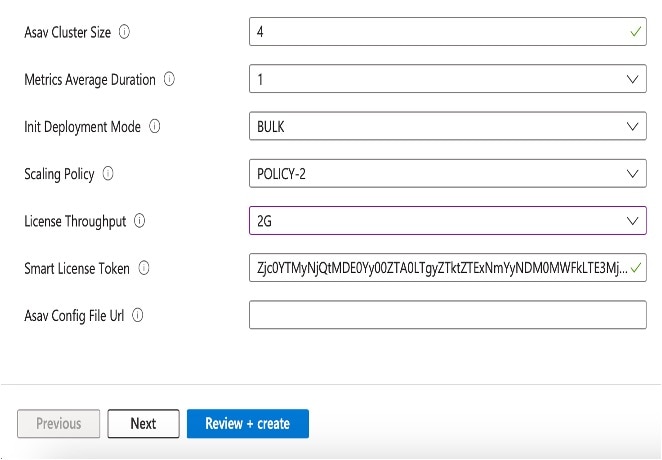
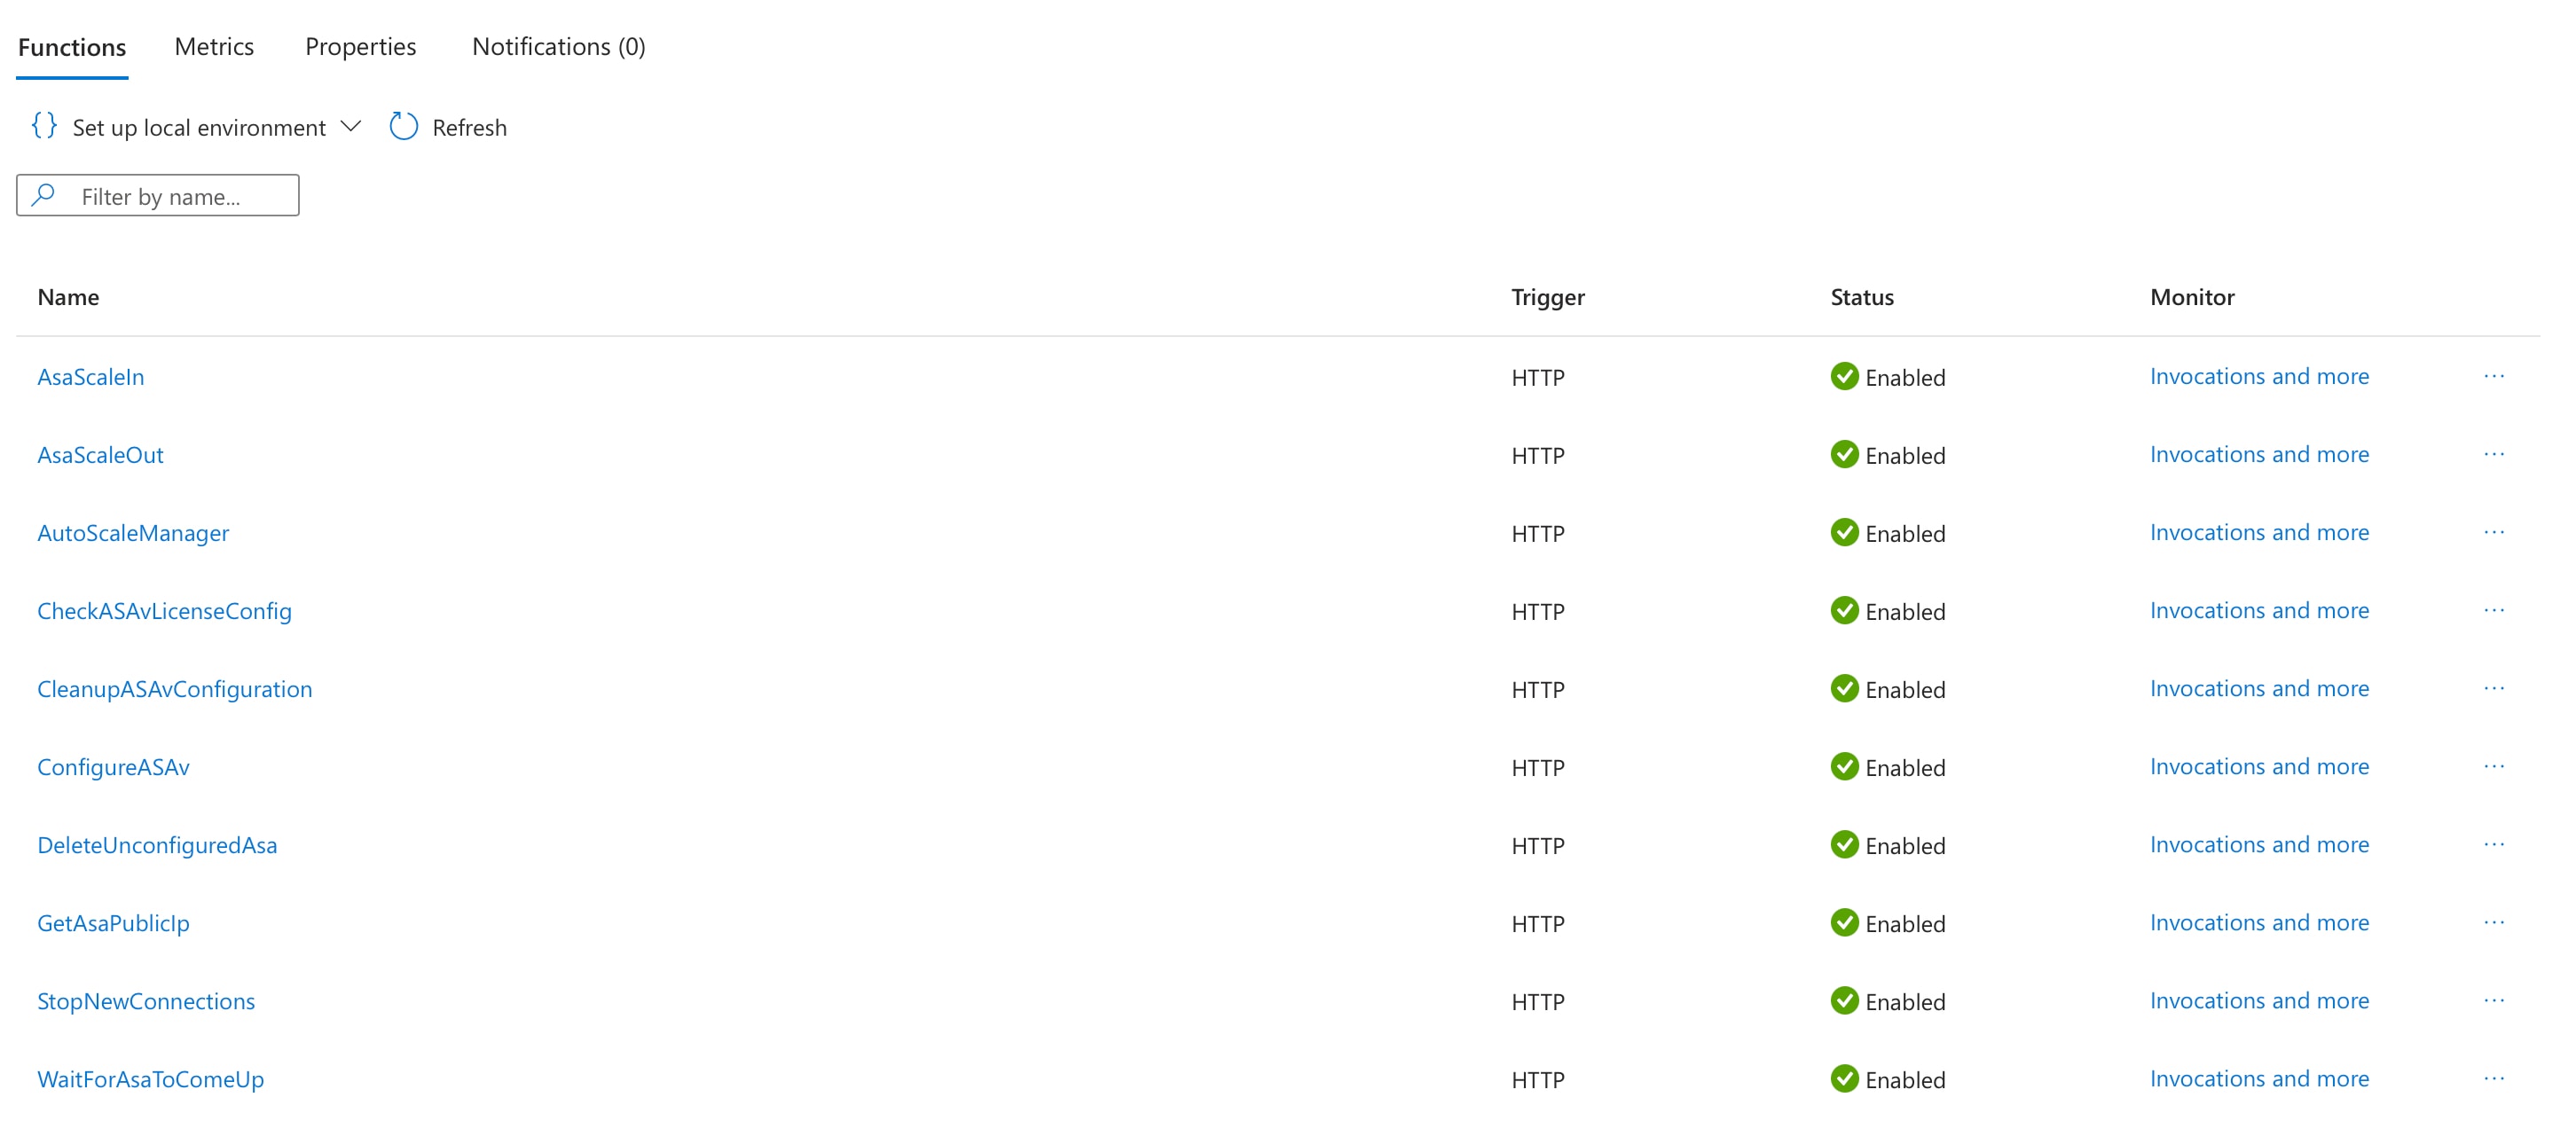
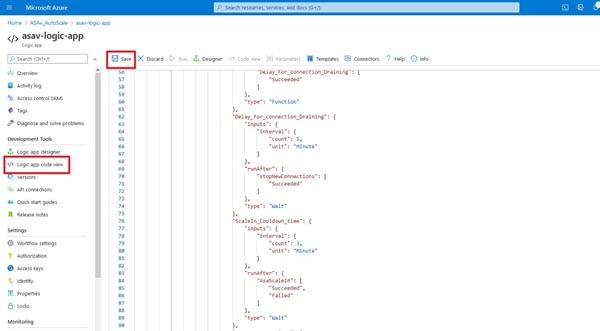
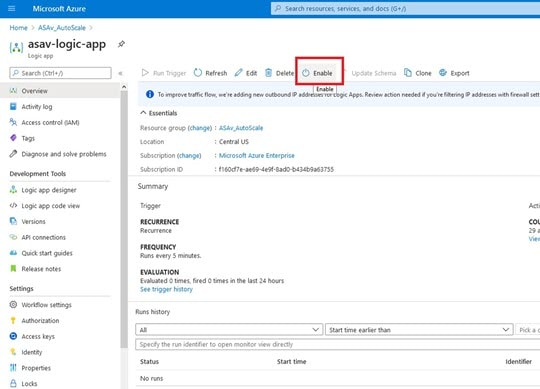
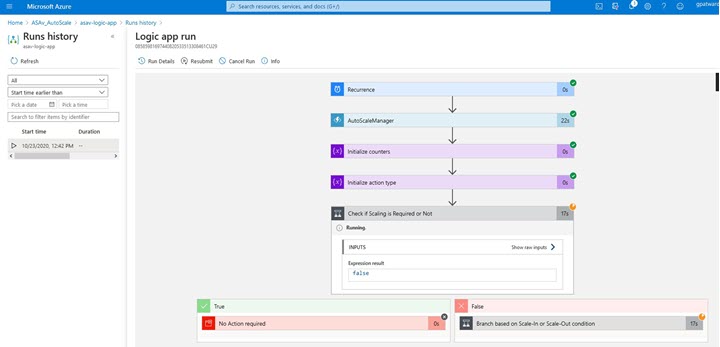
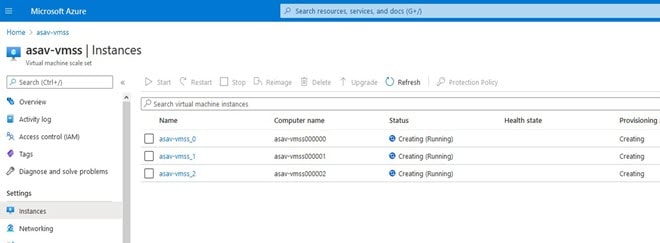
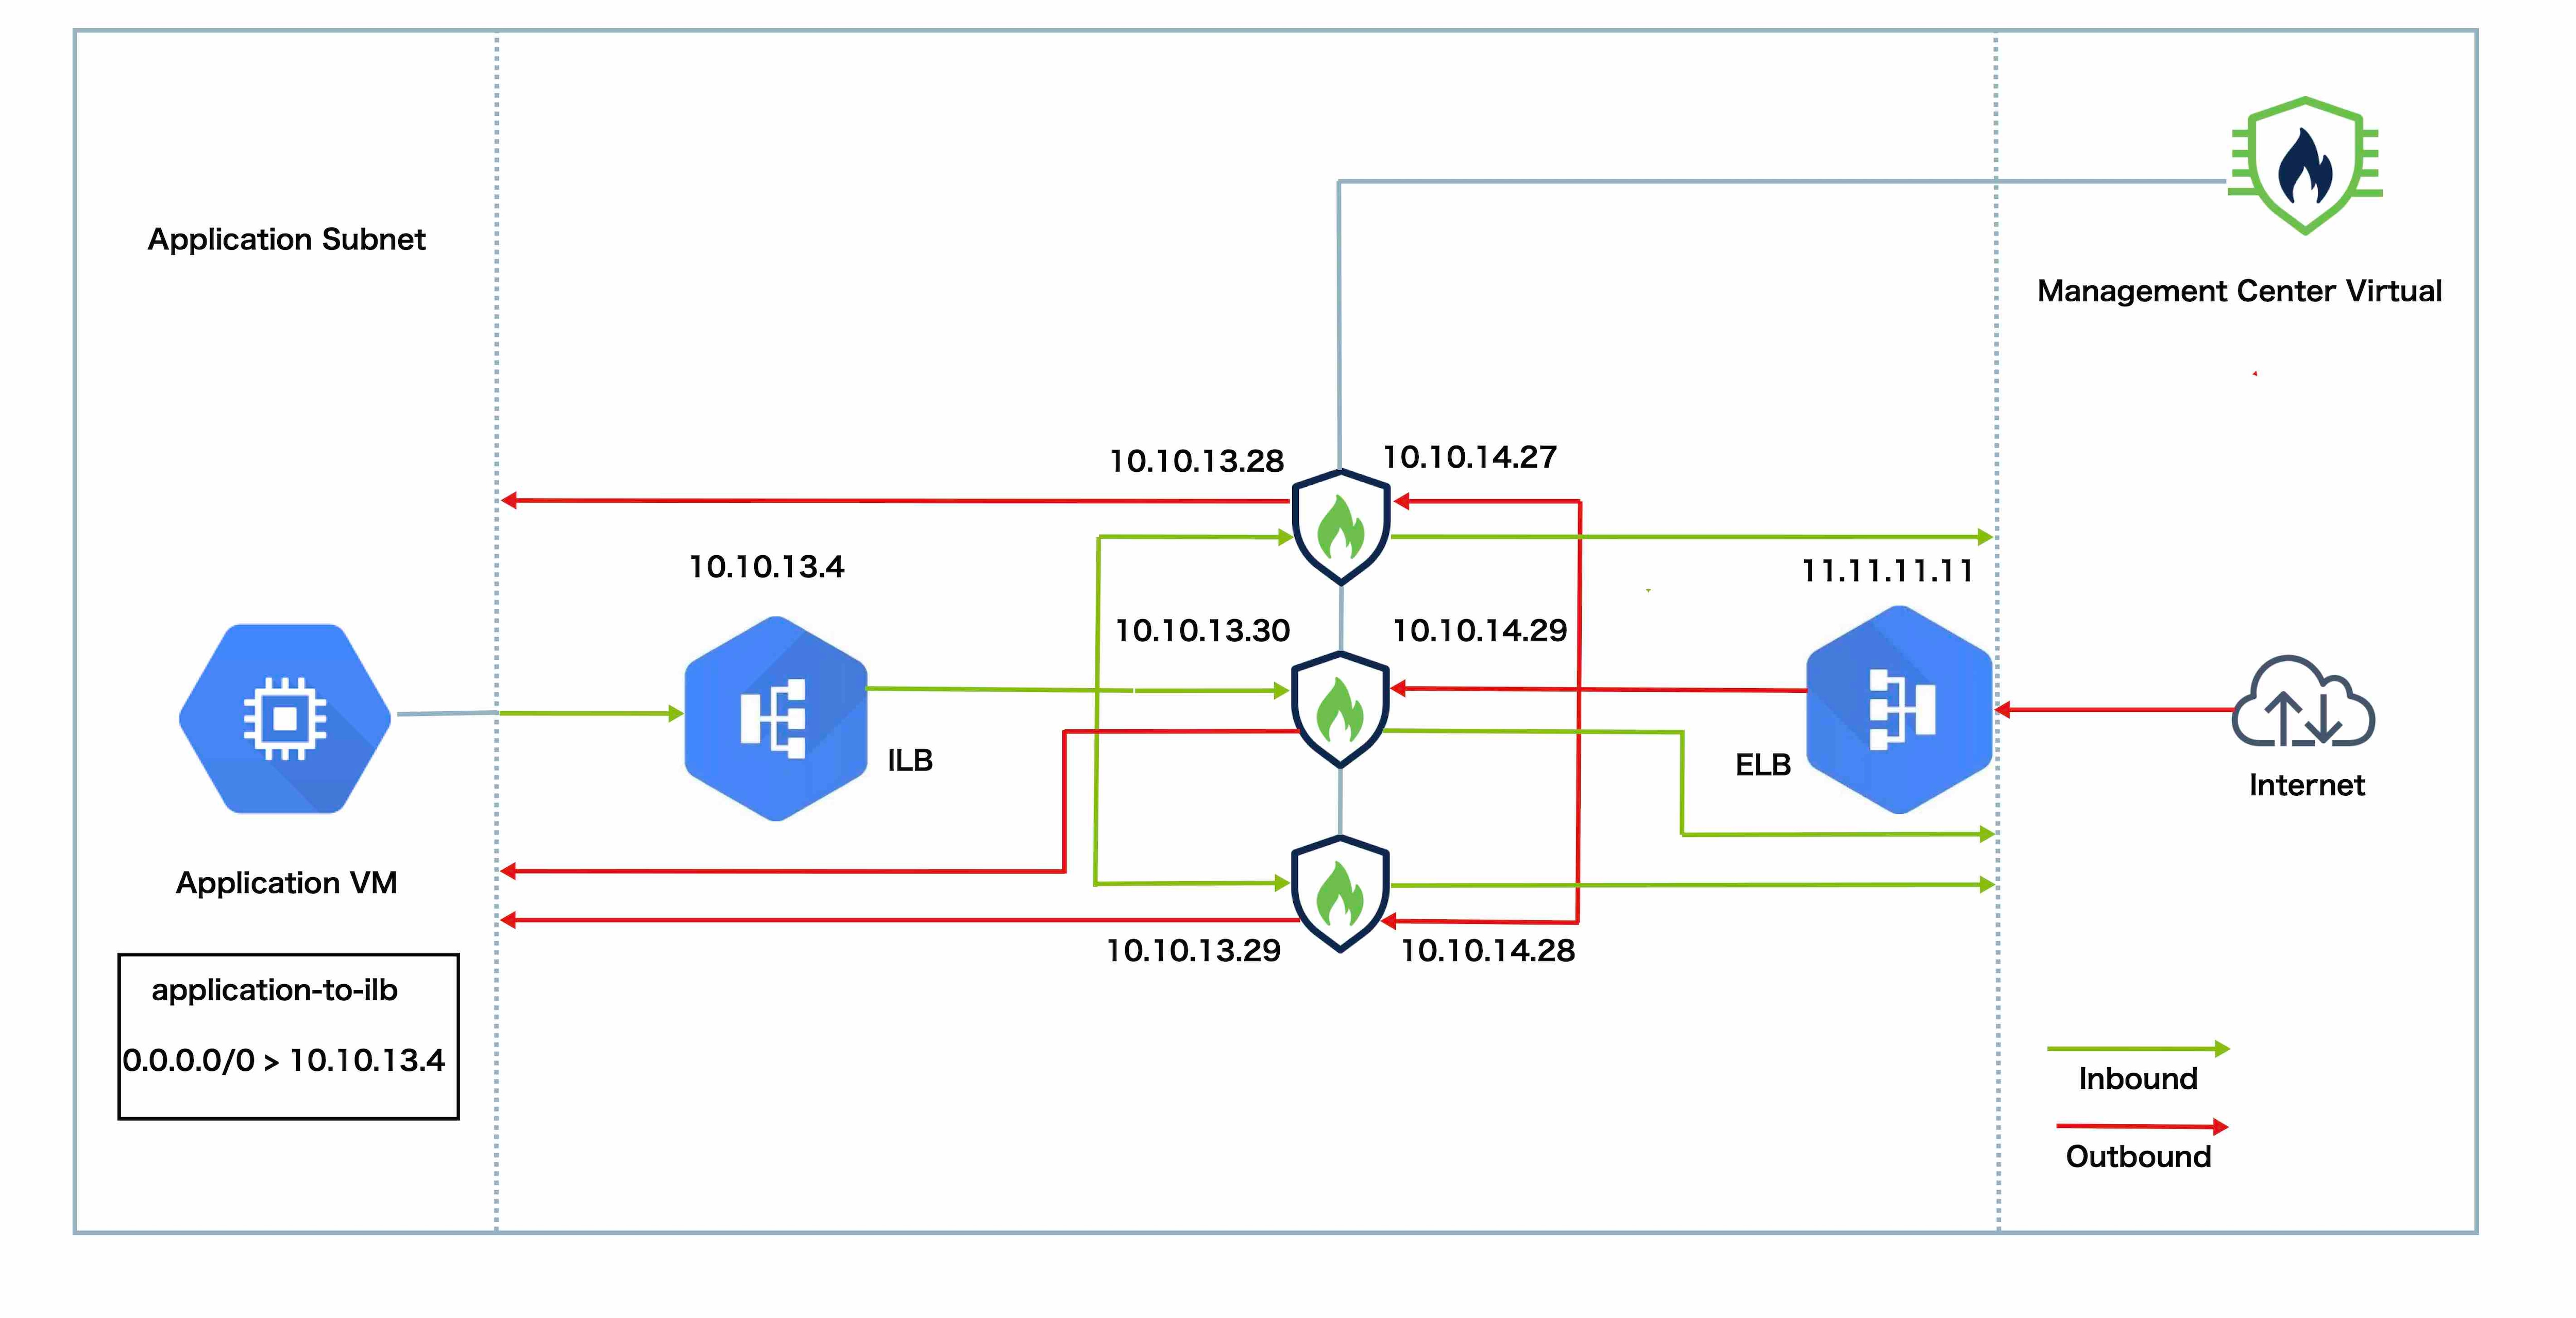

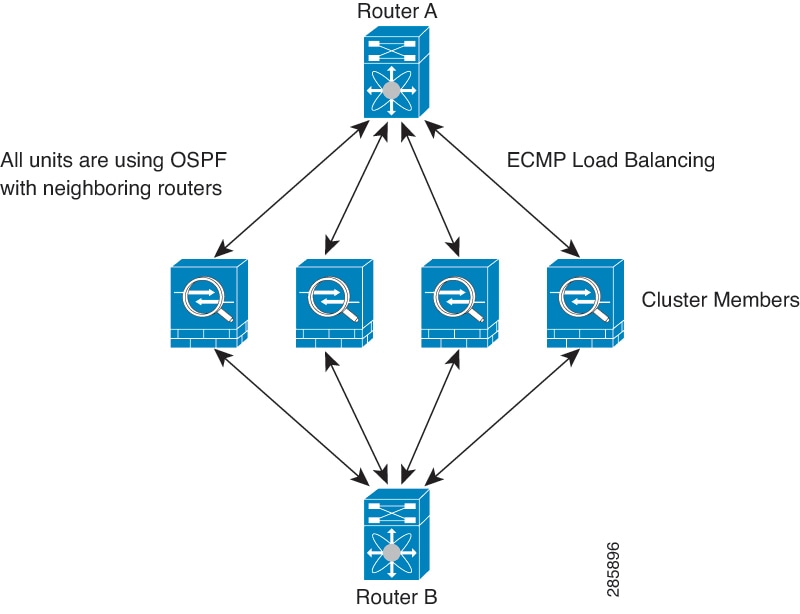
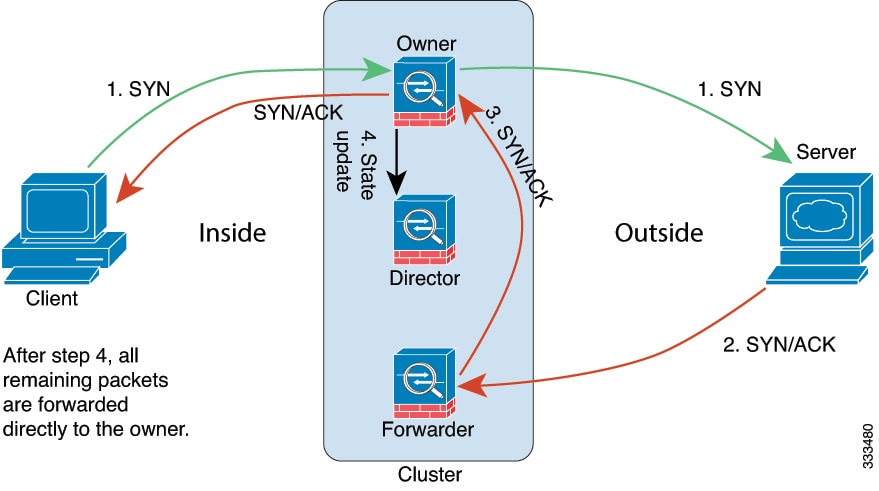
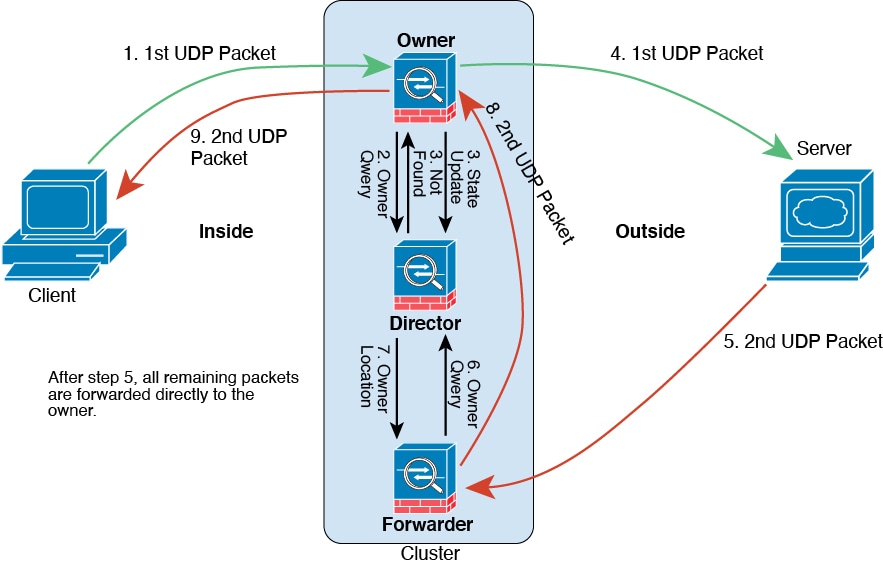
 Feedback