Monitoring System Activity

This section describes how to monitor IoT FND system activity, including the following topics:

Quick Start for New Installs

Quick Start for New Installs prompts you for information to determine the appropriate deployment. No Devices or licenses are added during the Quick Start Process. When you first open a new install of FND software, the DASHBOARD page appears and you select QUICK SETUP.

To quick start for new installs:

Procedure


Step 1

At first login, as a root user, click Dashboard. A No Devices or Dashlets panel appears, which displays the following options:

  • ADD LICENSE

  • ADD DEVICES

  • ADD DASHLET

  • GUIDED TOUR

Step 2

Click GUIDED TOUR.

Note

 
You may need to add a license or create a dummy device to enable the Guided Tour. The Guided Tour feature must be enabled by the first-time FND root user that logs into the FND system before you can use the feature.

Step 3

At the root user menu (upper-right corner) that appears, select Guided Tour. This opens a Guided Tour Settings window that lists all available Guided Tours:

  • Add Devices

  • Device Configuration

  • Device Configuration Group Management

  • Tunnel Group Management

  • Tunnel Provisioning

  • Provisioning Settings

  • Device Configuration and Device Groups

  • Firmware Update

Step 4

After you select one of the Guided Tours, you will be redirected to that configuration page and windows appear to step you through the configuration steps and let you Add or Update Values as necessary.

Note

 
When you select the Zero Touch Provisioning option list in step 3 above, a Zero Touch Provisioning setup guided tour window appears that lists all the prerequisites for the device on-boarding: (Provisioning Settings, Group Management, Manage Configuration: Bootstrap Template, Tunnel Provisioning, Device Configuration, Add Devices).

Using the Dashboard

The IoT FND Dashboard displays dashlets to provide a visual overview of important network metrics for a device. You can select what you want to display.

Figure 1. DASHBOARD

Types of Dashlets

The Dashboard displays three types of dashlets for a selected device:

  • Pie-chart dashlets display a ratio of the device properties as a pie chart.

  • Bar-chart dashlets display device properties.

  • Line-graph dashlets display graphs that show device variances over time.


    Tip


    Graphs set to intervals longer than one day may not display the data at the last datapoint exactly as shown in the matching field on the Device Info page. This is because data aggregation is occurring less frequently than polling done to update the fields on the Device Info page. Set these graphs to the 6h or 1d intervals to update the data more frequently. Use intervals longer than one day to view data trends.


Customize Dashboard Dashlets

At the DASHBOARD page use the three icons (Cog, Pencil, Refresh) in the upper-right hand-corner of the page to customize your Dashlets.

To customize the dashoard dashlets:

Procedure


Step 1

Click the Dashboard Settings Cog icon to Add Dashlets and Set Refresh Interval for all active dashlets.

Step 2

Click the pencil icon to Add or Remove a Filter for a device.

Step 3

Click the Refresh icon to refresh the dashlet.

At individual dashlets you can:

Step 4

Click the dash (-) icon to minimize the dashlet.

Step 5

Click the Refresh icon to refresh the dashlet.

Step 6

Click the (+) icon to export data (.csv format) from the dashlet.

Step 7

Click the filter icon (pencil icon) to: (Options vary by dashlet type):

Define reporting intervals by selecting defined periods such as (6h, 1d, 1w, 4w), Last Billing Period and Current Billing Period, or define your own Custom time period.

Define a Series Selector, which allows you to define different possible states for a chart. For example, the Endpoint Config Group Mismatch Over Time chart has the following Series Selector options: Config Out of Sync and Config in Sync. Clicking the Series Selector option names on the chart can cause the data to display or not display on the chart. When not selected, a name appears in a faded hue on the chart.

Use drop-down menus found in some table headings to display data in an ascending or descending order or display an additional heading option (such as Down Routers Over Time) in the table.

Define the number of entries that display on the chart by selecting a value from the Show drop-down menu.

Display data as either a bar chart or pie chart.

Define a custom line-graph chart. Select the number of devices to chart for line-graph chart displays.

Select a series to refine data in line-graph chart displays.

Filter line-graph chart displays by group.

Add a Filter.

Step 8

Click (X) to close the dashlet.


Pre-defined Dashlets

Dashlet Description

Config Group Template Mismatch

This pie chart shows the number of devices with matched and mismatched configuration group templates. (Chart applies only to mesh endpoint configuration groups).

Devices with interfaces enabled but down

This gauge chart displays the count of devices that have interfaces that are enabled but down and the count of interfaces. To display this dashlet, click add (Operation column) at the Dashboard Settings page, and then define the device type and interface (such as Type:cgr1000, Interface:Async 1/1) and save your entries. Once the dashlet is on the Dashboard, click the needle of the gauge chart to launch the Device Details list page that shows all devices that meet the criteria of having enabled, but down interfaces.

Distribution of modulations across meters

This line graph shows the distribution of modulations across meters. Modulations graphed: 8PSK, QPSK, BPSK, ROBO, OFDM600,OFDM200, FSK150, QPSK12.5.

Distribution of modulations across IR500 Devices

This line graph shows the distribution of modulations across IR500 devices. Modulations graphed: 8PSK, QPSK, BPSK, ROBO, OFDM600,OFDM200, FSK150, QPSK12.5.

Endpoint Config Groups Template Mismatch Over Time

This line graph shows the number of endpoints across all configuration groups and particular configuration groups that are out of sync for the configured time interval.

Endpoint Firmware Group Membership Mismatch Over Time

This line graph shows the number of endpoints across all firmware groups and particular firmware groups that are out of sync for the configured time interval.

Endpoint Inventory

This endpoint status displays the proportion (and count) of endpoints. For example, the count of devices with an Unheard status relative to the other states: Registering, Up, Down, and Outage.

Endpoint States Over Time

This line graph shows a count of endpoints and their states for the configured time interval. States shown: Registering, Down, Outage, Unheard, Up, Restored, Unmanaged.

Firmware Group Membership Mismatch

This pie chart shows the number of devices with mismatched firmware groups (applicable only to endpoint firmware groups).

Gateway Inventory

This pie chart shows the gateway count and its percentage of the whole by the following states: Unheard, Up, Down.

Hop Count Distribution

This pie chart shows the hop count distribution for mesh devices.

Router Inventory

This pie chart shows a router count and its percentage of the whole by the following states: Unheard, Up, Down.

Router States Over Time

This line graph shows the state of all routers over a configured time interval. States supported: Up, Down, Unmanaged, Unsupported and Unheard.

Use the Add Filter button to track:

  • Specific router (Type)

  • Router Configuration Groups

  • Router Firmware Groups

Routers With Top Cellular Bandwidth Usage

This bandwidth chart displays the following information for the top n routers: EID, Interface, Bandwidth Usage and Bandwidth Usage (in Bytes) for a router per the defined filter. The filter defines possible time periods (6h, 1d, 1w, 4w, Custom, Last Billing Period) to display. To define the filter, click the pencil icon.

Note


You must define the Monthly Cellular Billing Period Start Day for the Last Billing Period option at the following page: Admin > System Management > Server Settings > Billing Period Settings .

Routers With Top Ethernet Bandwidth Usage

This bandwidth chart displays the following information for the top n routers: EID, Interface, Bandwidth Usage and Bandwidth in Usage (in Gigabits) for a router per the defined filter. The filter defines possible time periods (6h, 1d, 1w, 4w, Custom, Last Billing Period) to display. To define the filter, click the pencil icon.

Note


You must define the Monthly Ethernet Billing Period Start Day for the Last Billing Period option at the following page: Admin > System Management > Server Settings > Billing Period Settings .

Routers With Least Cellular RSSI

This Cellular RSSI chart displays the following information for the top n routers: EID, Interface, Cellular RSSI and Cellular RSSI (in dBm) for a router.

Service Providers with Maximum Down Routers for Cellular 1

This dashlet shows the service provider names, their associated cell IDs (if available), their associated total router count, the count of down routers, and a sparkline showing the down routers over time (when you select the option per Tip noted below).

This dashlet displays the aggregated maximum Down Routers for device types CGR1000 and IR800 for single modem routers.

Tip


Move your cursor over any column heading to display the Down Routers Over Time listings in either ascending or descending order.

Service Providers with Maximum Down Routers for Cellular 2

This dashlet shows the service provider names, their associated cell IDs (if available), their associated total router count, the count of down routers, and a sparkline showing the down routers over time (when you select the option per Tip noted below).

This dashlet displays the aggregated maximum Down Routers for device types CGR1000 and IR800 for dual modem routers.

Tip


Move your cursor over any column heading to display listings in either ascending or descending order or to display the Down Routers Over Time column.

Repositioning Dashlets

You can configure the Dashboard to display charts in your preferred arrangement.

Procedure


Step 1

Click and drag the title bar of a chart to the desired position.

Step 2

Click (x) within a chart to remove the chart from the page.

Step 3

Collapse a dashlet to display only its title bar (such as Endpoint Inventory) by clicking the Minimize button (-).

Step 4

To refresh a dashlet, click the Refresh button.


Setting the Dashlet Refresh Interval

To set the refresh interval for dashlets:

Procedure


Step 1

Choose DASHBOARD menu.

Step 2

Click the Dashboard Settings button (cog icon) in the upper-right corner of the page under the root <user> icon.

The Dashboard Settings panel appears.

Step 3

From the drop-down menu, choose a refresh interval.

Step 4

Close the Dashboard Settings dialog box when finished.


Adding Dashlets

To add dashlets to the Dashboard:

Procedure


Step 1

Choose DASHBOARD menu.

Step 2

Click the Settings button (cog icon) in the upper-right hand corner of the page.

Step 3

Click Add Dashlets (+).

Note

 
No dashlets display in this dialog box if all are displaying on the Dashboard.

Step 4

To add a listed dashlet to the Dashboard, select the name of dashlet.

Step 5

Close the Dashboard Settings dialog box by clicking (x) in upper-right corner of panel when finished.

Table 1. Router Metrics
Field Name Key Description

Bandwidth Usage

cellularBandwidth

The total accumulated amount of bytes sent and received over the cellular uplink backhaul.

Battery 0 Level

battery0Level

The percentage of charge remaining in battery 0.

Battery 0 Remaining Time

battery0Runtime

The runtime remaining on battery 0.

Battery 1 Level

battery1Level

The percentage of charge remaining in battery 1.

Battery 1 Remaining Time

battery1Runtime

The runtime remaining on battery 1.

Battery 2 Level

battery2Level

The percentage of charge remaining in battery 2.

Battery 2 Remaining Time

battery2Runtime

The runtime remaining on battery 2.

C1222 Multicast Incoming Traffic

c1222McastInTraffic

C1222 multicast receive traffic on the WPAN interface.

C1222 Multicast Outgoing Traffic

c1222McastOutTraffic

C1222 multicast transmit traffic on the WPAN interface.

C1222 Multicast Traffic

c1222McastTraffic

C1222 multicast traffic on the WPAN interface.

C1222 Total Incoming Traffic

c1222InTraffic

Total C1222 receive traffic on the WPAN interface.

C1222 Total Outgoing Traffic

c1222OutTraffic

Total C1222 transmit traffic on the WPAN interface.

C1222 Total Traffic

c1222Traffic

Total C1222 traffic on the WPAN interface.

C1222 Unicast Incoming Traffic

c1222UcastInTraffic

C1222 unicast receive traffic on the WPAN interface.

C1222 Unicast Outgoing Traffic

c1222UcastOutTraffic

C1222 unicast transmit traffic on the WPAN interface.

C1222 Unicast Traffic

c1222UcastTraffic

C1222 unicast traffic on the WPAN interface.

Cellular Module Temperature

cellModuleTemp

The internal temperature of 3G module.

Chassis Temperature

chassisTemp

The internal temperature of the device.

CINR

wimaxCinr

The measured CINR value of the WiMAX RF uplink.

CSMP Incoming Traffic

csmpInTraffic

CSMP receive traffic on the WPAN interface.

CSMP Multicast Incoming Traffic

csmpMcastInTraffic

CSMP multicast receive traffic on the WPAN interface.

CSMP Multicast Outgoing Traffic

csmpMcastOutTraffic

CSMP multicast transmit traffic on the WPAN interface.

CSMP Multicast Traffic

csmpMcastTraffic

CSMP multicast traffic on the WPAN interface.

CSMP Outgoing Traffic

csmpOutTraffic

CSMP transmit traffic on the WPAN interface.

CSMP Traffic

csmpTraffic

Total CSMP traffic on the WPAN interface.

CSMP Unicast Incoming Traffic

csmpUcastInTraffic

CSMP unicast receive traffic on the WPAN interface.

CSMP Unicast Outgoing Traffic

csmpUcastOutTraffic

CSMP unicast transmit traffic on the WPAN interface.

CSMP Unicast Traffic

csmpUcastTraffic

Total CSMP unicast traffic on the WPAN interface.

Current Call Duration

cellConnectTime

The amount of time the current call lasted; applicable to CDMA only.

DHCP Incoming Traffic

dhcpInTraffic

DHCP receive traffic on the WPAN interface.

DHCP Outgoing Traffic

dhcpOutTraffic

DHCP transmit traffic on the WPAN interface.

DHCP Traffic

dhcpTraffic

Total DHCP traffic on the WPAN interface.

Dot 1x Traffic

dot1xTraffic

Total Dot 1x traffic on the WPAN interface.

Dot1x Incoming Traffic

dot1xInTraffic

Dot1x receive traffic on the WPAN interface.

Dot1x Outgoing Traffic

dot1xOutTraffic

Dot1x transmit traffic on the WPAN interface.

ECIO

cellularEcio

The signal strength of CDMA at individual sector level.

ICMP Incoming Traffic

icmpInTraffic

ICMP receive traffic on the WPAN interface.

ICMP Outgoing Traffic

icmpOutTraffic

ICMP transmit traffic on the WPAN interface.

Lowpan Incoming Traffic

lowpanInTraffic

Lo WPAN receive traffic on the WPAN interface.

Lowpan Outgoing Traffic

lowpanOutTraffic

Lo WPAN transmit traffic on the WPAN interface.

Mcast Incoming Traffic

mcastInTraffic

Multicast receive traffic on the WPAN interface.

Mcast Outgoing Traffic

mcastOutTraffic

Multicast transmit traffic on the WPAN interface.

Mesh Endpoint Count

meshEndpointCount

Number of active connected mesh endpoints.

ND NS Incoming Traffic

ndnsInTraffic

ND NS receive traffic on the WPAN interface.

Outage Incoming Traffic

outageInTraffic

Outage on receive traffic on the WPAN interface.

Overall Battery Remaining Time

batteryRuntime

Battery runtime remaining (all batteries).

Raw Socket Rx S1

rawSocketRxSpeedS1

Raw socket receive data rate for serial interface 1.

Raw Socket Rx S2

rawSocketRxSpeedS2

Raw socket receive data rate for serial interface 2.

Raw Socket Rx(Frames) S1

rawSocketRxFramesS1

Raw socket receive data rate, in frames, for serial interface 1.

Raw Socket Rx(Frames) S2

rawSocketRxFramesS2

Raw socket receive data rate, in frames, for serial interface 2.

Raw Socket Tx S1

rawSocketTxSpeedS1

Raw socket transmit data rate for serial interface 1.

Raw Socket Tx S2

rawSocketTxSpeedS2

Raw socket transmit data rate for serial interface 2.

Raw Socket Tx(Frames) S1

rawSocketTxFramesS1

Raw socket transmission data rate, in frames, for serial interface 1.

Raw Socket Tx(Frames) S2

rawSocketTxFramesS2

Raw socket transmission data rate, in frames, for serial interface 2.

Receive Packet Reassembly Drops

meshRxReassemblyDrops

The rate of receive packet fragments dropped because of no space in the reassembly buffer.

Receive Speed

ethernetRxSpeed

The rate of data received by the Ethernet uplink network interface, in bits per second, averaged over a short element-specific time period (for example, an hour).

Receive Speed

wimaxRxSpeed

The rate of data received by the WiMAX uplink network interface, in bits per second, averaged over a short element-specific time period (for example, one hour).

Receive Speed

cellularRxSpeed

The rate of data received by the cellular uplink network interface, in bits per second, averaged over a short element-specific time period (for example, one hour).

Receive Speed

meshRxSpeed

The rate of data received by the uplink network interface, in bits per second, averaged over a short element-specific time period (for example, one hour).

Remaining ICMP Incoming Traffic

remainIcmpInTraffic

Remaining ICMP receive traffic on the WPAN interface.

Remaining ICMP Outgoing Traffic

remainIcmpOutTraffic

Remaining ICMP transmit traffic on the WPAN interface.

Remaining ICMP Traffic

remainIcmpTraffic

Total remaining ICMP traffic on the WPAN interface.

Remaining IP Incoming Traffic

remainIpInTraffic

Remaining IP receive traffic on the WPAN interface.

Remaining IP Outgoing Traffic

remainIpOutTraffic

Remaining IP transmit traffic on the WPAN interface.

Remaining IP Traffic

remainIpTraffic

Total remaining IP traffic on the WPAN interface.

RPL DAO Incoming Traffic

rplDaoInTraffic

DAO receive traffic on the WPAN interface.

RPL DIO Incoming Traffic

rplDioInTraffic

DIO receive traffic on the WPAN interface.

RPL Incoming Traffic

rplInTraffic

RPL receive traffic on the WPAN interface.

RPL RA Outgoing Traffic

rplRaOutTraffic

RA transmit traffic on the WPAN interface.

RPL Source Route Table Entries

meshRoutes

The number of entries a given router has in its source-route table. This provides a way to measure the number of elements in the PAN.

RPL Total Traffic

rplTraffic

Total RPL traffic on the WPAN interface.

RSSI

cellularRssi

The measured RSSI value of the cellular RF uplink.

RSSI

wimaxRssi

The measured RSSI value of the WiMAX RF uplink.

Total Incoming Traffic

totalInTraffic

Total receive traffic on the WPAN interface.

Total Outgoing Traffic

totalOutTraffic

Total transmit traffic on the WPAN interface.

Transmit Packet Drops

ethernetTxDrops

The rate of packets dropped because the outbound queue was full while trying to transmit on the Ethernet uplink interface.

Transmit Packet Drops

meshTxDrops

The rate of packets dropped because the outbound queue was full while trying to transmit on the mesh uplink interface.

Transmit Speed

ethernetTxSpeed

The current speed of data transmission over the Ethernet uplink network interface, in bits per second, averaged over a short element-specific time period (for example, one hour).

Transmit Speed

cellularTxSpeed

The current speed of data transmission over the cellular uplink network interface, in bits per second, averaged over a short element-specific time period (for example, one hour).

Transmit Speed

wimaxTxSpeed

The current speed of data transmission over the WiMAX uplink network interface, in bits per second, averaged over a short element-specific time period (for example, one hour).

Transmit Speed

meshTxSpeed

The current speed of data transmission over the uplink network interface, in bits per second, averaged over a short element-specific time period (for example, one hour).

Ucast Incoming Traffic

ucastInTraffic

Unicast receive traffic on the WPAN interface.

Ucast Outgoing Traffic

ucastOutTraffic

Unicast transmit traffic on the WPAN interface.

Uptime

uptime

The amount of time, in seconds, that the device has been running since last boot

Utilization Bytes (slots 1–8)

ethernetUtilBytes[slot number]

The data, in bytes, transmitted and received by the Ethernet on the uplink or downlink network interface at slot x.

Utilization Bytes (slot 9-11)

ethernetUtilBytes[9-11]

(Cisco IOS CGRs running GOS only) The data, in bytes, transmitted and received by the Ethernet on the uplink or downlink network interface at module/slot 0/0, 0/1, or 0/2, respectively.

Table 2. Router Properties
Field Name Key Description

Battery 0 State

battery0State

The state of battery 0 charge (combined attribute).

Battery 1 State

battery1State

The state of battery 1 charge (combined attribute).

Battery 2 State

battery2State

The state of battery 2 charge (combined attribute).

Cellular Roaming Status

cellRoamingStatus

The roaming status of the cellular module on the CGR.

Network Name

cellularNetworkName

The network that the cellular device is associated with.

Module Status

cellularStatus

The status and state of the cellular module.

Cellular Network Type

cellularType

The cellular network type (CDMA or GSM).

Door Status

doorStatus

The device door status (Open or Closed).

Power Source

powerSource

The device current power source.

Link State

wimaxLinkState

The device WiMAX link state.


Removing Dashlets

To remove dashlets from the Dashboard:

Procedure


Step 1

Choose DASHBOARD menu.

Step 2

Close the dashlet by clicking (X) in the upper-right corner of the panel.


Using Pie Charts to Get More Information

Roll over any segment of a pie chart to display a callout with information on that segment.

Click the Router Inventory and Mesh Endpoint Inventory pie charts to display the devices in List View.

Setting Time Filters To View Charts

Use the Filter option to view charts for default or custom-defined time intervals. The chart provides statistical information on devices (such as device information, events, or issues) and FND servers.
  • Default time intervals: The options available are 6h (6 hours), 1d (one day), 1w (one week), or 4w (four weeks). For example, 6h collects the device data for the last 6 hours and 1d collects the device data for the last 24 hours.


    Note


    You can hover over the chart to view the tooltip information. The tooltip appears by default in the charts for small data and displays information in the combination of data values, text, and/or tokens. For charts with a huge dataset, the tooltip doesn't appear by default. You have to select and expand the specific portion of the chart for which you need the information and then hover over to see the tooltip.


    Note


    You see only aggregated data for 1w, 4w, and Custom charts and not real-time data, to avoid performance impact on Cisco IoT FND. The processing of a huge amount of data and displaying them in real-time slows down Cisco IoT FND.


  • Custom: This option allows you to customize the time frame for collecting the device data. The chart in the dashlets provides the device data specific to the time frame set by you.


    Note


    In some cases, the date and time displayed in the chart varies from the time frame customized by you. This time discrepancy is due to the time difference in the respective location of the Cisco IoT FND server and the Cisco IoT FND client. To rectify this time difference, you have to set the time zone in the Cisco IoT FND to your current location, using User > Time Zone (right top corner in the user interface).

To set time filters to view charts:

Procedure


Step 1

Click Filter (pencil icon) in the right corner of the dashlet.

Step 2

Click the Custom button.

Step 3

In the Enter Custom Time window, select the time frame from the From and To fields.

Step 4

Click OK.

Note


The From and To fields are only enabled when the time range is set to Custom.


Collapsing Dashlets

To collapse the dashlets:

Procedure


Step 1

Choose DASHBOARD menu.

Step 2

Click the minimize icon (-) at the upper-right of the dashlet window to hide the window.


Using the Series Selector

You use the Series Selector to refine line-graphs to display by device status. The device options are:

  • Routers: Down, Outage, Unsupported, Unheard, and Up

  • Mesh Endpoint Config Group: Config Out of Sync and Config In Sync

  • Mesh Endpoint Firmware Group: Membership Out of Sync and Membership In Sync

  • Mesh Endpoint States: Down, Outage, Unheard, and Up

To use the Series Selector:

Procedure


Step 1

Click Series Selector.

Step 2

In the Series Selector dialog box, check the check boxes for the data series to show in the graph.

Step 3

Click Close.


Using Filters

You use filters to refine the displayed line-graph data by groups. Applied filters display after the dashlet title.

To use the filters:

Procedure


Step 1

Click the interval icon (pencil) in the upper-right corner of the panel to display the 2 filtering parameters on the chart: a time frame (such as 6h) and components (such as Endpoint Configuration Groups, Mesh Endpoints (MEs).

Step 2

Click a time frame.

Step 3

From the first drop-down menu, choose a group type.

Figure 2. Endpoint Firmware Group Membership Mismatch Over Time

Step 4

From the first drop-down menu, choose a group type.

Step 5

From the third drop-down menu, choose a group.

Step 6

Click Apply.

The pencil icon is green and the filter displays next to the dashlet name to indicate that a filter is applied.

Note


Click the Remove Filter button to remove the filter and close the filter options.


Exporting Dashlet Data

You can export dashlet data to a CSV file.

To export dashlet data:

Procedure


Step 1

On the desired dashlet, click the export button (+).

A browser download session begins.

Step 2

Navigate to your default download directory to view the export file.

Note

 
The filename begins with the word “export-” and includes the dashlet name (for example, export-Node_State_Over_Time_chart-1392746225010.csv).

Monitoring Events

This section provides an overview of events and how to search and sort events.

Set Time Range and Page View Preferences for Operations > Events

In the Events tab of a device, you can define the following information:

  • Relative time periods: ‘Last 24 hours’, ‘Last 15 Minutes’, ‘Last 4 hours’, ‘Last 7 days’, ‘Last 30 days’ and ‘All Time’ from the drop-down menu at the left-hand side of the page

  • Absolute time periods reference a specific day such as Sunday, April 25, Saturday, April 24, Friday, April 24

You can also select the number of events to display on a page (such as ‘10’, ‘50’, ‘100’, and ‘200’) by selecting that value from the drop-down menu at the far-right side of the page.

Figure 3. Set Time Range and Page View Preferences for Events for a Specific Period of Time for an Endpoint

Viewing Events

As shown in Operation > Events page, the Events page lists all events for those devices that IoT FND tracks. All events are stored in the IoT FND database server.

By default, the Operations > Events page displays the Events chart of which is a visual view of events in a time line.

From this page, you can also view the device information by clicking on one of the devices listed under router or endpoint on the left pane. The Device Info tab displays detailed information of the selected device along with the events chart. You can view the events chart of the device for default or custom-defined time intervals. For more information on viewing the chart for default or custom-defined time intervals, refer to Setting Time Filters To View Charts.

However, depending on the number of devices the IoT FND server manages, this page can sometimes time out, especially when the system is fully loaded. In that case, open the Preferences window by choosing username > Preferences (top right), and uncheck the check boxes for options, ‘Show chart on events page’ and ‘Show summary counts on the events/issues page’, and then click Apply.

Procedure


Step 1

To limit the amount of event data displayed on this page, use the Filter drop-down menu (at the top of the left pane).

Note


For example, you can show the events for the last 24 hours relative to the last 30 days, or events for a specific day within the last seven days.

Step 2

To enable automatic refresh of event data to refresh every 14 seconds, check the checkbox next to the Refresh button. To immediately refresh event data click the Refresh button or the refresh icon.

Note


The amount of event data displayed on the Events page is limited by the data retention setting for events at. ADMIN > System Management > Data Retention.


All Events Pane Filters

Use the preset filters in the All Events pane to only view those event types.

Device Events

In the left pane, IoT FND tracks events for the following devices:

  • Routers

  • Endpoints

  • Head-end Devices

  • CR Mesh Devices

  • NMS Servers

  • Database Servers

Event Severity Level

In the left pane, select an event severity level to filter the list view to devices with that severity level:

  • Critical

  • Major

  • Minor

  • Info

Each event type has a preset severity level. For example, a Router Down event is a Major severity level event.

Filtering by Severity Level

To filter by severity level, click the pencil icon:

Procedure

Step 1

Choose OPERATIONS > Events

Step 2

Click the SEVERITY show/hide arrow (left-pane).

Note

 
Only those severity levels (CRITICAL, MAJOR, MINOR, or INFO) that have occurred display in the left pane under the SEVERITY heading.

Step 3

Click a severity level to display all events of that severity level in the Events pane (right-pane).


Preset Events By Device

IoT FND has a preset list of events it reports for each device it tracks. A list of those events is summarized under each device in the left pane on the Events page. For example, in the left pane click the show/hide icon ( 
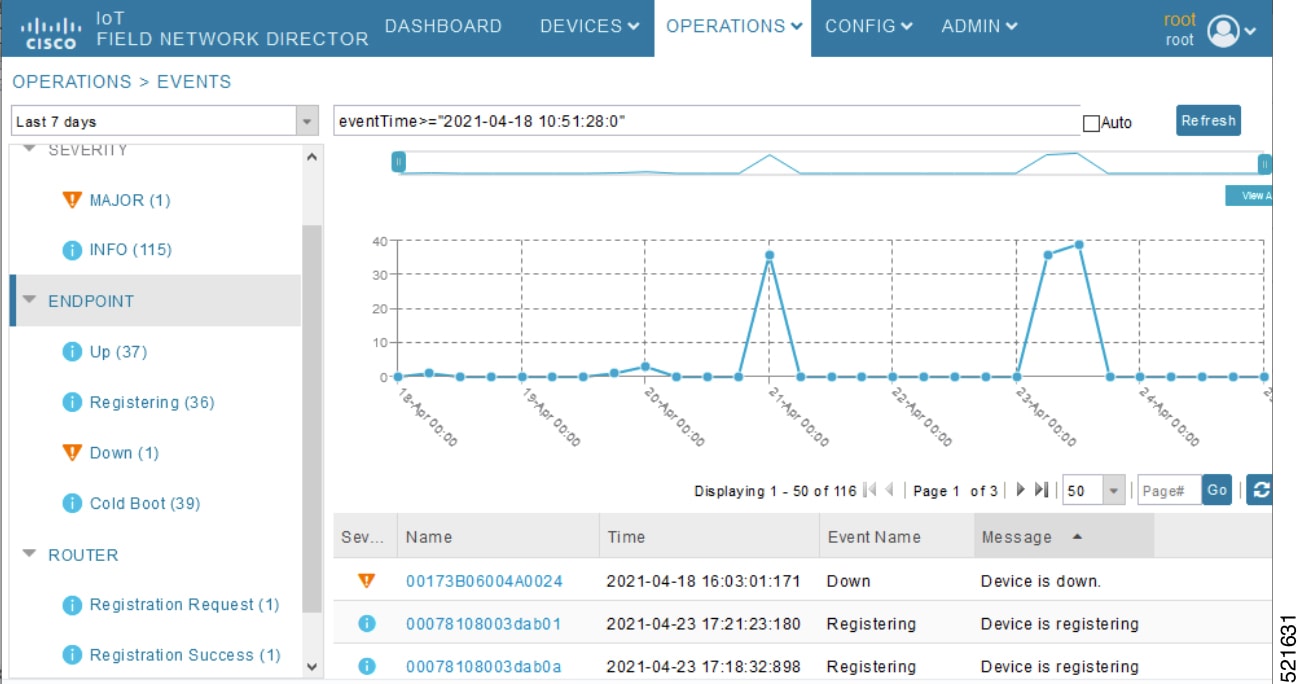
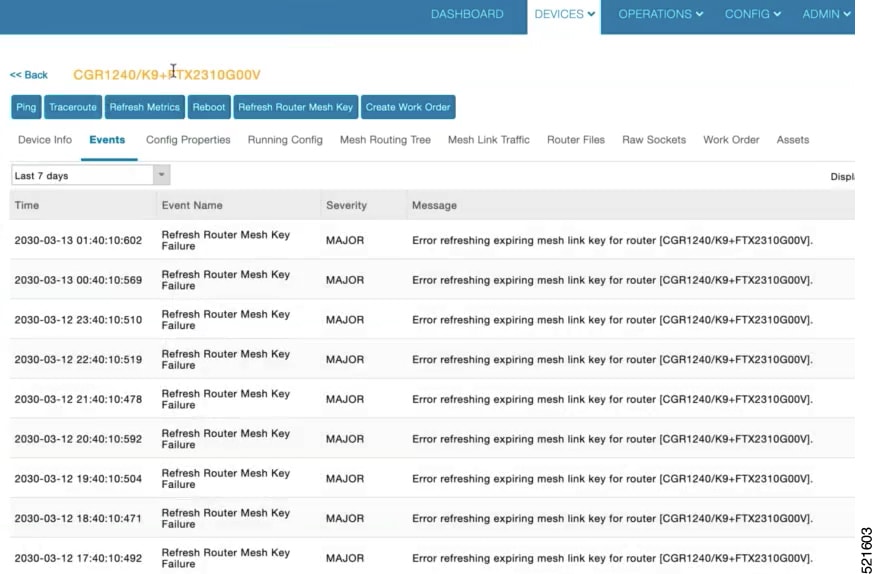
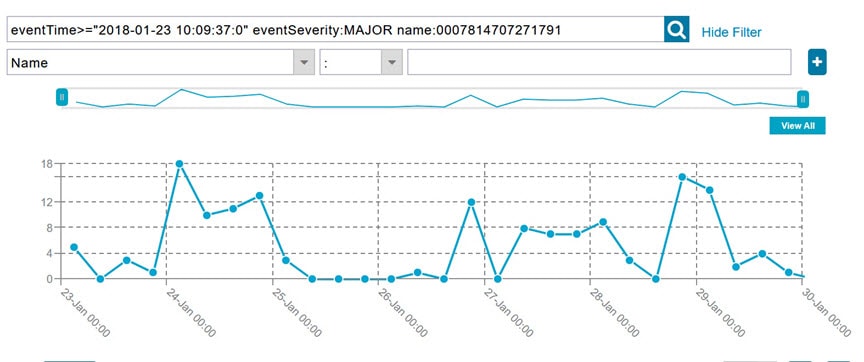
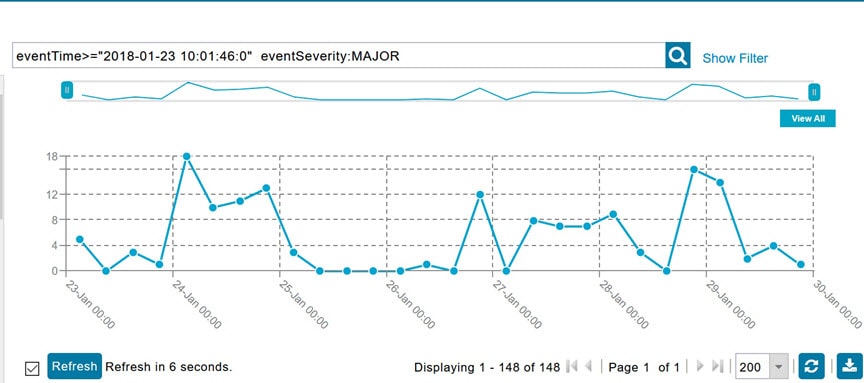
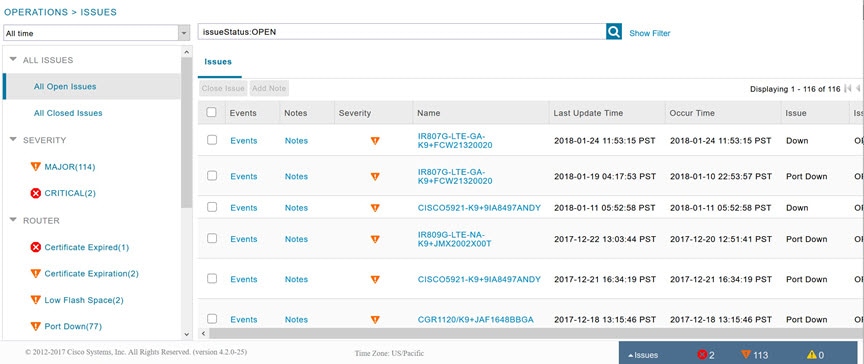
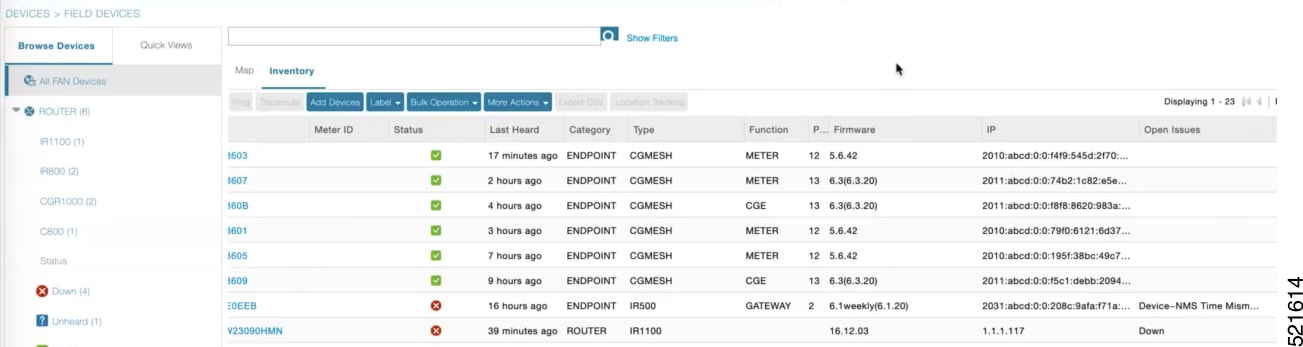
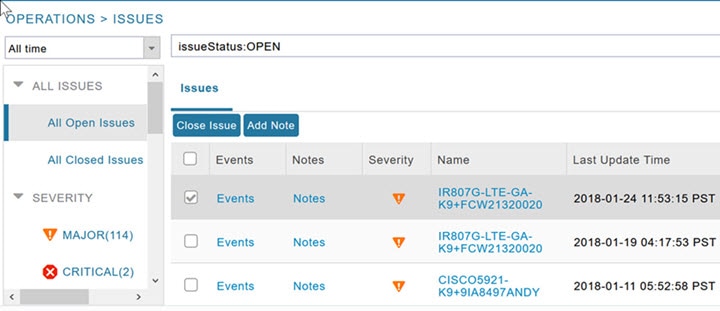
) next to Routers to expand the list of all events for routers.

Advanced Event Search

To use the filter to search for events:

Procedure


Step 1

Choose OPERATIONS > Events.

Figure 4. Searching for CGR1240 Events for the Past 7 Days

Step 2

Above the All Events heading (left pane), select a Relative (such as 7 days, 24 hours, 15 minutes) or Absolute (Day of the Week such as March 12) search time frame and an event category [SEVERITY | ROUTER or ENDPOINT} from the drop-down menu to narrow down your search. For example, you can select a SEVERITY option of MAJOR, MINOR or INFO and information for the chosen severity will display for all systems being managed by FND.

Step 3

Click the Show Filter link at the top of the main pane.

Step 4

Use the filter drop-down menus and fields to specify your search criteria.

Step 5

Click the plus button (+) to add the search strings to the Search field.

Repeat the process of adding search strings to the Search field as needed.

Step 6

Click Search Events or press Enter.

The search results display in the Events pane.

You can also add search strings manually, as shown in the following examples:

  • To filter events by Name (EID), enter the following string in the Search Events field:

    • name: router eid string

    • Search Events by Name Filter

    Note

     
    Note the use of the asterisk (*) wild card with this filter.
  • To filter by event time period, enter the following string in the Search Events field, as shown in graph below:

    • eventTime operator“YYYY-MM-DD HH:MM:SS:SSS”

    • Supported operators are: <, >, >=, <=, :

      Note

       
      Do not enter a space between eventTime and the operator.

Sorting Events

To sort events in ascending or descending order, roll over any column and select the appropriate option from the heading drop-down menu.

Searching By Event Name

To search by event name (for example, Battery Low):

Procedure


Step 1

Choose OPERATIONS > Events.

Step 2

In the left pane, click the device type.

Step 3

Click the Show Filter link at the top of the right pane to display the search fields.

Step 4

Choose Event Name from the left drop-down menu.

Step 5

Choose the event name from the options in the right drop-down menu.

Step 6

Click the plus button (+) at the right to add the filter to the Search Events field.

The filter syntax appears in the Search Events field.

Step 7

Click the Search Events button (magnifying glass icon).

The search results display in the Events pane.


Searching by Labels

Allows you to search and filter events based on Label names tagged to Field Devices.

To search by labels:

Procedure


Step 1

Choose OPERATIONS > Events.

Step 2

Click All Events in the left pane.

Step 3

Click the Show Filter link at the top of the right pane.

Step 4

Choose Label from the left drop-down menu.

Step 5

Choose the event name from the options in the right drop-down menu or create your own.

Step 6

Click the plus button (+) at the right to add the filter to the Search Events field.

The filter syntax appears in the Search Events field.

Step 7

Click the Search Events button (magnifying glass icon).

The search results display in the Events pane.


Exporting Events

You can export events to a CSV file to examine as a log of event severity, time, name and event description by device.

To export events:

Procedure


Step 1

Choose OPERATIONS > Events.

Step 2

Click the desired severity level or device type in the left pane.

Step 3

Click the Export (+) button .

A browser download session begins.

Step 4

Navigate to your default download directory to access the CSV file.


Events Reported

The table lists the events reported by IoT FND. Details include the event severity (Critical, Major, Minor, Information) and the devices that report those events.

Table 3. Events Reported
Events Devices Severity

CRITICAL EVENTS

Certificate Expired

AP800, CGR1000, FND, IR800

Critical

DB FRA Space Critically Low

Database

Critical

DB Table Space Critically Low

Database

Critical

Invalid CSMP Signature

CGMESH, IR500

Critical

Outage

Cellular, CGMESH, IR500

Critical

RPL Tree Size Critical

CGR1000

Critical

SD Card Removal Alarm

CGR1000

Critical

MAJOR EVENTS

AAA Failure

CGR1000, IR800

Major

ACT2L Failure

CGR1000, IR800

Major

Archive Log Mode Disabled

Database

Major

Battery Failure

CGR1000

Major

Battery Low

CGR1000, IR500

Major

BBU Configuration Failed

IR500

Major

BBU Firmware Download Failed

IR500

Major

BBU Firmware Mismatch Found

CGR1000

Major

BBU Firmware Upgrade Failed

IR500

Major

BBU Lock Out

IR500

Major

BBU Power Off

IR500

Major

Block Mesh Device Operation Failed

CGR1000

Major

Certificate Expiration

AP800, CGR1000, FND, IR800

Major

DB FRA Space Very Low

Database

Major

Default Route Lost

CGMESH, IR500

Major

Device Unknown

FND

Major

Door Open

CGR1000, IR800, LORA

Major

Dot1X Authentication Failure

CGR1000

Major

Dot1X Authentication Flood

CGR1000, IR800

Major

Down

AP800, ASR, C8000, Cellular, CGMESH, CGR1000, Database, FND, IR500, IR800, ISR3900, LORA

Major

Element Configuration Failed

CGR1000, IR800

Major

High CPU Usage

LORA

Major

High Flash Usage

LORA

Major

High Temperature

LORA

Major

HSM Down

FND

Major

Interface Down

ASR, C8000, ISR3900

Major

Linecard Failure

CGR1000, IR800

Major

Line Power Failure

CGR1000, IR800

Major

Link Down

IR500

Major

Low Flash Space

CGR1000, IR800

Major

Low Memory/Memory Low

CGR1000, FND, IR800, LORA ( Memory Low)

Major

Low Temperature

LORA

Major

Mesh Connectivity Lost/ Node Connectivity Lost

CGMESH, IR500

Major

Mesh Link Key Timeout/ Node Link Key Timeout

CGMESH, IR500

Major

Metric Retrieval Failure

ASR, C8000, CGR1000, IR800, ISR3900

Major

Modem Temperature Cold Alarm

CGR1000, IR800

Major

Modem Temperature Warm Alarm

CGR1000, IR800

Major

Node Connectivity Lost

CGMESH, IR500

Major

Node Link Key Timeout

CGMESH, IR500

Major

Packet Forwarder Usage High

LORA

Major

Port Down

AP800, CGR1000, IR800

Major

Port Failure

AP800, CGR1000, IR800

Major

Refresh Router Mesh Key Failure

CGR1000, IR8100

Major

RPL Tree Size Warning

CGR1000

Major

Software Crash

CGR1000, IR800

Major

SSM Down

FND

Major

System Software Inconsistent

CGR1000, IR800

Major

Temperature Major Alarm

CGR1000, IR800

Major

Time Mismatch

CGMESH, IR500

Major

Tunnel Down

CGR1000, IR800

Major

Tunnel Provisioning Failure

CGR1000, IR800

Major

Unknown WPAN Change

CGMESH, IR500

Major

MINOR EVENTS

DB FRA Space Low

Database

Minor

Dot1X Re-authentication

CGMESH, IR500

Minor

Temperature Minor Alarm

CGR1000, IR800

Minor

Temperature Low Minor Alarm

CGR1000, IR800

Minor

RPL Tree Reset

CGR1000

Minor

INFORMATION EVENTS

Archive Log Mode Enabled

Database

Information

Battery Normal

CGR1000

Information

Battery Power

CGR1000

Information

BBU Firmware Download Passed

CGR1000

Information

Certificate Expiration Recovery

AP800, CGR1000, FND, IR800

Information

Cold Boot

AP800, CGMESH, CGR1000, IR500, IR800

Information

Configuration is Pushed

FND

Information

Configuration Rollback

AP800, CGR1000, IR800

Information

DB FRA Space Normal

Database

Information

DB Table Space Normal

Database

Information

Device Added

Cellular, CGMESH, CGR1000, IR500, IR800

Information

Device Location Changed

CGR1000, IR800

Information

Device Removed

Cellular, CGMESH, CGR1000, IR500, IR800

Information

Door Close

CGR1000, IR800, LORA

Information

Dot11 Deauthenticate Send

CGR1000, IR800

Information

Dot11 Disassociate Send

CGR1000, IR800

Information

Dot11 Authentication Failed

CGR1000, IR800

Information

Hardware Insertion

CGR1000, IR800

Information

Hardware Removal

CGR1000, IR800

Information

High CPU Usage Recovery

LORA

Information

High Flash Usage Recovery

LORA

Information

High Temperature Recovery

LORA

Information

HSM Up

FND

Information

Interface Up

ASR, C8000, ISR3900

Information

Line Power

CGR1000, IR800

Information

Line Power Restored

CGR1000, IR800

Information

Link Up

IR500

Information

Low Flash Space OK

CGR1000, IR800

Information

Low Memory OK/Low Memory Recovery

CGR1000, IR800, LORA (Low Memory Recovery)

Information

Manual Close

ASR, C8000, Cellular, CGMESH, CGR1000, IR500, IR800, ISR3900

Information

Major RPL Tree Size Warning OK

CGR1000

Information

Manual NMS Address Change

CGMESH, IR500

Information

Manual Re-Registration

CGMESH, IR500

Information

Mesh Certificate Change/ Node Certificate Change

CGMESH, IR500

Information

Mesh Module Firmware Upgrade has been successful

CGR1000

Information

Migrated To Better PAN

CGMESH, IR500

Information

Modem Status Changed

LORA

Information

Modem Temperature Cold Alarm Recovery

CGR1000, IR800

Information

Modem Temperature Warm Alarm Recovery

CGR1000, IR800

Information

NMS Address Change

CGMESH, IR500

Information

NMS Returned Error

CGMESH, IR500

Information

Node Certificate Change

CGMESH, IR500

Information

Packet Forwarded High Usage Recovery

LORA

Information

Packet Forwarder Status

LORA

Information

Packet Forwarded High Usage Recovery

LORA

Information

Port Up

AP800, CGR1000, IR800

Information

Power Source OK

CGR1000, IR800

Information

Power Source Warning

CGR1000, IR800

Information

Registered

ASR, C8000, ISR3900

Information

Registration Failure

AP800, Cellular, CGR1000, IR800, LORA

Information

Registration Request

AP800, CGR1000, IR800, LORA

Information

Registration Success

AP800, Cellular, CGR1000, IR800, LORA

Information

Rejoined With New IP Address

CGMESH, IR500

Information

Restoration

Cellular, CGMESH, IR500

Information

Restoration Registration

CGMESH, IR500

Information

RPL Tree Size Critical OK

CGR1000

Information

Rule Event

ASR, C8000, CGMESH, CGR1000, Database, FND, IR500, IR800, ISR3900

Information

SSM Up

FND

Information

Temperature Low Recovery

LORA

Information

Temperature Low Minor Alarm Recovery

CGR1000, IR800

Information

Temperature Major Recovery

CGR1000, IR800

Information

Temperature Low Major Alarm Recovery

CGR1000, IR800

Information

Temperature Minor Recovery

CGR1000, IR800

Information

Time Mismatch Resolved

CGMESH, IR500

Information

Tunnel Provisioning Request

CGR1000, IR800

Information

Tunnel Provisioning Success

CGR1000, IR800

Information

Tunnel Up

CGR1000, IR800

Information

Unknown Event

AP800, ASR, C8000,Cellular, CGMESH, CGR1000, Database, FND, IR500, IR800, ISR3900, LORA

Information

Unknown Registration Reason

CGMESH, IR500

Information

Unsupported

AP800, CGR1000, IR800, LORA

Information

Up

AP800, ASR, C8000,Cellular, CGMESH, CGR1000, Database, FND, IR500, IR800, ISR3900, LORA,

Information

Warm Start

IR500

Information

WPAN Watchdog Reload

CGR1000

Information

Monitoring Issues

This section provides an overview of issues and how to search for and close issues in IoT FND.

Viewing Issues

IoT FND offers different ways to monitor issues:

The OPERATIONS > ISSUES page provides a snapshot of the health of the network by highlighting only major and critical issues that are active within the network.

You can also view the device information by clicking on one of the devices listed under router or endpoint on the left pane. The Device Info tab displays detailed information of the selected device along with the issues chart. You can view the issues chart of the device for default or custom-defined time intervals. For more information on viewing the chart for default or custom-defined time intervals, refer to Setting Time Filters To View Charts.

The Issues Status Bar bar displays in the footer of the browser window and shows a count of all issues by severity for selected devices. You can set the device types for issues that display in the Issues status bar in User Preferences.

Figure 5. OPERATIONS ISSUES
Figure 6. Issues Status Bar

The Issues page provides an abbreviated subset of unresolved network events for quick review and resolution by the administrator. Issues remain open until either the associated event is resolved (and IoT FND generates a resolution event) or the administrator manually closes the event.

Only one issue is recorded when multiple entries for the same event are reported. Each issue has a counter associated with it. As an associated event is closed, the counter decrements by one. Every open or closed issue has an associated event.

Click the Issues status bar to view the Issues Summary pane, which displays issues listed by the selected device category. Click count links in the Issues Summary pane to view complete issue criteria filtered by severity on the OPERATIONS > Issues page.


Note


The closed issues data that displays on the Issues page is limited by the Keep Closed Issues for data retention setting (ADMIN > System Management > Data Retention), which is based on the time the issue was closed. When the issue was closed displays as the Last Update Time for the issue.


Displaying Truncated Views of the OPERATIONS > Issues Page

At the DEVICES > FIELD DEVICES > Browse Devices > Inventory page, multiple entries of the same Open Issue (such as Device-NMS Time Mismatch, Down) for a given device will display as one entry only. This reduces multiple entries of the same Open Issue for a Field Device from filling up the display window.

Figure 7. DEVICES > FIELD DEVICES > Browse Devices > Inventory

At the DEVICES > FIELD DEVICES > Browse Devices > Inventory page, you can also minimize the width of the Open Issues column by clicking on the column and dragging the cursor to the left. For more information, refer to the DEVICES > FIELD DEVICES > Browse Devices > Inventory page with Open Issues Column Resized page with open issues column resized. To indicate that the column display has been reduced, the column displays three periods (...). You can later view the expanded view of that content by clicking on the column and expanding the column to the right. If you want to see more details for an Open Issue, you can go to the OPERATIONS > Issues page.

Figure 8. DEVICES > FIELD DEVICES > Browse Devices > Inventory page with Open Issues Column Resized

Viewing Device Severity Status on the Issues Status Bar

A tally of issues listed by severity for the selected devices displays in the Issues status bar in the bottom-right of the browser window frame (Issue Status Bar). You can set the device types for issues that display in the Issues status bar in User Preferences.

Figure 9. Issues Status Bar

To view the device severity status on the issue status bar:

Procedure


Step 1

Click the Issues status bar to view the Issues Summary pane, which displays issues listed by the selected device category.

Step 2

Click the count links in the Issues Summary pane to view complete issue criteria filtered by severity on the OPERATIONS > Issues page.

Figure 10. Issues Summary Pane

Adding Notes to Issues

On the OPERATIONS > Issues page, you can add notes about Issues for a device.

Click the Notes link inline to access any notes entered for the Issue or add a note on the Notes for Issues Name page.

You can edit and delete notes from issues on this page. Issues can have multiple notes. Notes on the Issues Name page display the time the note was created, the name of the user who wrote the note, and the text of the note. You can also add a note when closing an Issue. Notes are purged from the database with the issue.


Note


In some cases, existing notes may exist for the system and the Notes for Issues Name pane displays.

To add a note to an issue:

Procedure


Step 1

Click the Notes link inline or check the check box of the device and click Add Note.

The Notes for Issues Name pane displays.

Step 2

Click Add Note.

The Add Note dialog displays.

Step 3

Insert your cursor in the Note field and type your note.

Step 4

Click Add when finished.

To edit an existing note in an issue:
  1. Click the Notes link inline with the issue.

    The Notes for Issues Name pane displays.

  2. Click the pencil icon at the right of the note that you want to edit.

  3. Edit the note, and click Done when finished.

To delete a note from an issue:
  1. Click the Notes link inline with the issue.

    The Notes for Issues Name pane displays.

  2. Click the red (X) icon at the right of the note.

  3. Click Yes to confirm the deletion.

To add a note when closing an issue:
  1. At the Operations > Issues page, check the box next to the issue you are closing.

  2. Click the Close Issue button that appears above the event listings.

  3. In the Confirm dialog box, insert your cursor in the Note field and type the note text.

  4. To confirm that you want to close the issue and save the note, click Yes.


Searching Issues Using Predefined Filters

To search for open issues for a specific system or severity level:

Procedure


Step 1

Choose OPERATIONS > Issues.

To list only open issues, click All Open Issues (left pane).

Note

 
By default, IoT FND displays all issues that occurred within the specified data retention period (see Configuring Data Retention):
  • To see Closed Issues associated with an event type or severity level, change issueStatus:OPEN to issueStatus:CLOSED in the Search Issues field, and then click Issues Search.

  • To list all closed issues, in the left pane, click All Closed Issues.

Step 2

Click a device category, event type, or severity level to filter the list.

The filter syntax appears in the Search Issues field, and the search results display in the main pane.


Search Issues Using Custom Filters

To search by creating custom filters:

Procedure


Step 1

Choose OPERATIONS > Issues.

Step 2

Click Show Filter.

Step 3

From the Filter drop-down menus, choose the appropriate options.

For example, to filter Severity levels by Name (EID):

  • In the left pane, select a Severity level (such as Major). The filter name populates the first field (top) of the Filter.

  • From the second Filter drop-down menu on the left, choose Name.

  • In the third Filter field, enter the EID of the device to discover issues about.

  • Click the search icon (magnifying glass) to begin the search.

You can also enter the search string in the Search Issues field.

For example: issueSeverity:MAJOR issueStatus:OPEN name:IR807G-LTE-GA-K9+FCW21320020

Step 4

Click Search Issues.

The issues, if any, display in the Search Issues section (right pane).

Step 5

Click the Events link to display events associated with an issue.

The Events for Issue Name pane displays all events for that device.

Step 6

Click Search Issues or any link in the left pane to return to the Issues pane.


Closing an Issue

In most cases, when an event is resolved, the issue is closed automatically by the software. However, when the administrator has actively worked on resolving the issue, it might make sense to close the issue directly. When the issue is closed, IoT FND generates an event.

To close a resolved issue:

Procedure


Step 1

Choose OPERATIONS > Issues.

Step 2

Locate the issue by following the steps in either the Searching Issues Using Predefined Filters or Search Issues Using Custom Filters section.

Step 3

In the Search Issues section (right pane), check the check boxes of the issues to close.

Step 4

Click Close Issue.

Note

 
You can also add a note to the issue at this time.

Step 5

Click Yes.


Viewing Device Charts

This section explains about the router and mesh endpoint charts.

Router Charts

IoT FND provides these charts in the Device Info pane on the Device Details page for any router:

Table 4. Device Detail Charts
Chart Description

Link Traffic

Shows the aggregated WPAN rate for a router over time.

To view the chart for default or custom-defined time intervals, refer to Setting Time Filters To View Charts.

Mesh Endpoint Count

Shows the number of MEs over time.

Cellular Link Metrics

Shows the metrics (transmit and receive speed), RSSI, Bandwidth Usage (current Billing Cycle) for all logical cellular GSM and CDMA interfaces.

Cellular Link Settings

Shows properties for cellular physical interfaces with dual and single modems.

Cellular Link Traffic

Shows the aggregated WPAN rate per protocol over time.

Cellular RSSI

Cellular RSSI.

WiMAX Link Traffic

Shows the receiving and sending rates of the WiMAX link traffic for the router over time.

WiMAX RSSI

Shows the receiving and sending rates of the WiMAX RSSI traffic for the router over time.

Ethernet Link Traffic

Shows the receiving and sending rates of the Ethernet traffic for the router over time.

Cellular Bandwidth Usage Over Time

Shows the bandwidth usage over time for the cellular interface.

Ethernet Bandwidth Usage Over Time

Shows the bandwidth usage over time for the Ethernet interface.

The Router Device Page provides information on the router device.

Figure 11. Router Device Page

Mesh Endpoint Charts

IoT FND provides the device detail charts in the Device Info pane on the Device Details page for any mesh endpoint.

Table 5. Device Detail Charts
Chart Description

Link Traffic

Shows the aggregated WPAN rate for an endpoint over time.

To view the chart for default or custom-defined time intervals, refer to Setting Time Filters To View Charts

Path Cost and Hops

Shows the RPL path cost value between the element and the root of the routing tree over time (see Configuring RPL Tree Polling).

Link Cost

Shows the RPL cost value for the link between the element and its uplink neighbor over time.

RSSI

Shows the measured RSSI value of the primary mesh RF uplink (dBm) over time.

Figure 12. Mesh Endpoint Device Info Page (partial view)
Figure 13. Mesh Endpoint Firmware Group Mismatch Over Time Page