![]()
Monitoring Cisco SD-WAN Services in Cisco MSX
Cisco MSX new GUI includes a Cisco MSX Dashboard and a Tenant Workspace, that are visible only if users have subscribed to the Cisco MSX Enterprise Access (EA) service pack.
This chapter contains the following sections:
Monitoring SD-WAN Service Status on the Cisco MSX GUI
The new GUI has the following workspaces:
-
Operator workspace: Lists all the tenants and the services these tenants have subscribed to. The Operator Workspace has dashlets such as Tenants and Services. The tenant-centric portal is role-based and is accessible by operators.
Figure 1. Operator Workspace 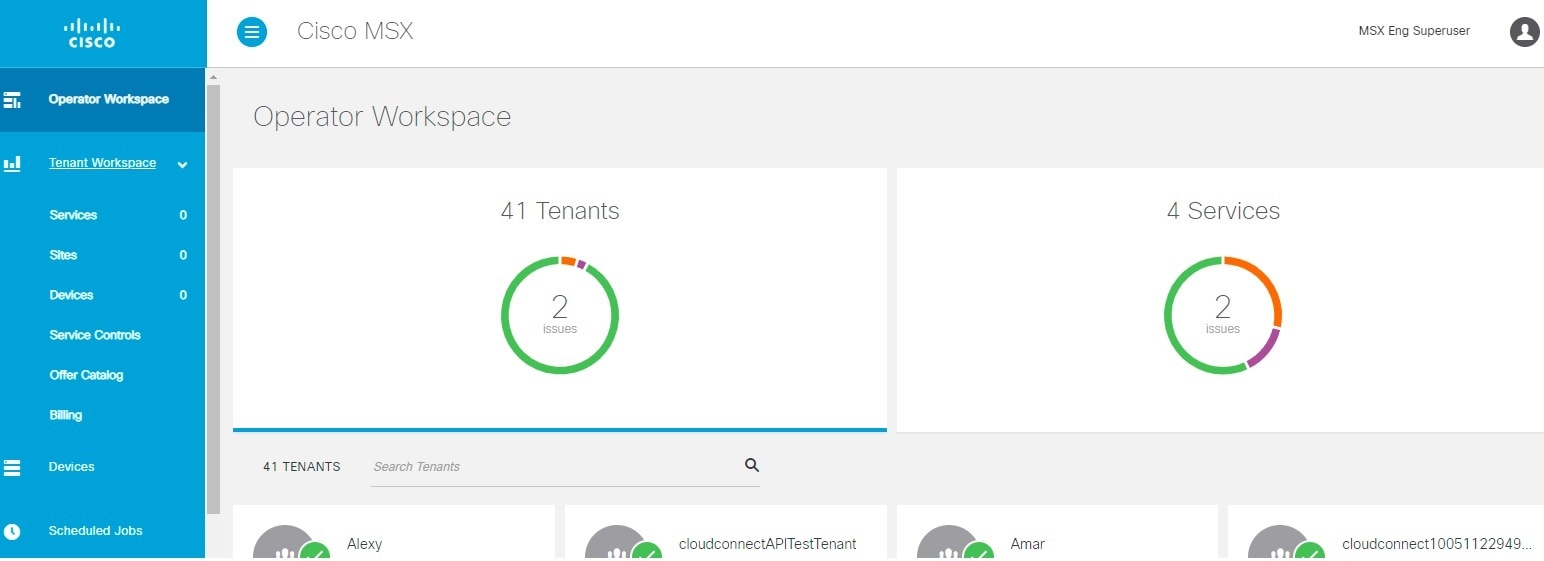
-
Tenant Workspace: Allows tenants to access information related to their subscribed services. The following are the menus that are available in the tenant workspace:
Figure 2. Tenant Workspace 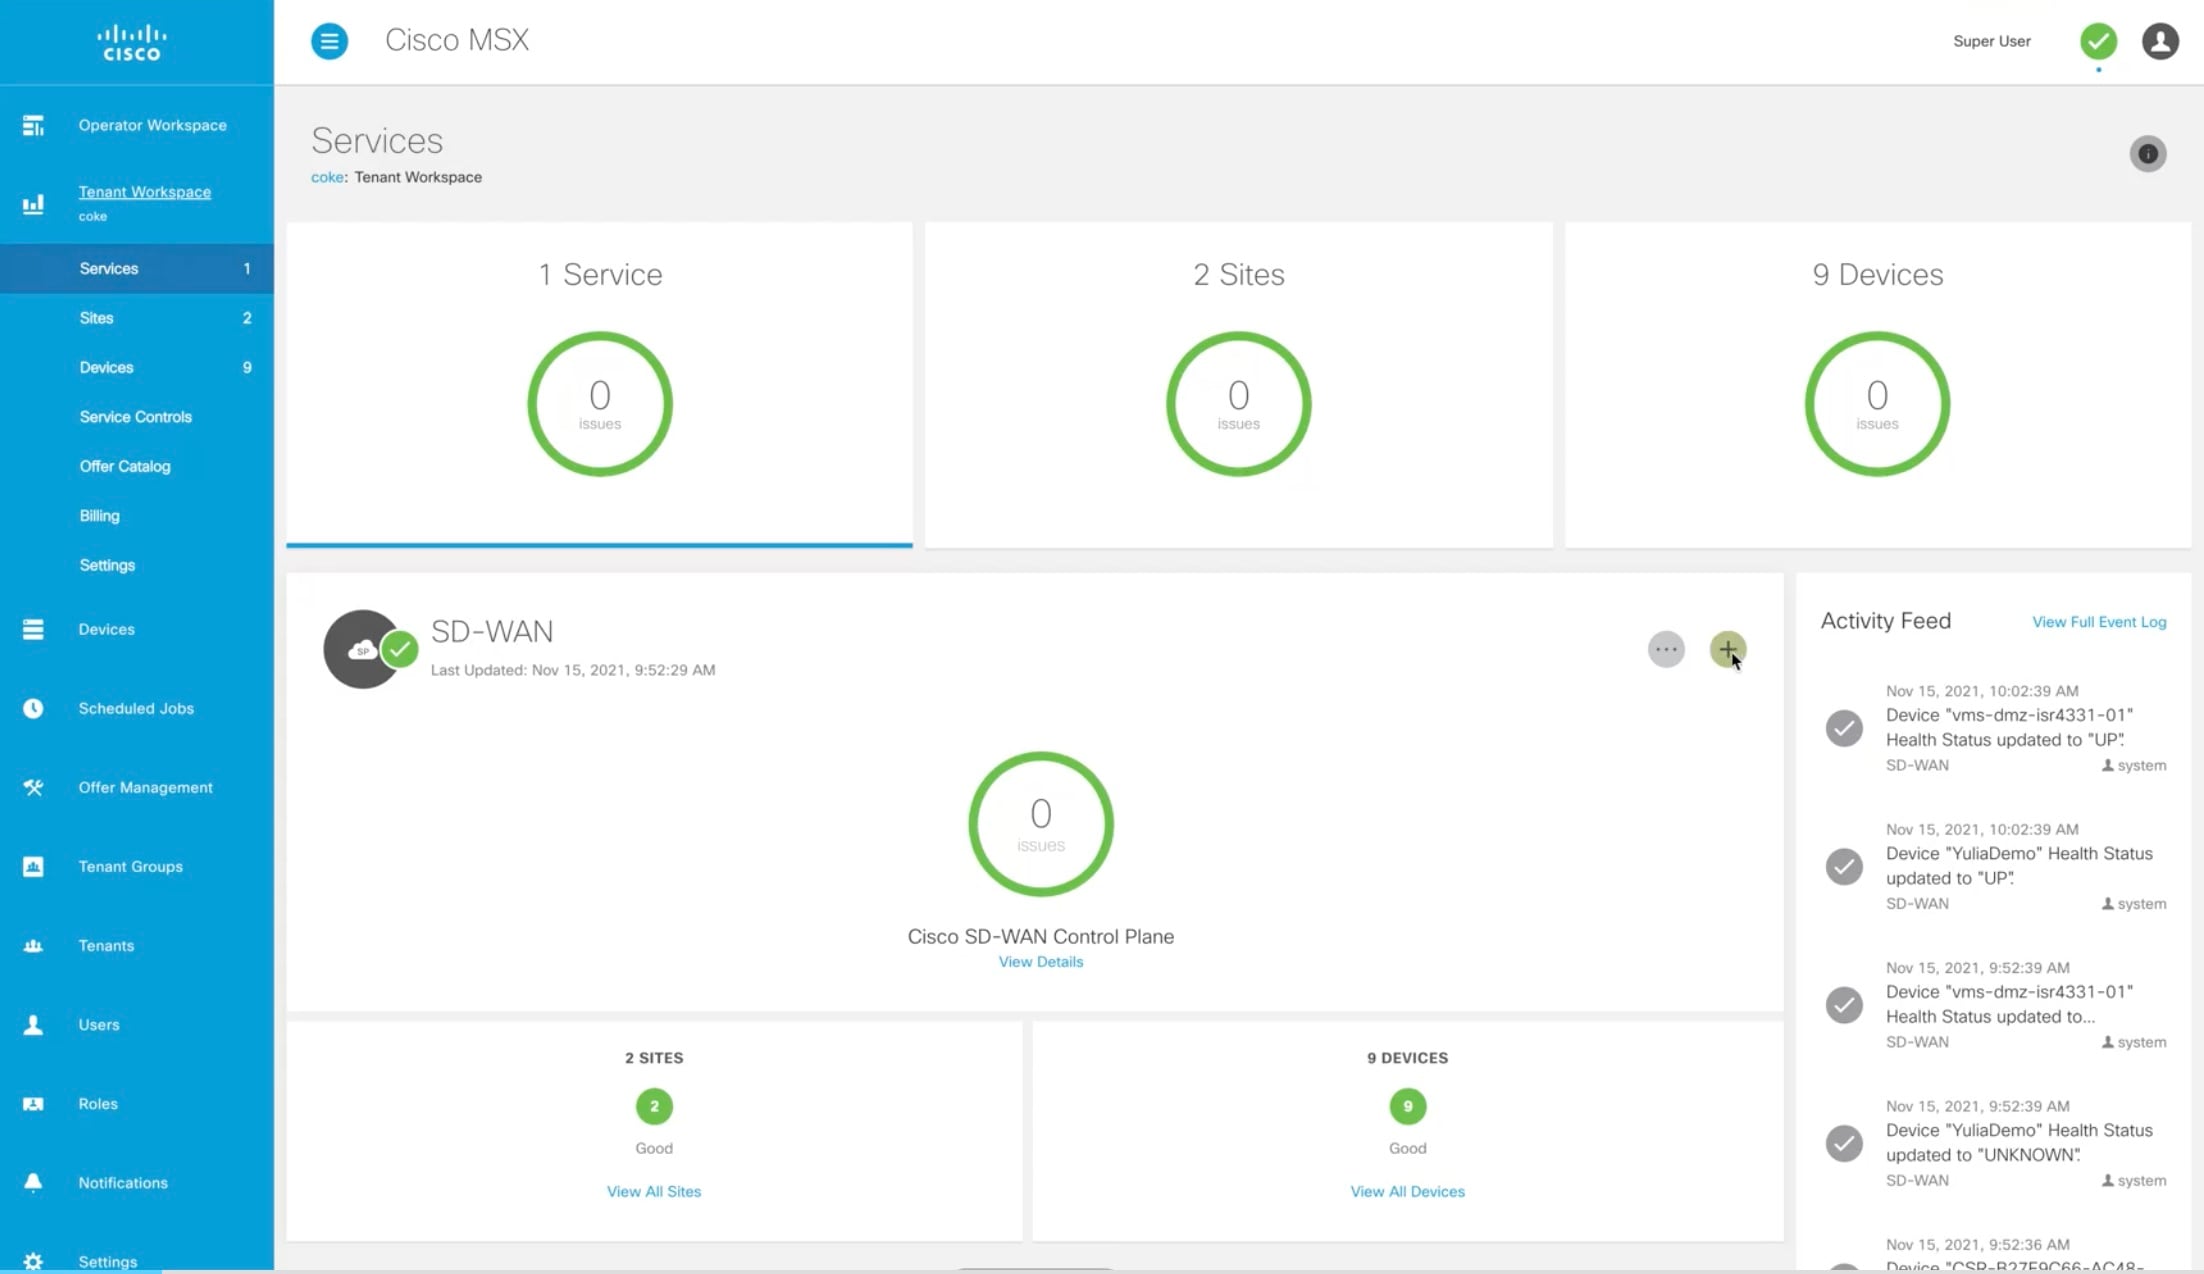
-
Services: Display all services subscribed by a tenant, service status, other service metrics, and control plane status.
For more information on service statuses in the Tenant Workspace, see Understanding Cisco SD-WAN Service Statuses.
-
Sites: Display an overview of the tenant’s sites, site status, and allows access to site details.
-
Devices: Displays an overview of the tenant’s devices, device status, and allows access to device details.

Note
Displays both mapped or unmapped sites or devices.
For more information on device statuses in the Tenant Workspace, see Monitoring Cisco SD-WAN Device Status.
-
Service Controls: Display the custom service controls that are used by the services. For Cisco MSX SD-WAN service pack, you can view traffic policies used by a tenant and perform bulk import of device templates.
-
Offer Catalog: Display existing subscriptions and allows subscribing to new services.
-
Billing: Display billing information about the tenant’s subscriptions. For more information on billing, see Managing Billing.
-
Activity Feed: The Cisco MSX portal allows a tenant to view several events pertaining to the subscriptions, sites, devices, template, and services. The events that are logged in the Events Log window are also used in the Activity Feed. To view the Activity Feed, choose Tenant Workspace > Services window. These contextual event feeds are also displayed on the Sites Detail window and Devices Detail window.
-
Understanding Cisco SD-WAN Service Statuses
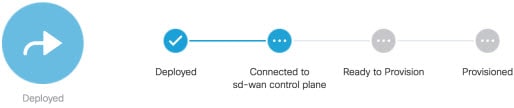
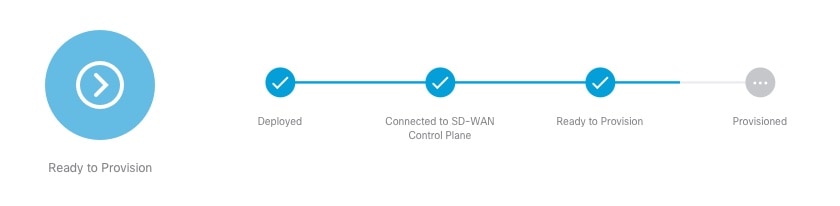
The service panel in the Tenant workspace allows tenants to see the next steps that can be performed for their subscribed services. After the services are set up and the network has connectivity, the panel also shows the services-related metrics.
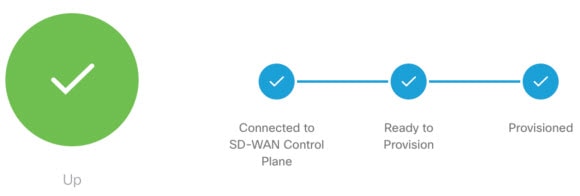
Tenants can monitor the status of the SD-WAN service in the Service tab and the SD-WAN service panel. This overall service status is calculated based on the service lifecycle status.
The following table illustrates the SD-WAN service lifecycle status:
|
Color |
SD-WAN Service Status |
Description |
|---|---|---|
|
Blue |
Ready to Provision |
SD-WAN control plane is not attached or created. |
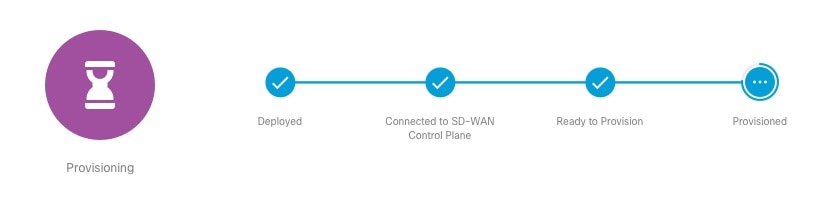
|
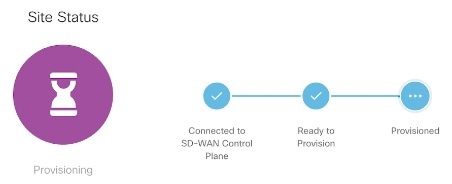
Purple |
Provisioning Deprovisioning |
Provisioning: Cisco MSX is attaching, or creating the SD-WAN control plane. Deprovisioning: Cisco MSX is deleting, or detaching the SD-WAN control plane. |
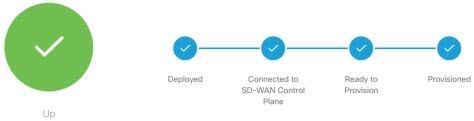
|
Green |
Provisioned |
Cisco MSX has attached or created the SD-WAN control plane. |
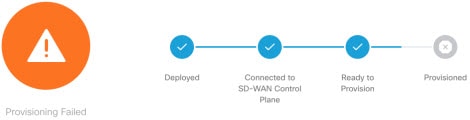
|
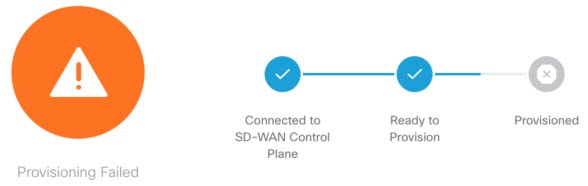
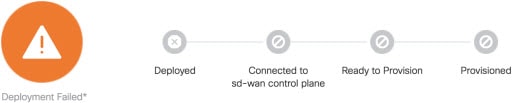
Orange |
Failed |
Provisioning or deprovisioning of the control plane failed. |
Monitoring Cisco SD-WAN Device Status
The Devices menu option in the Tenant Workspace provides the devices' overall status. The Devices menu displays both mapped (latitude and longitude defined) or unmapped devices.
Using this procedure, you can view the SD-WAN device statuses.
Procedure
| Step 1 |
Log in to the Cisco MSX portal using your credentials. |
||
| Step 2 |
From the left hand pane, choose Tenant Workspace > Devices. The Devices Overview window is displayed with overall status of the devices. 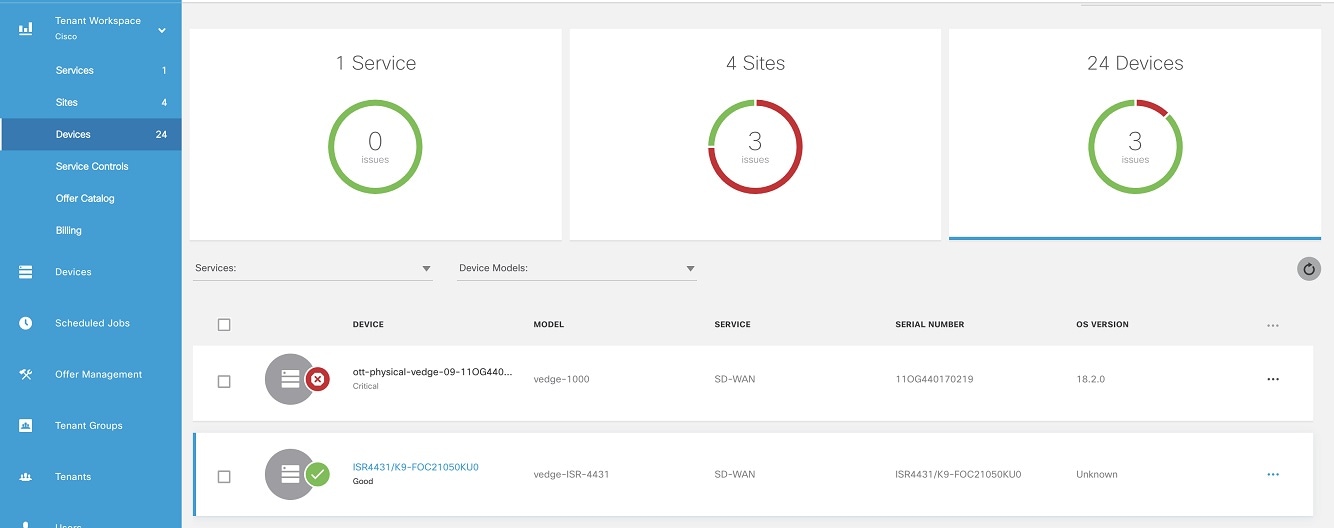
|
||
| Step 3 |
To view the status of a device, hover the mouse over the device and click to view the device summary. The device view expands and its overall status is displayed along with its health and lifecycle status. 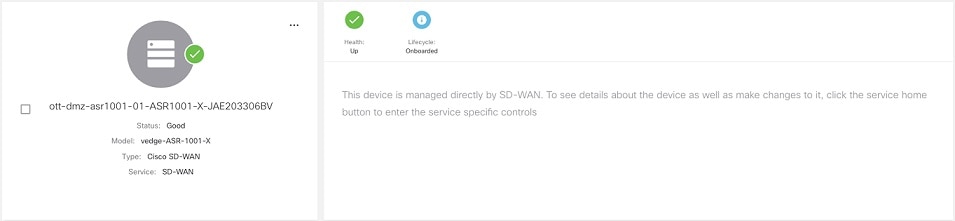
|
||
| Step 4 |
Click Device Details to view additional details of the device such as reachability, control plane name, last sync time, IP address, device template details. Device template shows the device template and its related information that was applied to that particular device. Related information includes device model, chassis number, system IP, hostname, and device template name. For more information about the sync time, see Understanding Cisco SDWAN Synchronization. |
Understanding Cisco SDWAN Synchronization
Cisco MSX synchronizes device inventory and configurations with the Cisco SD-WAN. During the sync time, Cisco MSX polls the controller, checks for updates, and updates the device details in Cisco MSX. This synchronization occurs every n minutes. By default, the sync time is 60 minutes.
The data presented on the device window is refreshed every (n) minutes depending on the time set.
Configuring the Sync Time
You can use the Task Scheduler Administration API to configure the sync time. As an operator, you can use PUT API (/api/v1/taskscheduler/{taskID} and update the value of recurrenceCronExpression to modify this duration.
Understanding Cisco SD-WAN Device Statuses
The overall device status (indicated by the Status option on the left-hand side of the Devices window) is categorized as In Progress, Critical, Poor, Fair, Good, and Unknown.
Note |
The device status in the legacy GUI is not the same as the status in the new Cisco MSX GUI. The overall device status is calculated based on the device lifecycle status (indicated by the Lifecycle bubble on the right-hand side), and the connectivity status. However, in some cases, overall device status also includes the device health status (indicated by the Health bubble on the right-hand side). The Device health status is considered only when the devices have system_ip configured or have VNFs successfully deployed and connected. |
The following figure illustrates overall device status, including device health, connectivity, and lifecycle statuses for an SD-WAN device.
Within Cisco MSX, any status type are numbered from 1 to 7, with the highest number 7 indicating the status as 'Critical' and the lowest number 1 indicating the status as 'Good'. An overall status looks into the available statuses (lifecycle or device health or both) for a device and picks the highest number and maps it to the below overall statuses.
| Overall Status | In Progress | Critical | Poor | Fair |
Unknown |
Good |
|---|---|---|---|---|---|---|
| Severity Number | 9 | 7 | 6 | 5 |
3 |
1 |
| SD-WAN Device Lifecycle Status Shown in the Devices Window |
What These Lifecycle Status Indicate |
Severity Number (Determines the Overall Status in the GUI) |
Overall Status Indication Based on the Severity Number |
|---|---|---|---|
| Configuring | Incomplete: Device is not ready to be provisioned because the data filled was incorrect or incomplete.
The device will be in this status until the details are corrected, and the template file is imported again into Cisco MSX. |
3 |
Unknown |
| Configuring | Ready to Provision: Device is connected and bulk data is imported. All provisioning details are completed and device is ready to provision. | 3 |
Unknown |
| Provisioning |
Provisioning: Provisioning process pushes the configuration data into the Control Plane such that the site is set up for day one configurations. The provisioning process on the Control Plane takes approximately 5 to 10 minutes. |
3 |
Unknown |
| Provisioning Failed |
Provisioning Failed: The Site Status changes to ‘Provisioning Failed’ if the configuration data imported does not match with the values on the Control Plane. |
6 |
Poor |
| Provisioned | Provisioned: Site was provisioned successfully. | 1 |
Good |
| Onboarded | Deployed: ENCS site is deployed and vEdge is able to communicate to the Control Plane. | 1 |
Good |
| Onboarding | Deploying: ENCS site deployment with a vEdge is in progress. | 3 |
Unknown |
| Onboarding Failed | Deployment Failed: Could not bring up vEdge using ENCS. | 6 |
Poor |
| Deleting | Deleting: Deleting a device is in progress. | 3 |
Unknown |
| Deleting Failed | Deleting Failed: Deleting the device failed. | 6 |
Poor |
Depending on wheter you are provisioning a physical, vEdge cloud, or vEdge SP Cloud, the site statuses and the next steps varies. For more information on these site statuses for these device types, see the sections below:
Device Statuses for Physical Device
The table below shows the status of Physical device (vEdge or IOS XE) with various validation messages shown on Cisco MSX, along with next steps.
|
Summary Status |
Description |
Next Steps |
||
|---|---|---|---|---|
 |
The device is in the process of being shipped to customer site. At this point, Cisco MSX portal does not show physical devices on the map as these still do not have any address or map coordinates for the sites to plot them on the map. The site is plotted as ‘Unmapped sites’ on Cisco MSX map. |
Connect the device. After the device is installed on the premise, connect the device, it goes through the ZTP (Zero Touch Provisioning) process and gets connected to the Control Plane. |
||
 |
The device has established connectivity to the Control Plane, but does not have the provisioning data to provision a device. |
Import bulk data. For information, on how to import, see Importing Multiple Site Data from Cisco SD-WAN into MSX. After importing, Cisco MSX displays various validation messages to indicate the errors or missing information in the template file. You can click View Details in the validation message to display the Site Import Summary with the error list.
|
||
 |
|
|
||
 |
||||
 |
|
If the status is ‘Critical’, troubleshoot SD-WAN control plane connectivity issue. For more information, see Troubleshooting Cisco SD-WAN Reachability Issues. |
||
 |
|
Provisioning could fail because of one of the following reasons.
|
||
 |
||||
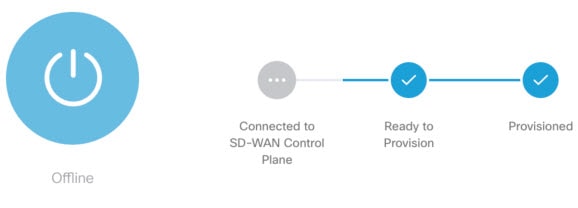 |
Offline: A device is in the process of being shipped has been uploaded and provisioned on the Control Plane. When the device is connected and has reachability to the Control Plane, the template on the Control Plane is applied on the device. |
Connect the device. |
Device Statuses for vEdge SP Cloud
The table below show the statuses for vEdge SP Cloud with various validation messages shown on Cisco MSX, along with next steps.
|
Summary Status |
Description |
Next Steps |
||
|---|---|---|---|---|
|
Unknown: Device has been added on Cisco MSX portal and the configurations are downloaded by the service provider. The Unknown state indicates the time period when the Service Provider uses the downloaded configurations to brings up a vEdge cloud to finish deployment. The device during this phase waits for the vEdge to be deployed and connected back to SD-WAN Control Plane. |
During this state, bulk data can be imported and provision the SP Cloud through Cisco MSX. For information, on how to import, see Importing Multiple Site Data from Cisco SD-WAN into MSX. |
||
|
|
After importing, Cisco MSX displays various validation messages to indicate the errors or missing information in the template file. You can click View Details in the validation message to display the Site Import Summary with the error list.
|
||
 |
||||
 |
Ready to Provision: In both cases, that is, connected to control plane and not connected to control plane, bulk data can be imported, and the devices are ready to be provisioned. |
For device with ‘Ready to Provision’ status, see Provisioning Details under Device Summary, click Provision Device to initiate the provisioning process. |
||
|
||||
|
Incomplete: Device is not ready to be provisioned because the data filled was incorrect or incomplete. The device will be in this status until the details are corrected, and the template file is imported again into Cisco MSX. |
For device with ‘Incomplete’ status, see Provisioning Details under Device Summary. This section lists the fields that have missing data. Enter the missing details in the Site template file and import again. |
The remaining statuses for the vEdge SP cloud are similar to the Physical devices. For more information on the other statuses, see Device Statuses for Physical Device.
Device Statuses for vEdge Cloud
The table below show the site status for vEdge Cloud with various validation messages shown on Cisco MSX, along with next steps.
|
Summary Status |
Description |
Next Steps |
||
|---|---|---|---|---|
 |
ENCS site deployment with a vEdge is in progress. |
|||
 |
Not Connected: vEdge is deployed but is not able to establish connection with the Control Plane. |
|
||
 |
|
Troubleshoot the data plane. For more information, see Data Plane Troubleshooting. |
||
 |
||||
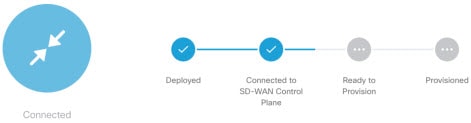 |
Connected: vEdge is deployed and connected to Control Plane. System is now ready for bulk import of data from multiple sites. |
After the connection is established, you can import bulk data for provisioning the site. For more information, see Importing Multiple Site Data from Cisco SD-WAN into MSX. |
||
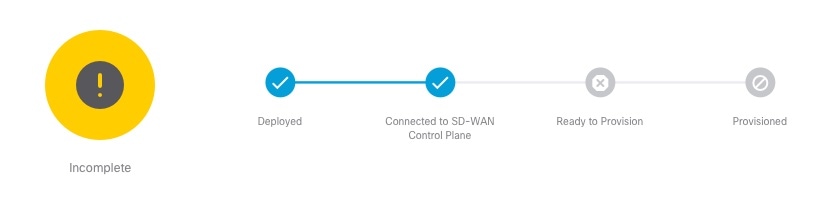 |
Incomplete: Device is not ready to be provisioned because the data filled was incorrect or incomplete. The device will be in this status until the details are corrected, and the template file is imported again into Cisco MSX. Ready to Provision: Device is connected and bulk data is imported. All provisioning details is complete and device is ready to provision. |
|
||
 |
||||
 |
|
Provisioning could fail because of one of the following reasons.
|
||
 |
||||
 |
|
If the status is ‘Critical’, troubleshoot SD-WAN control plane connectivity issue. For more information, see Troubleshooting Cisco SD-WAN Reachability Issues. |
Monitoring SD-WAN Control Plane Status
In Cisco MSX SD-WAN, Control Plane allows you to centrally manage the devices for a tenant, including provisioning, monitoring, and so on.
Before you begin
-
Set up a control plane for your tenant. For more information, see Setting Up Control Plane for Cisco SD-WAN.
-
Complete control plane's post deployment configurations. For more information, see Postdeployment Tasks for SD-WAN Control Plane.
To monitor the status of the SD-WAN control plane:
Procedure
| Step 1 |
Log in to the Cisco MSX Portal. |
||
| Step 2 |
From the left pane, click Tenant Workspace > Services. |
||
| Step 3 |
In the SD-WAN service panel, click on the ellipsis (...) and click Control Plane Details. The following is the Cisco SD-WAN Control plane status after the certification, the security groups, and other configurations are completed. 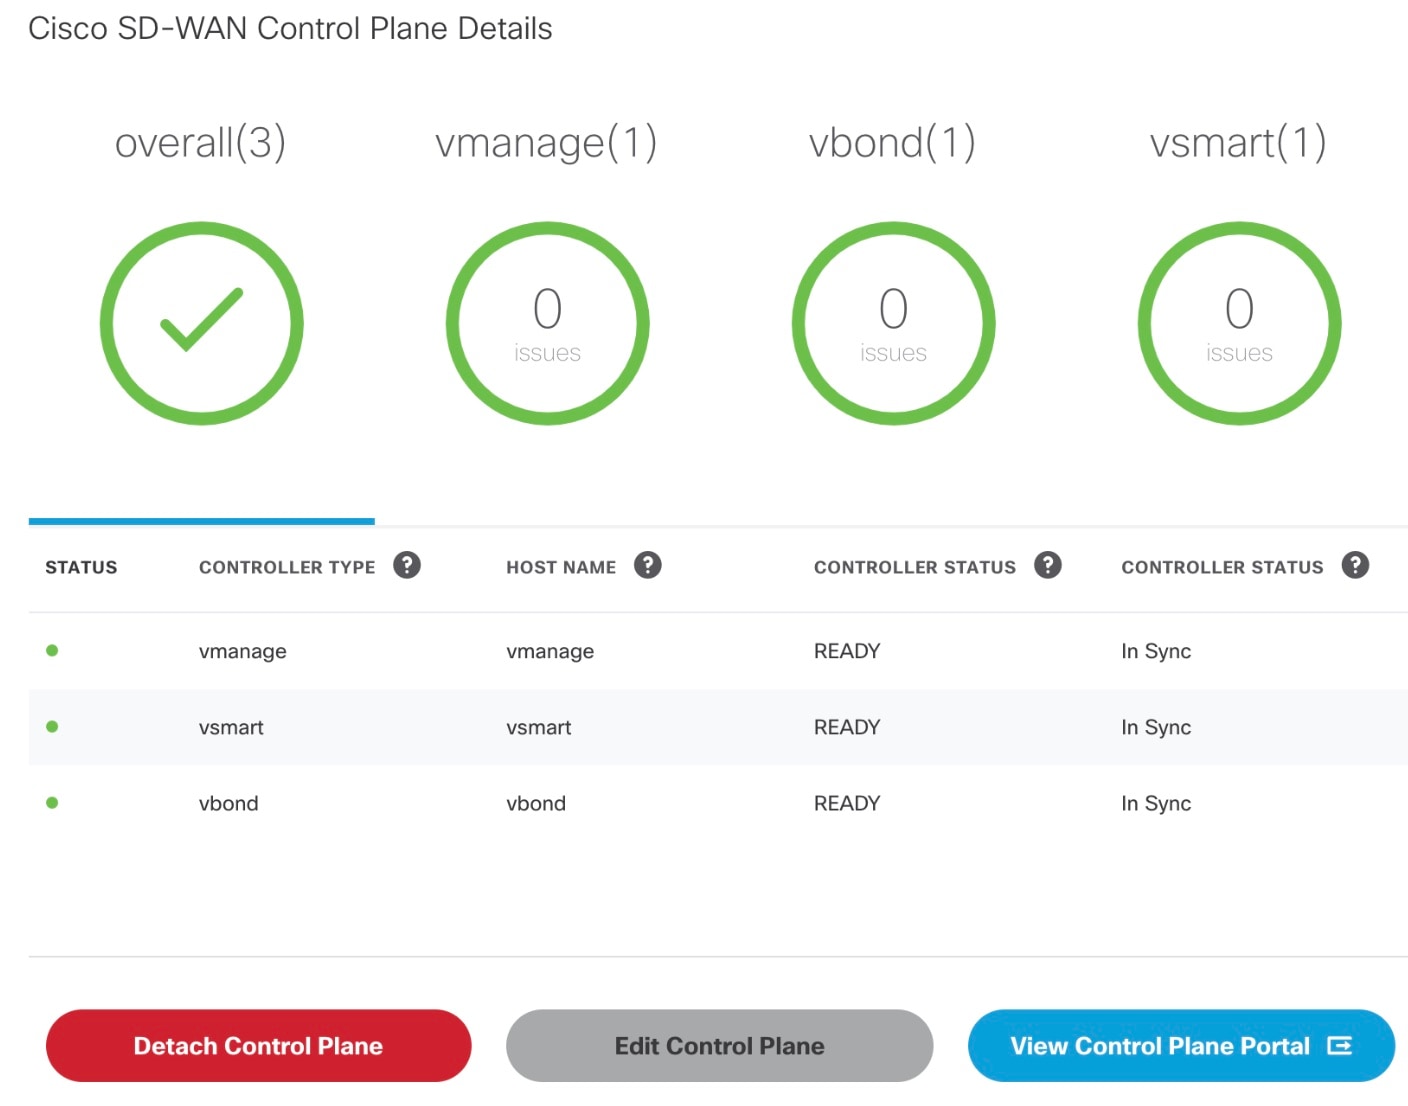
|
Monitoring Tunnel Health
The tunnel health graph gives an overview of the health of the IPSec tunnels from the SD-WAN device.
The tunnel report in Cisco MSX shows how many of these tunnels are up, which is an indication of whether the device is at risk of losing connectivity.
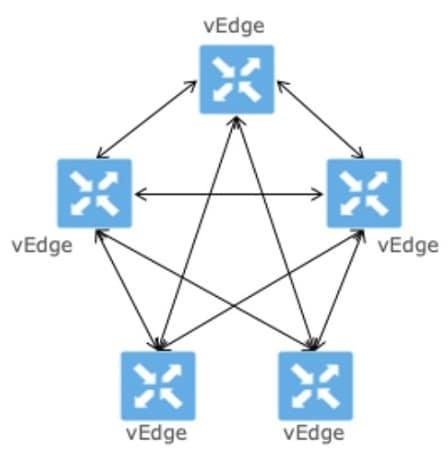
For example: In the following figure, tunnels are established for vEdge with every other vEdge in the network. If more tunnels are down, it could indicate that vEdge device from where tunnels are established is experiencing degradation. If only a small subset of tunnel links are down, it means other vEdge devices may be possibly experiencing degradation.
Tunnel Health Reporting or Tunnel Health Status Calculations:
Tunnels Up % = (Number of Tunnels in Up state / Total Number of Tunnels) * 100
For example:
If there are 200 tunnels and 80 tunnels are up, the Tunnel Up % will be (80/200)*100 = 40%
For other tunnel performance metrics, such as data loss, latency, jitter information, click View Tunnel details on Control Plane to launch the tunnel details. For more information on these metrics, see Cisco SD-WAN documentation.
To view the control plane status for the SD-WAN service:
Before you begin
To monitor tunnel health, make sure users have the following permission assigned:
-
Under Services, Configurations, and Devices category, select Service Metrics (View) permission permission.
Procedure
| Step 1 |
Log in to the Cisco MSX portal using your credentials. |
||||||||||
| Step 2 |
From the left hand pane, choose Tenant Workspace > Services. The Services Overview window is displayed. |
||||||||||
| Step 3 |
Click on the SD-WAN Home option to display the tenant-specific Site Summary window. |
||||||||||
| Step 4 |
Click the Toggle button on the top right-hand side of the page to toggle between the list and map view with the list of sites for the selected tenant.
|
||||||||||
| Step 5 |
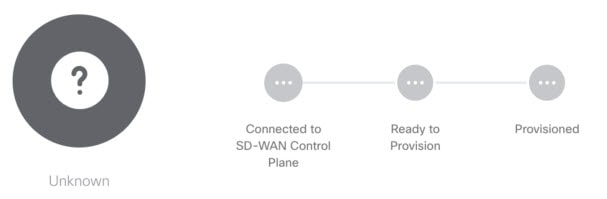
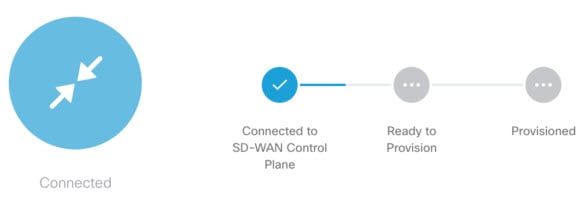
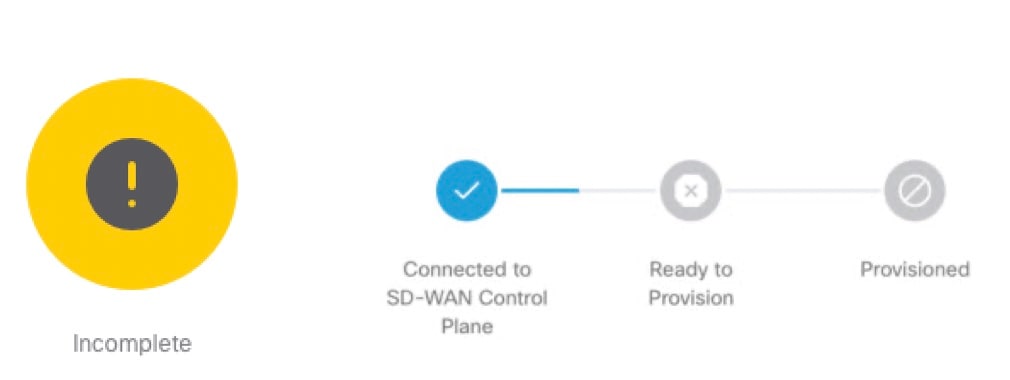
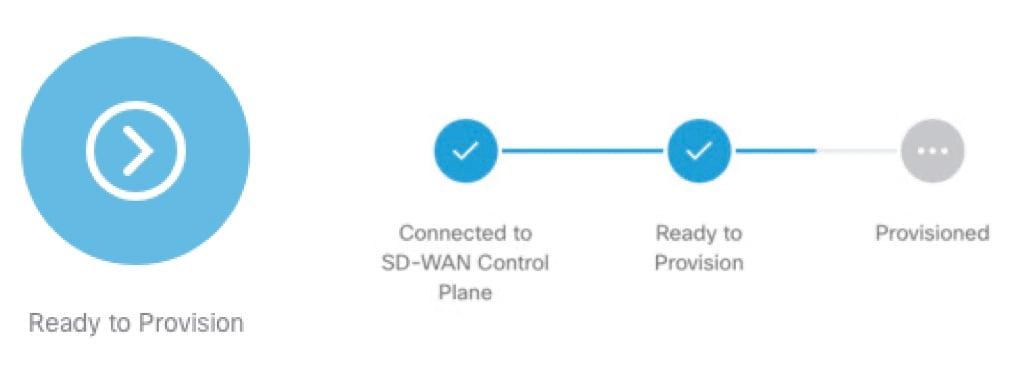
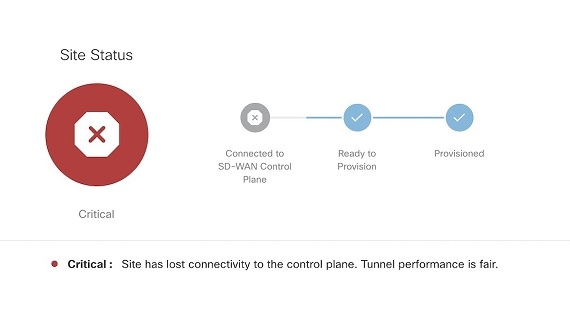
Select a site/device from the list of devices. The Site Summary window appears with site information and basic device details, such as chassis number, system IP, site ID, and so on. The Site Status in the details page changes based on the various status of SD-WAN devices along with status of tunnel health. For more information on the the site/device lifecycle statuses, see Monitoring Cisco SD-WAN Device Status. The following table displays the Tunnel Health status that appears below the overall Site Status image based on the Tunnel
Up %.
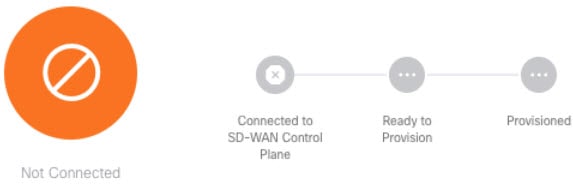
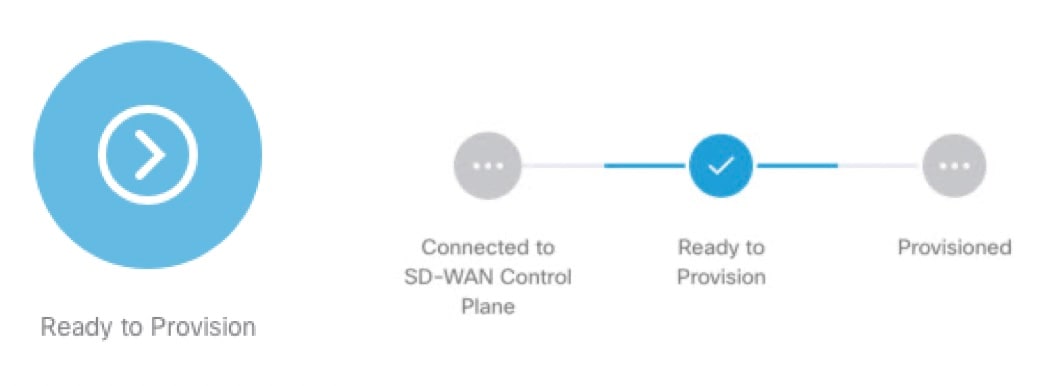
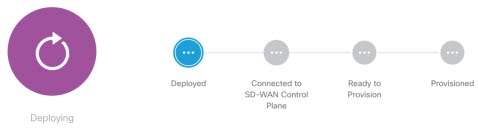
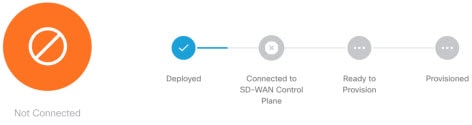
The following are a few examples of the overall Site/Device Status depending on control plane status and the text beneath the image is based on the tunnel health status. 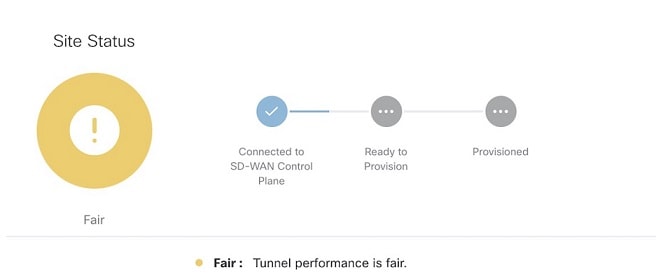
|
||||||||||
| Step 6 |
On the Site Summary window, scroll down to the Tunnel Health section to view the current tunnel metrics. A graphical representation of all existing tunnels for the device appears. 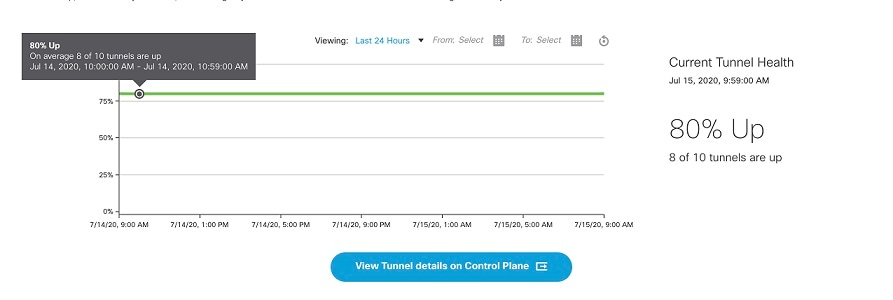
Where: X axis - Time range Y axis - Tunnels Up % (values 0-100) |
||||||||||
| Step 7 |
Select the time interval for displaying the tunnel health for that period. Choose one of the available time intervals from the Viewing drop-down list or click Custom to choose a time duration of your choice for which the reporting is displayed. Provide the day and time from when the reporting data must be collected until the specified end time. By default, last 24 hours chart is loaded. Hover over the aggregated data points on the chart to get specific details, including the timestamp when the event occurred. These aggregated data points are system-generated. For more information on these data points, click on the Learn More link. |
Monitoring SD-WAN Reporting Metrics Using Third-Party Network Monitoring Applications
You can integrate third-party network monitoring applications with SD-WAN on Cisco MSX, for example, LiveAction for real-time network insight. If integrated with SD-WAN, users can launch the application dashboard from the Cisco MSX Portal.
Before You Begin
Integrate LiveAction with Cisco MSX.
To launch a third-party monitoring portal from the Cisco MSX Portal:
Procedure
| Step 1 |
Log in to the Cisco MSX portal using your credentials. |
| Step 2 |
From the left hand pane, click Dashboard. The Dashboard window is displayed. |
| Step 3 |
Click the SD-WAN Home button. The SD-WAN Home window is displayed. |
| Step 4 |
Select the tenant from the drop-down. The SD-WAN Home window refresh and displays the control plane status for the selected tenant. |
| Step 5 |
To launch the application dashboard, click Launch Monitoring Portal. The application dashboard opens up in a separate browser. |
Monitoring the Traffic Policy
Monitoring the Traffic Paths
To confirm traffic path:
Procedure
| Step 1 |
Log in to the vEdge or cEdge (IOX XE) server. |
| Step 2 |
Turn on application visibility on the vEdge or cEdge. To do so use the following commands: Example: |
| Step 3 |
Send traffic through the vEdge or cEdge. |
| Step 4 |
Check the path for vEdge and cEdge:
Example:
Example: |
Monitoring the Application Queue
To confirm application queues:
Procedure
| Step 1 |
Log in to the vEdge or the cEdge server. |
| Step 2 |
Send traffic through the vEdge or cEdge. |
| Step 3 |
Check the queues for vEdge and cEdge:
The output will show all the available application queue. |
Viewing Event Logs
To view the event logs:
Before you begin
Procedure
| Step 1 |
Log in to the Cisco MSX Portal. |
| Step 2 |
In the main menu, click Event Log. The Event Log screen appears. 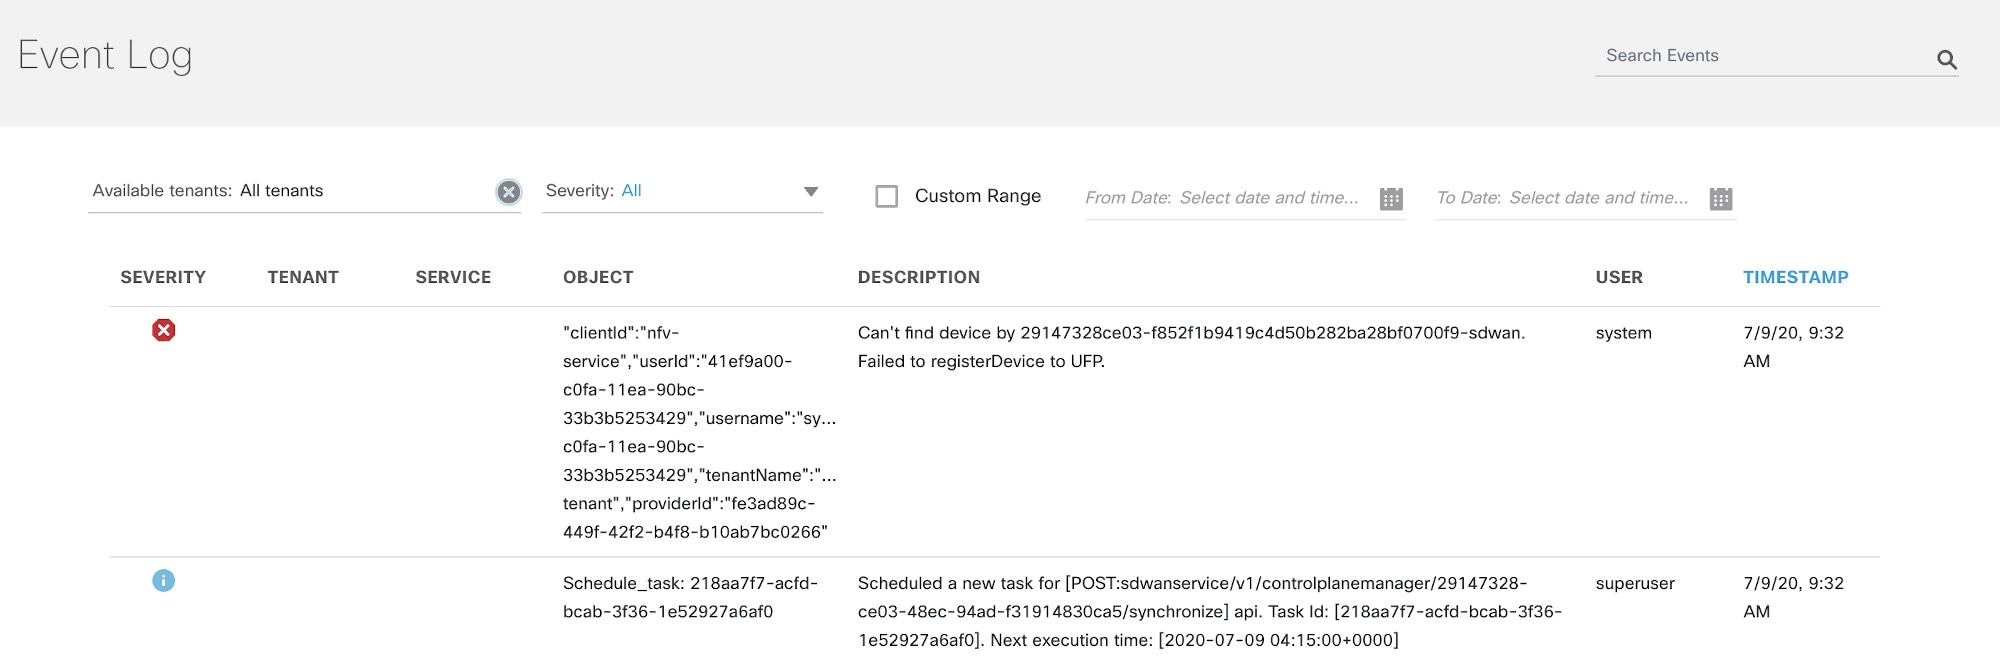
|
| Step 3 |
Select the tenant from the drop-down for which the event log has to be displayed. |
| Step 4 |
To filter the event log records, select the filter type from the drop-down. To list event logs for a specific duration, select the Custom Rangecheck box and specify the dates. |
![]()
 Feedback