Cisco Edge Intelligence pipelines
In Cisco Edge Intelligence local manager dashboard, we create pipelines to define the data progression. Creating a pipeline involves defining:
-
One/multiple source asset type
-
One data destination
-
A data transformation method, in the form of a data rule or a data logic
To create a pipeline in the Cisco Edge Intelligence local manager GUI, in the Pipelines area of the left pane, click the plus (+) sign button. At the top of the page, enter a name for the pipeline. Ensure that each pipeline name for the Cisco Edge Intelligence must be unique, in compliance with the following recommendations.
-
Do not use special characters for a pipeline name, as special characters are removed during internal processing. We recommend using the CamelCase naming convention.
For example, use
WaterSensorSalinityJ2345instead ofWater Sensor-Salinity_J2345. -
Avoid ending a pipeline name with the letter
sto indicate a plural form, as this name can cause internal naming conflicts.For example, use
ColdStoragePlcinstead ofColdStoragePlcs.
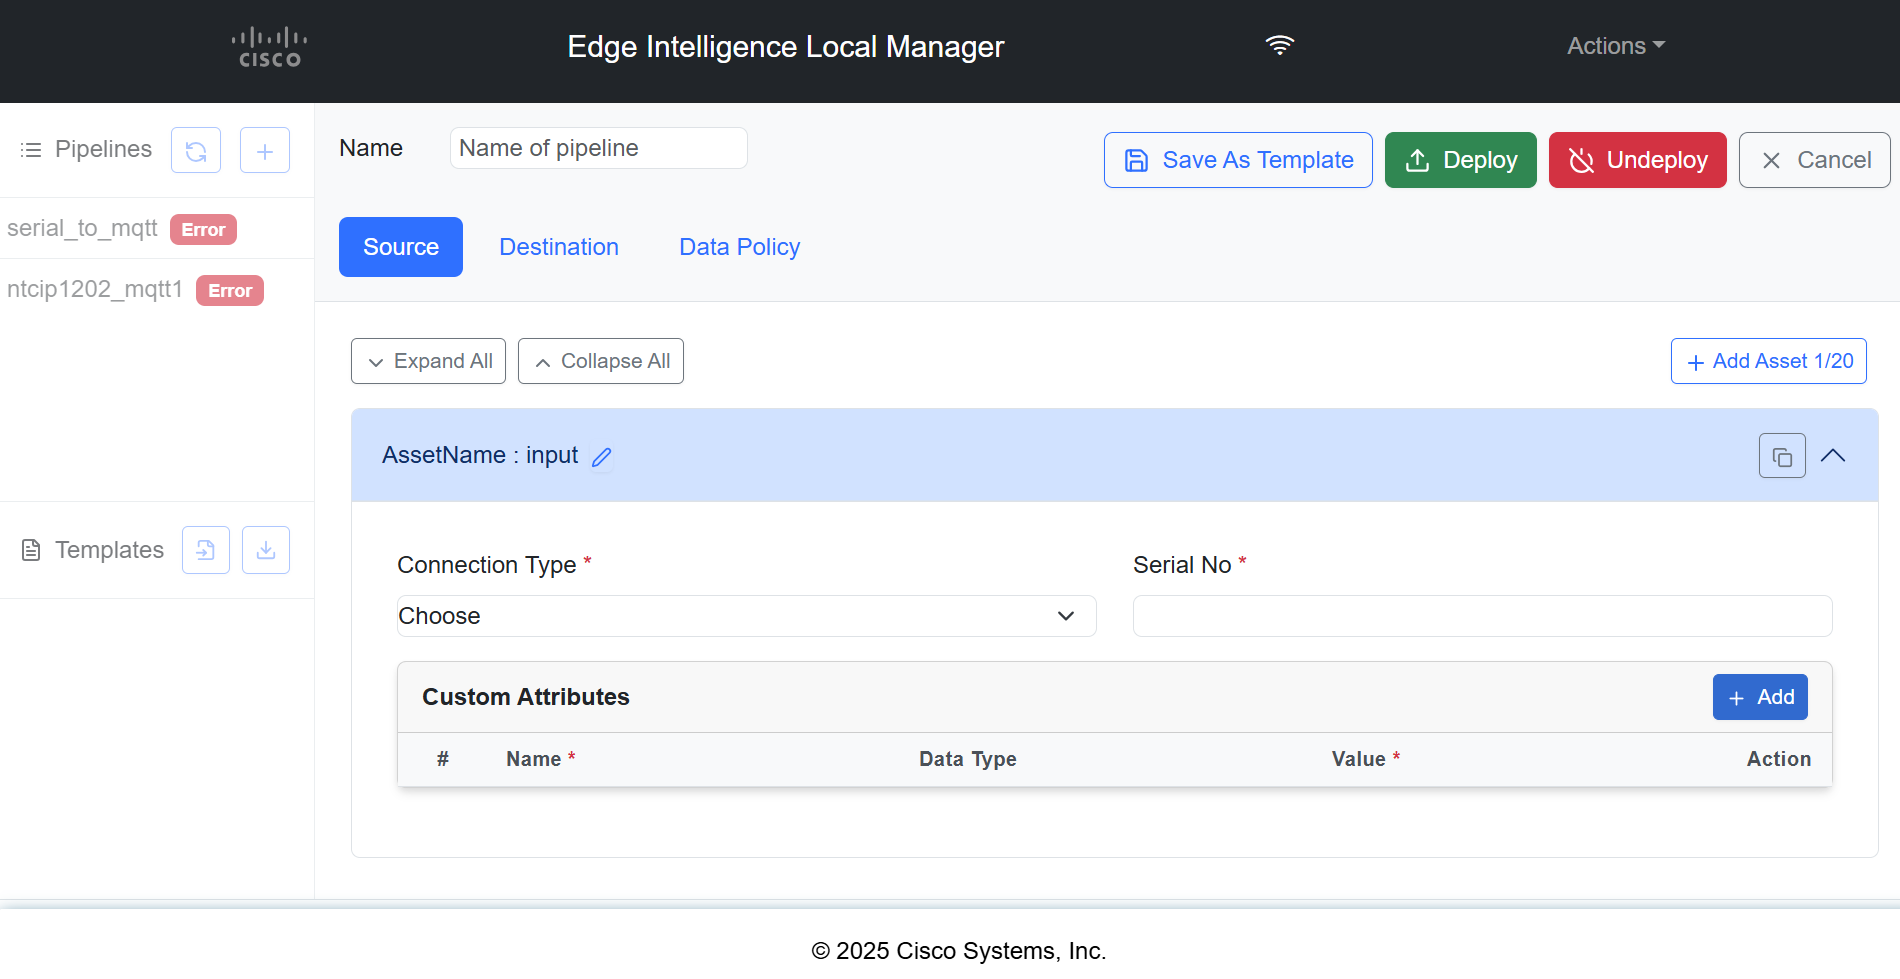
Add Source
Adding Asset Type Details
Procedure
|
In the Source tab, complete the following fields.
|
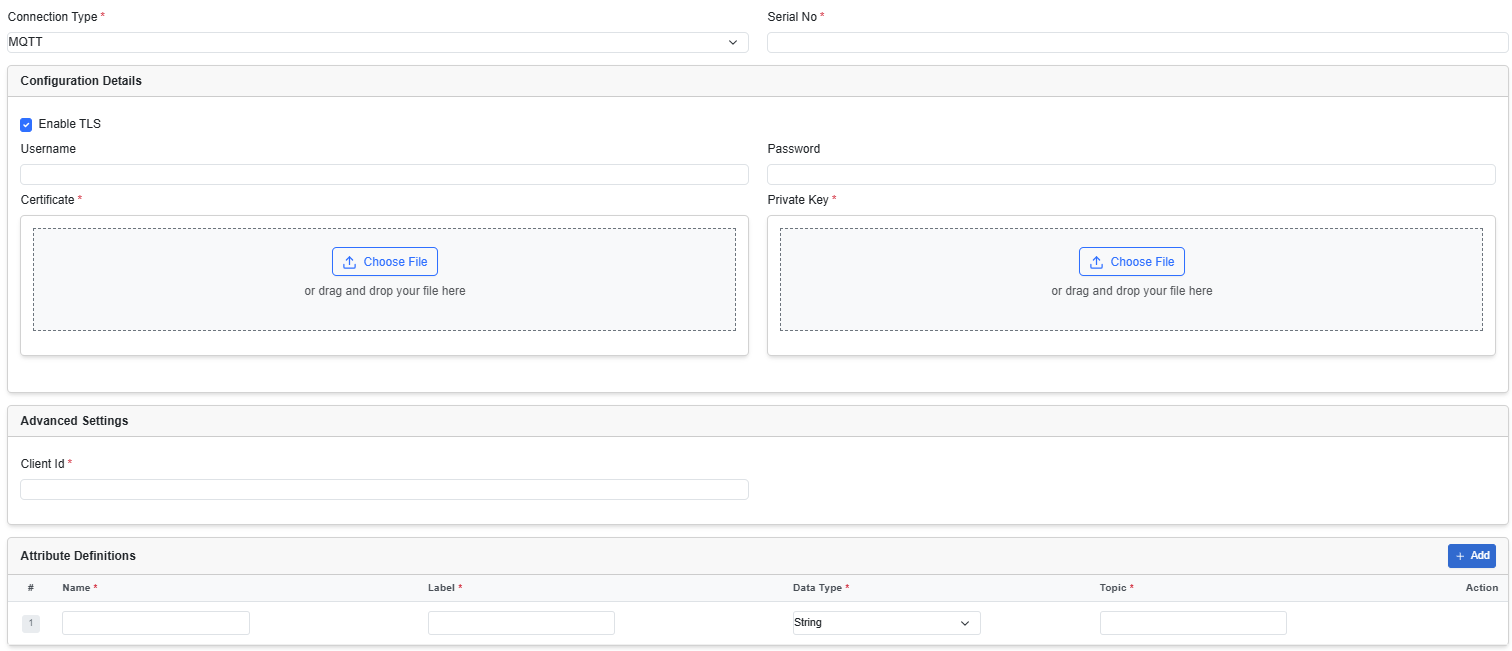
Configure MQTT asset type
The MQTT asset type enables and configures the Cisco Edge Intelligence MQTT Server. You can publish data to the EI Agent from an MQTT client on the following ports after deploying this to an EI Agent:
-
Port 8883 for TLS configurations
-
Port 1883 for non-TLS configurations
In the Source tab, from the Connection Type drop-down list, choose MQTT. Then, fill out the following fields.
|
Field |
Description |
|---|---|
|
Configuration Details |
|
|
Enable TLS |
Choose this checkbox to enable TLS. When you choose to enable TLS, additional fields are displayed to allow the upload of certificate and private key files. The MQTT server that is deployed on the EI agent, uses these certificates and private keys to authenticate the MQTT clients connecting to it. |
|
Username |
Enter a username. The connecting MQTT Clients (sensors) will use this username for authentication at the MQTT Server which will be spawned on the EI Agent. |
|
Password |
Enter the Password. The connecting MQTT Clients (sensors) will use this password for authentication at the MQTT Server which will be spawned on the EI Agent. |
|
Advanced Settings |
|
|
Client ID |
Add a client ID to publish data. (Topic-based device or sensor identity detection is not supported). The client ID, specified in the MQTT client connection, differentiates various MQTT connections to Cisco Edge Intelligence. |
|
Attribute Definitions |
The data model explains how data is represented in the asset, and what MQTT topics the asset should be updated from. To define a data model, add the following details:
Click Add to add more data model attributes to the configuration |
 Note |
The MQTT topic used to publish sensor data and the data format should match the data model JSON file. |
MQTT data model example:
{
    "apiVersion": 1.0,
    "connectionType": "MQTT",
    "fields": {
      "temperature": {
        "category": "TELEMETRY",
        "label": "Temperature",
        "description": "Outside temperature sensor XY | Temperature",
        "datatype": "Float",
        "topic": "sensors/tempXY/temp"
       },
       "humidity": {
         "category": "TELEMETRY",
         "label": "Humidity",
         "description": "Outside temperature sensor XY | Humidity",
         "datatype": "Float",
         "topic": "sensors/tempXY/hum"
       },
       "attr1": {
         "category": "ATTRIBUTE",
         "label": "Attribute 1",
         "datatype": "Float",
         "description": "My Attribute 1",
         "required": true,
         "defaultValue": 12.9
       },
       "attr2": {
         "category": "ATTRIBUTE",
         "label": "Attribute 2",
         "datatype": "String",
         "description": "My Attribute 2",
         "required": false,
         "defaultValue": null
       },
       "encrypted_attr3": {
         "category": "ATTRIBUTE",
         "label": "New Attribute",
         "datatype": "EncryptedString",
         "description": "My Attribute 3",
         "required": true,
         "defaultValue": null
       }
    }
}
MQTT topic and sensor data used by MQTT Client example:
MQTT Client Topic: sensors/tempXY/hum
MQTT Client Data: 50.0
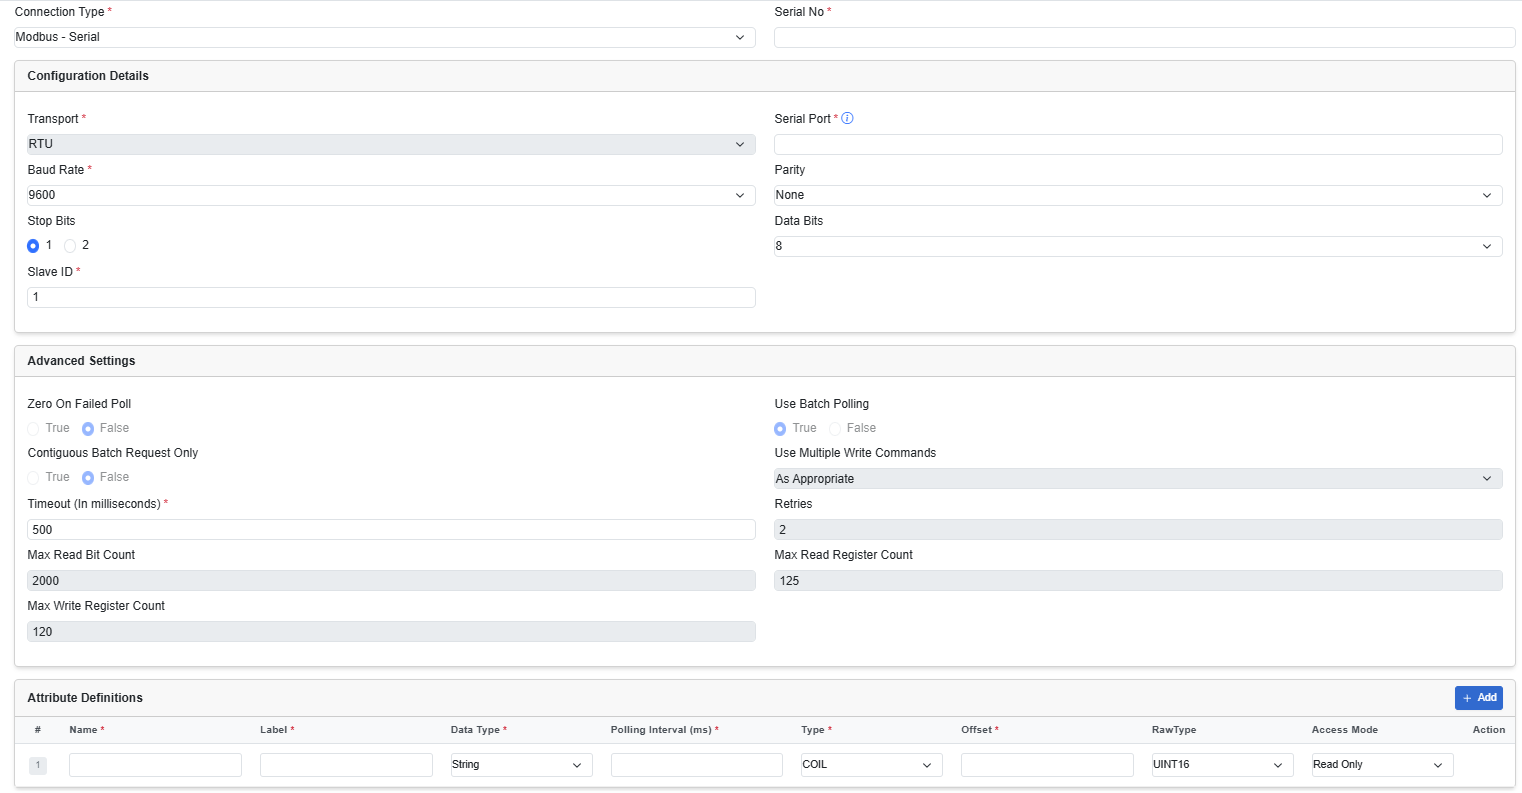
Configure Modbus-Serial asset type
From the Device Type drop-down list, choose MODBUS-Serial. Then enter the required details in the following fields.
|
Field |
Description |
|---|---|
|
Configuration Details |
|
|
Transport |
This field is not editable. It has a default value set for RTU. |
|
Serial Port |
Enter a port number. For example, |
| Baud Rate | Enter a baud rate. |
| Parity | From the drop-down list, choose None, Odd, or Even. |
| Stop Bits | This value can be either 1 or 2. Choose the required radio button. |
| Data Bits | From the drop-down list, choose a value 5–9. |
| Slave ID |
This refers to the unique identifier assigned to a Modbus secondary device (such as a sensor or PLC) on a serial network. Modbus protocol requires each secondary device to have a unique ID (1–247) to distinguish it on a shared bus. This ID ensures that the Modbus primary (such as the Cisco EI agent) sends requests to the correct device and processes its responses. |
|
Advanced Settings |
|
| Zero or Failed Poll | The value if there is no response from the asset. This field is not editable. |
| Use Batch Polling | To request batch responses from the asset. This field is not editable. |
| Contiguous Batch Request Only | To request contiguous batch responses from the asset. This field is not editable. |
| Use Multiple Write Commands | This field is not editable. |
| Timeout | The time in which to receive the data before it is reset. The default value is 500. |
| Retries | The number of times the server requests for retransmission of data. This field is not editable. |
| Max Read Bit Count | The maximum number of bits that the server reads in one read request. This field is not editable. |
| Max Read Register Count | The maximum number of registers that the server reads in one read request. This field is not editable. |
| Max Write Register Count | The maximum number of registers that the server writes in one write request. This field is not editable. |
| Attribute Definitions | A data model explains how data is represented in the asset. You can create a data model using a JSON file. Select one of the
following:
Click Add to add more data model attributes to the configuration |
Modbus_serial data model example:
{
  "apiVersion": 1,
  "connectionType": "MODBUS_SERIAL",
  "fields": {
    "pressureInPascal": {
      "label": "MetrLabeModb1",
      "pollingInterval": 50,
      "offset": 12,
      "type": "HOLDING",
      "datatype": "Float",
      "rawType": "VARCHARSTRING",
      "description": "",
      "access": "Write"
    },
    "TemperatureInDegrees": {
      "label": "Temperature",
      "pollingInterval": 41,
      "offset": 56,
      "type": "DISCRETE",
      "datatype": "String",
      "rawType": "INT16",
      "description": "",
      "access": "ReadWrite"
    },
    "HumidityInDegrees": {
      "label": "Humidity",
      "pollingInterval": 20,
      "offset": 45,
      "type": "COIL",
      "datatype": "Int",
      "rawType": "FLOAT64",
      "description": "Humidity Value ",
      "access": "Read"
    }
  }
}
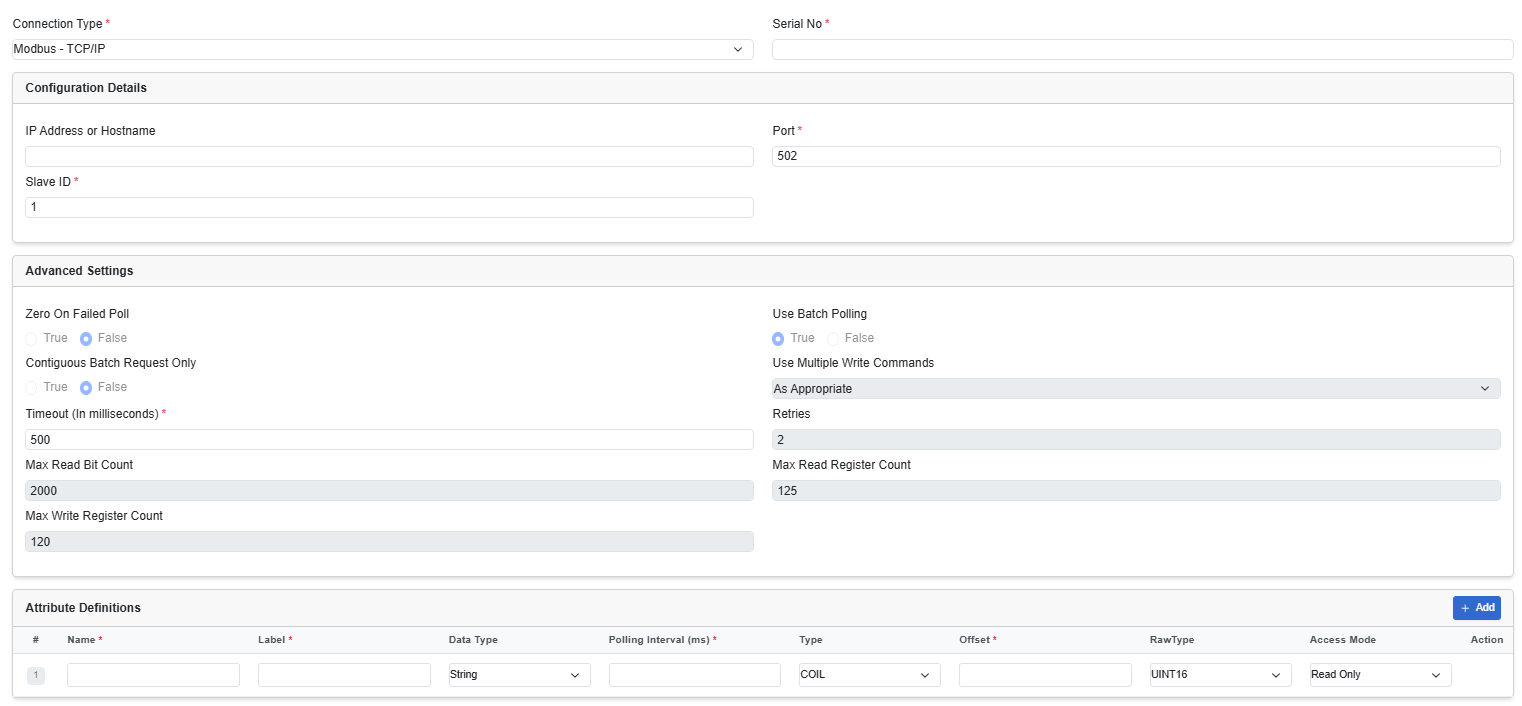
Adding Asset Types for Modbus TCP Connection Type
After you select the MODBUS-TCP/IP, complete the following additional fields by adding the details on it.
|
Field |
Description |
|---|---|
|
Configuration Details |
|
| IP Address or Host Name | Enter an IP address or hostname. |
| Port | Enter a port number. |
| Slave ID |
This refers to the unique identifier assigned to a Modbus secondary device (such as a sensor or PLC) on a serial network. Modbus protocol requires each secondary device to have a unique ID (1–247) to distinguish it on a shared bus. This ID ensures that the Modbus primary (such as the Cisco EI agent) sends requests to the correct device and processes its responses. |
| Advanced Settings | |
| Zero on Failed Poll | The value if there is no response from the asset. This field is non-editable. |
| Use Batch Polling | To request batch responses from the asset. This field is non-editable. |
| Contiguous Batch Request Only | To request contiguous batch responses from the asset. This field is non-editable. |
| Use Multiple Write Commands | This field is non-editable. |
| Timeout | The time set to receive the data before it is reset. The default value is 500. |
| Retries | The number of times the server requests for retransmission of data. This field is non-editable. |
| Max Read Bit Count | The maximum number of bits that the server reads in one read request. This field is non-editable. |
| Max Read Register Count | The maximum number of registers that the server reads in one read request. This field is non-editable. |
| Max Write Register Count | The maximum number of registers that the server writes in one write request. This field is non-editable. |
| Attribute Definitions | A data model explains how data is represented in the asset. You can create a data model using a JSON file. Enter the following
details:
Click Add to add more data model attributes to the configuration |
The following is an example of a data model for Modbus-TCP/IP source type.
{
  "apiVersion": 1,
  "connectionType": "MODBUS_TCP",
  "fields": {
    "desired_temp": {
      "label": "Desired Temperature",
      "datatype": "Int",
      "description": "WO",
      "rawType": "UINT16",
      "type": "HOLDING",
      "pollingInterval": 5000,
      "offset": 5,
      "category": "TELEMETRY",
      "access": "Write"
    },
    "temp_to_display": {
      "label": "Temperature to be displayed",
      "datatype": "Int",
      "description": "RW",
      "rawType": "UINT16",
      "type": "HOLDING",
      "pollingInterval": 5000,
      "offset": 100,
      "category": "TELEMETRY",
      "access": "ReadWrite"
    },
    "temp": {
      "label": "Current Temperature",
      "datatype": "Int",
      "description": "RO",
      "rawType": "UINT16",
      "type": "HOLDING",
      "pollingInterval": 5000,
      "offset": 1,
      "category": "TELEMETRY",
      "access": "Read"
    }
  }
}
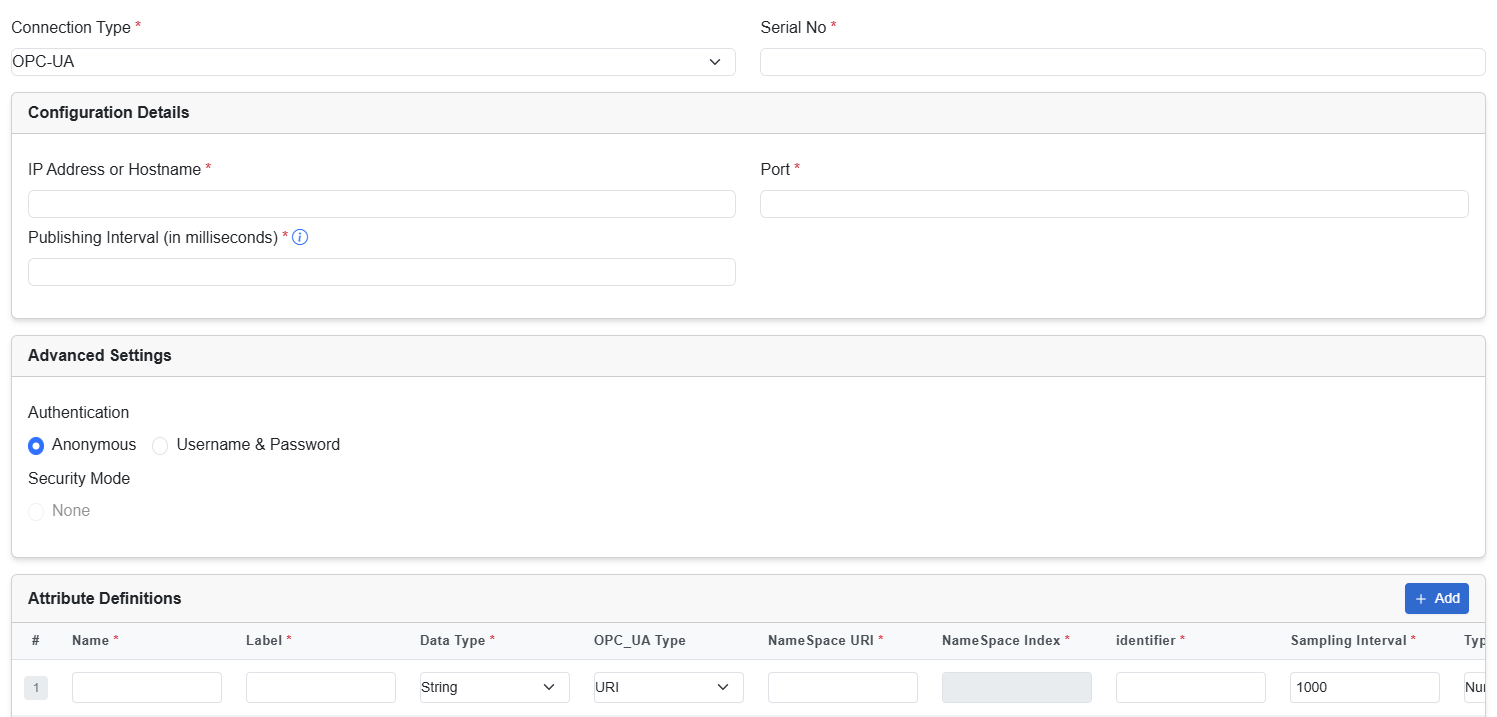
Configure OPC-UA asset type
After you select the asset type OPC-UA, enter the required details in the following fields:
|
Field |
Description |
||||
|---|---|---|---|---|---|
| Configuration Details | |||||
| IP Address or Host Name | Enter an IP address or hostname. | ||||
| Port | Enter a port number. | ||||
| Publishing Interval | This is the requested publishing frequency from the OPC-UA Server. The interval must be greater than or equal to 1000ms.
|
||||
| Advanced Settings | |||||
| Authentication | Choose an authentication type:
|
||||
| Security Mode | This field is non-editable. The default value is None. | ||||
|
Attribute Definitions |
A data model explains how data is represented in the asset.
Click Add to add more data model attributes to the configuration |
||||
The following is an example of a data model for OPC-UA source type.
{
  "apiVersion": 1,
  "connectionType": "OPC_UA",
  "fields": {
    "temperature": {
      "label": "Temperature",
      "description": "",
      "datatype": "Float",
      "nodeId": {
        "namespaceUri": "2",
        "identifier": "2",
        "type": "numeric"
      },
      "samplingInterval": 1000,
      "category": "TELEMETRY"
    }
  }
}
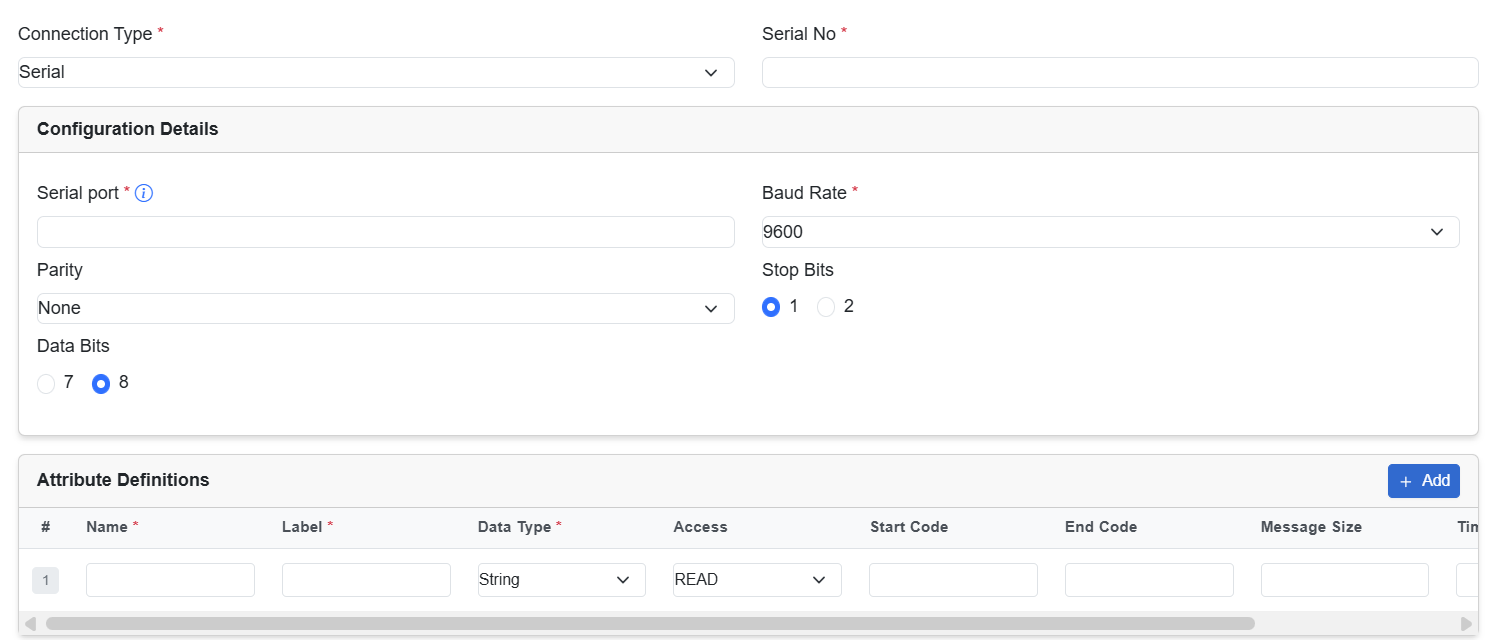
Configure Serial asset type
After you select the asset type Serial, enter the required details in the following fields.
|
Field |
Description |
|---|---|
| Configuration Details | |
| Serial Port | Enter a port number. For example, /dev/ttyS0 |
| Baud Rate | From the drop-down menu, choose 9600, 19200 or you can add a new custom value on it. |
| Parity | From the drop-down menu, choose None, Odd, or Even |
| Stop Bits | Choose the radio button for 1 or 2. |
| Data Bits | From the drop-down menu, choose 7 or 8. |
| Attribute Definitions | A data model explains how data is represented in an asset.
|
Common errors and troubleshooting
Errors can easily occur when configuring a serial port. For example:
-
The wiring must be accurate. For example, see the Cisco IR829 installation guide.
-
The serial relay service should be configured correctly for the Guest OS. For example, see the Cisco Catalyst IR1101 documentation and Cisco Catalyst IR1800 documentation.
-
The physical serial port must be correctly exposed to IOx through the local manager.
To troubleshoot a serial interface:
-
Make sure that serial port is configured in propagate mode at the IOS level. A current workaround is to use just the 0x prefix as the StartCode to specify an empty StartCode.
-
For testing interface options only:
-
Use a data model with a fixed message size of 1 byte and no start code.
-
Verify that there is some data that is coming in to ensure that the connection is working.
-
Once this is done, the actual data model can be defined.
-
Serial Connector data model
A serial connector asset type has a reduced data type.
The following combinations are allowed:
-
One read attribute
-
One read plus one write attribute
-
One read-write attribute
Read attribute allows the following configuration combinations:
-
Message Size and Timeout
-
StartCode and Message Size and an optional Timeout
-
StartCode and EndCode and an optional Timeout
Start-/End-Code prefix handling:
-
Prefix 0x allows to specify hex encoded binary data. For example, 0x1310 -> CR+LF)
-
Prefix allows to specify as-is
Serial data model example:
{
  "apiVersion": 1,
  "connectionType": "SERIAL",
  "fields": {
    "data_string1": {
      "label": "My Data String",
      "datatype": "String",
      "description":    "serial read attribute",
      "access": "READ"
      "startCode": "$",
      "endCode": "0x0a",
      "messageSize":""
    }
  }
}
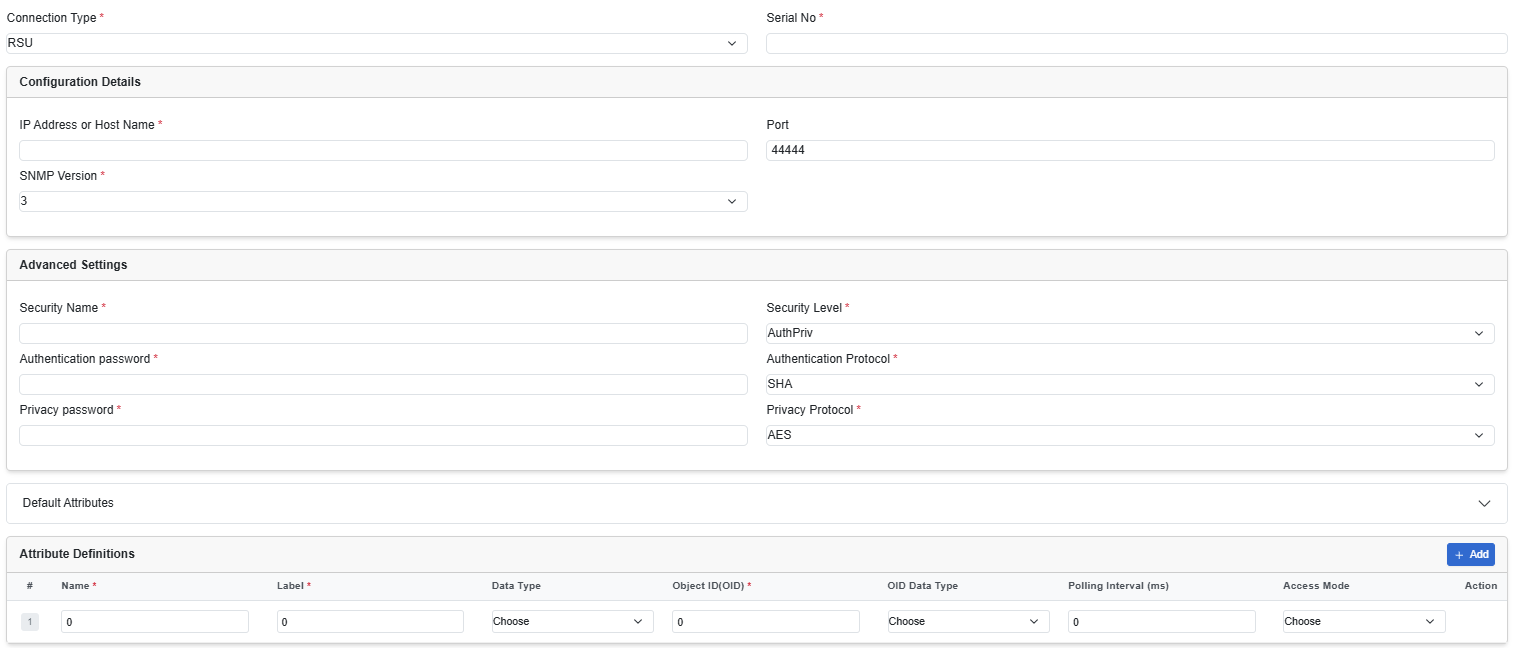
RSU asset type settings
The RSU asset type supports a set of static attributes in addition to the regular configurable attributes. Static attributes are always available and not required to be configured.
-
The static attributes have a JSON string content and reflect incoming DSRC messages, except storeAndRepeatMessage and broadcastImmediately static attributes.
-
The storeAndRepeatMessage must be set as an array of message objects. All previous messages will be overwritten by the new array.
-
The current array of messages can be obtained by reading the attribute.
-
The basic configuration for this asset type includes the host, port, and SNMP version.
-
Advanced settings like community or authentication data must be set depending on the SNMP version.
In the Source tab, from the Device Type drop-down list, choose RSU. Then, fill the following fields.
|
Field |
Description |
|---|---|
|
Configuration Details |
|
| IP Address or Host Name | Enter the IP address or hostname. |
| Port | Enter the port number. |
| SNMP Version | Select a version from the drop-down list from 1, 2c and 3.
3 is the most secure version. |
| Advanced Settings | Complete these fields based on the selected SNMP Version. |
|
Default Attributes |
It shows the default attributes that are specific to RSU. Even if you will not add any additional attributes, it runs for the agents. |
| Attribute Definitions | A data model explains how data is represented in an asset.
Click Add to add more attributes to the asset configuration. |
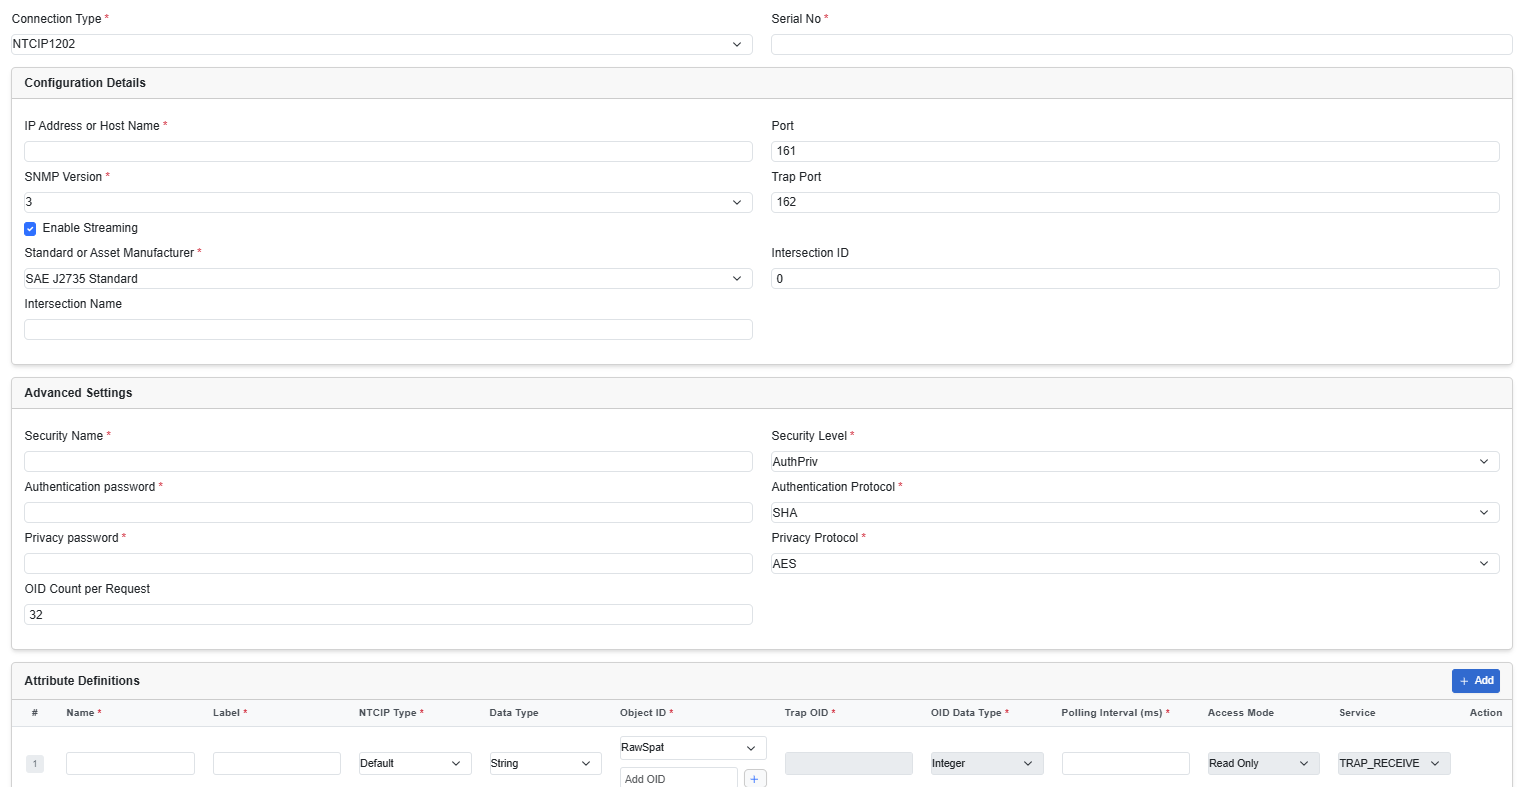
NTCIP1202, NTCIP1203, NTCIP1204 asset type settings
Cisco Edge Intelligence - local manager supports three NTCIP devices. Use the Asset Type for the correct connection type.
-
NTCIP 1202—Actuate Signal Controller
-
NTCIP 1203—Dynamic Message Sign
-
NTCIP 1204—Road Weather Information System
The basic configuration for all these three asset types include the host, port, and SNMP version.
Advanced settings like community or authentication data must be set depending on the SNMP version.
Each NTCIP asset type supports a set of static attributes in addition to the regular configurable attributes.
|
Field |
Description |
||||||||
|---|---|---|---|---|---|---|---|---|---|
| Configuration Details | |||||||||
| IP Address or Host Name | Provide the IP address or Host Name. | ||||||||
| SNMP Version | Select a version from the drop-down list from 1, 2c and 3.
3 is the most secure version. |
||||||||
| Port | Provide a NTCIP connector port number.
|
||||||||
| Trap Port (Applicable only for device type: NTCIP1202) | Provide Trap port number.
|
||||||||
|
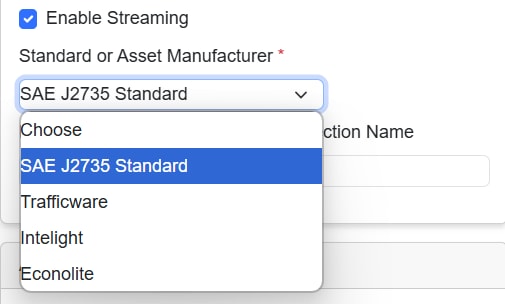
Enable Streaming (Specific to device type: NTCIP1202) |
Choose this checkbox to enable Streaming. When you choose to enable Streaming, an additional field Standard or Asset Manufacturer protocol is displayed. NTCIP 1202 allows the streaming of data using standard and Asset manufactured protocols. The different protocols are: Standard protocol:
Asset manufactured protocols
 |
||||||||
| Intersection ID (Specific to device type: NTCIP1202) | Intersection ID is optional and depends on the user's specific use case. You can choose to configure this field if required for their particular scenario. For example, in traffic use cases, this information is mandatory. | ||||||||
| Intersection Name (Specific to device type: NTCIP1202) | Intersection Name is optional and depends on the user's specific use case. You can choose to configure this field if required for their particular scenario. | ||||||||
| Advanced Settings | The specific Advanced Setting details vary based on the SNMP Version. Provide the appropriate authentication information accordingly. | ||||||||
| Attribute Definitions | A data model explains how data is represented in an asset.
|
||||||||
Add data destinations
In the Destination tab, define where configured data policies must send data to.
The supported destinations are MQTT servers, AWS IoT server, and Azure IoT Hub. From the Type drop-down list, choose the destination. Then, configure the connection settings for the chosen destination.
Before you configure a data destination in the pipeline, ensure that you have set up the servers or hubs. You must have the required identifying information ready to complete the destination configuration.
Add a Microsoft Azure IoT Hub destination
Procedure
|
In the Destination tab, from the Type drop-down list, choose AZURE IoT, and enter the required details in the following fields. 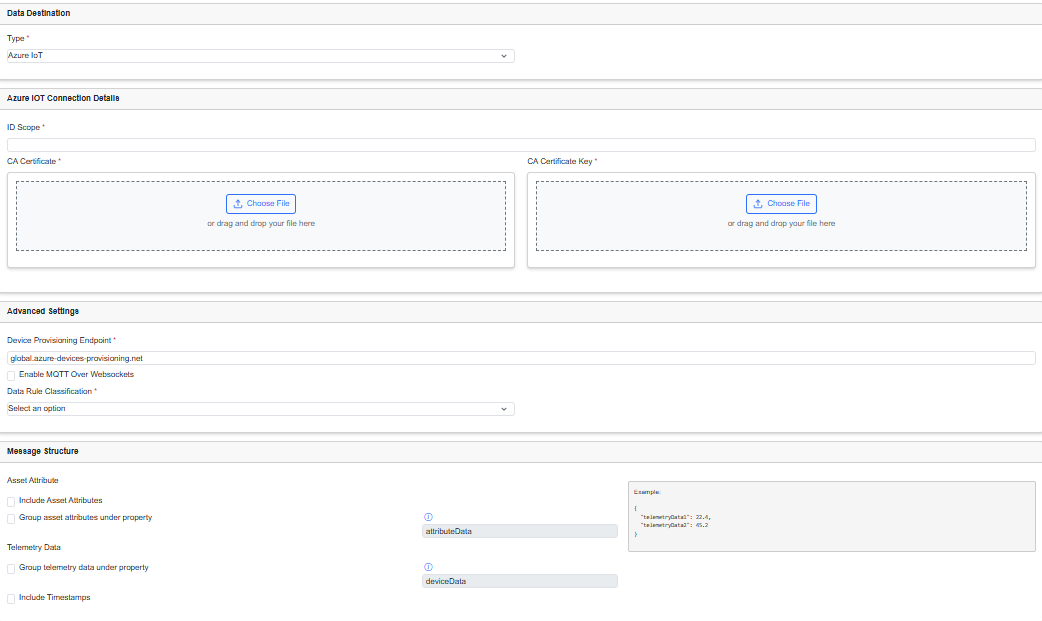
|
||||||||||||||||||||||
Add an MQTT Server destination
Procedure
|
In the Destination tab, from the Type drop-down list, choose MQTT Server and enter the required details in the following fields. 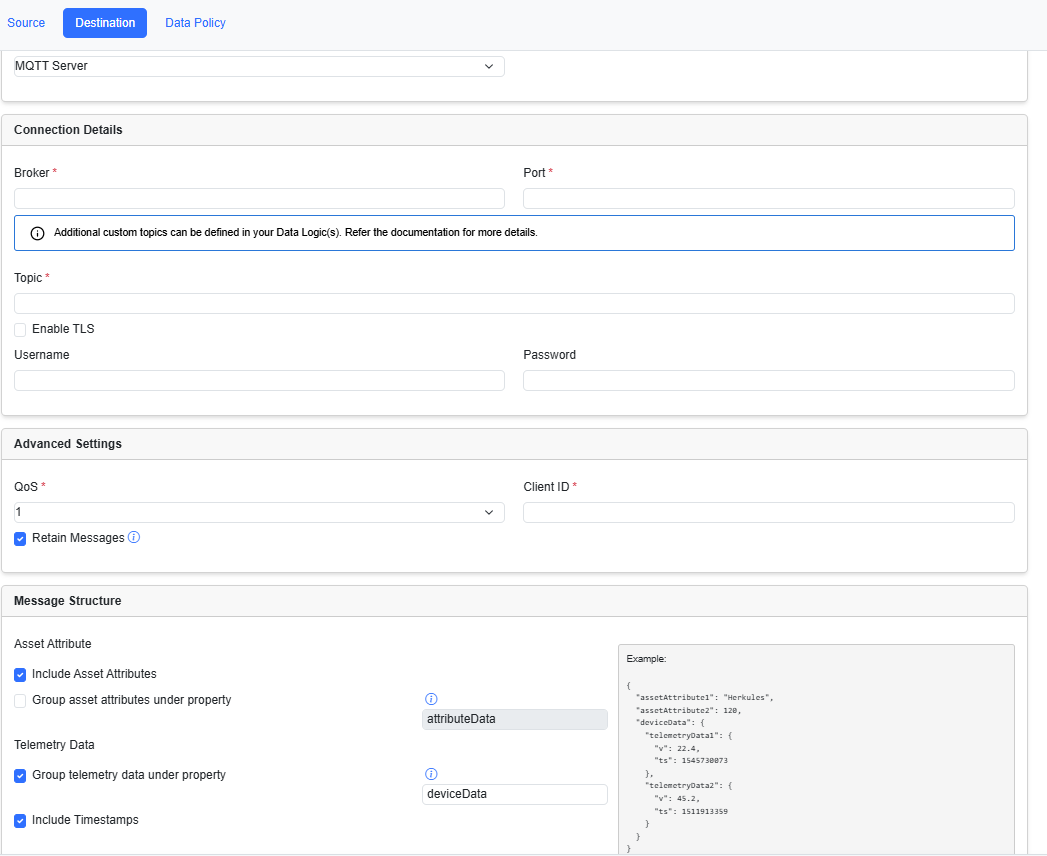
|
||||||||||||||||||||||||||||||||||
Add an AWS Server destination
Procedure
|
From the Destination tab, from the Type drop-down list, choose AWS and enter the required details in the following fields. 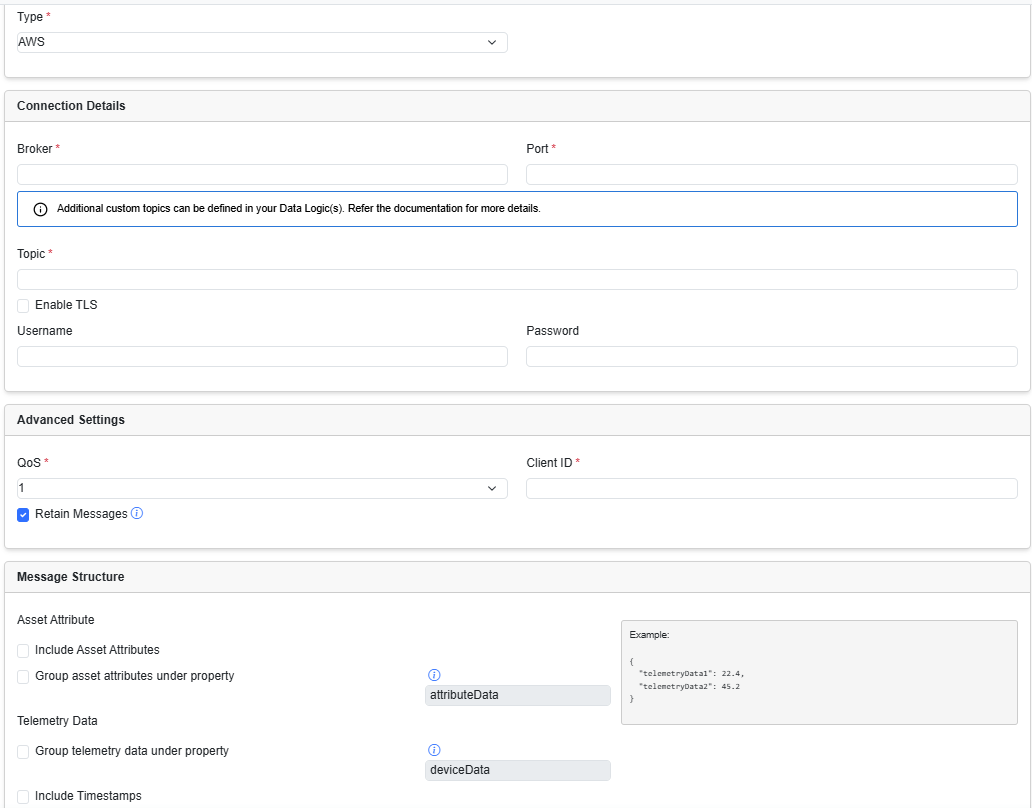
|
||||||||||||||||||||||||||||||
About Data Policies
Data Policies define how data is sent from edge assets to a destination. There are two types of policies:
-
Data Rule: Data is sent from Assets to a destination without transformation.
-
Data Logic: Data is transformed before being sent to a destination. Data Logic scripts are developed using Microsoft VS Code and embedded UI editor.
Restriction |
Make sure to configure Data Logic when you have configured multiple Source type. Proceeding only with Data Rule, will pop-up an error while deployment. |
Create a Data Logic
Data logic is used to transform data from connected assets before it is delivered to a destination. Unlike Data Rules that send all the raw data for an Asset Type, Data Logic allows you to aggregate or average data, send only data that exceeds certain value, detect anomalies, and more.
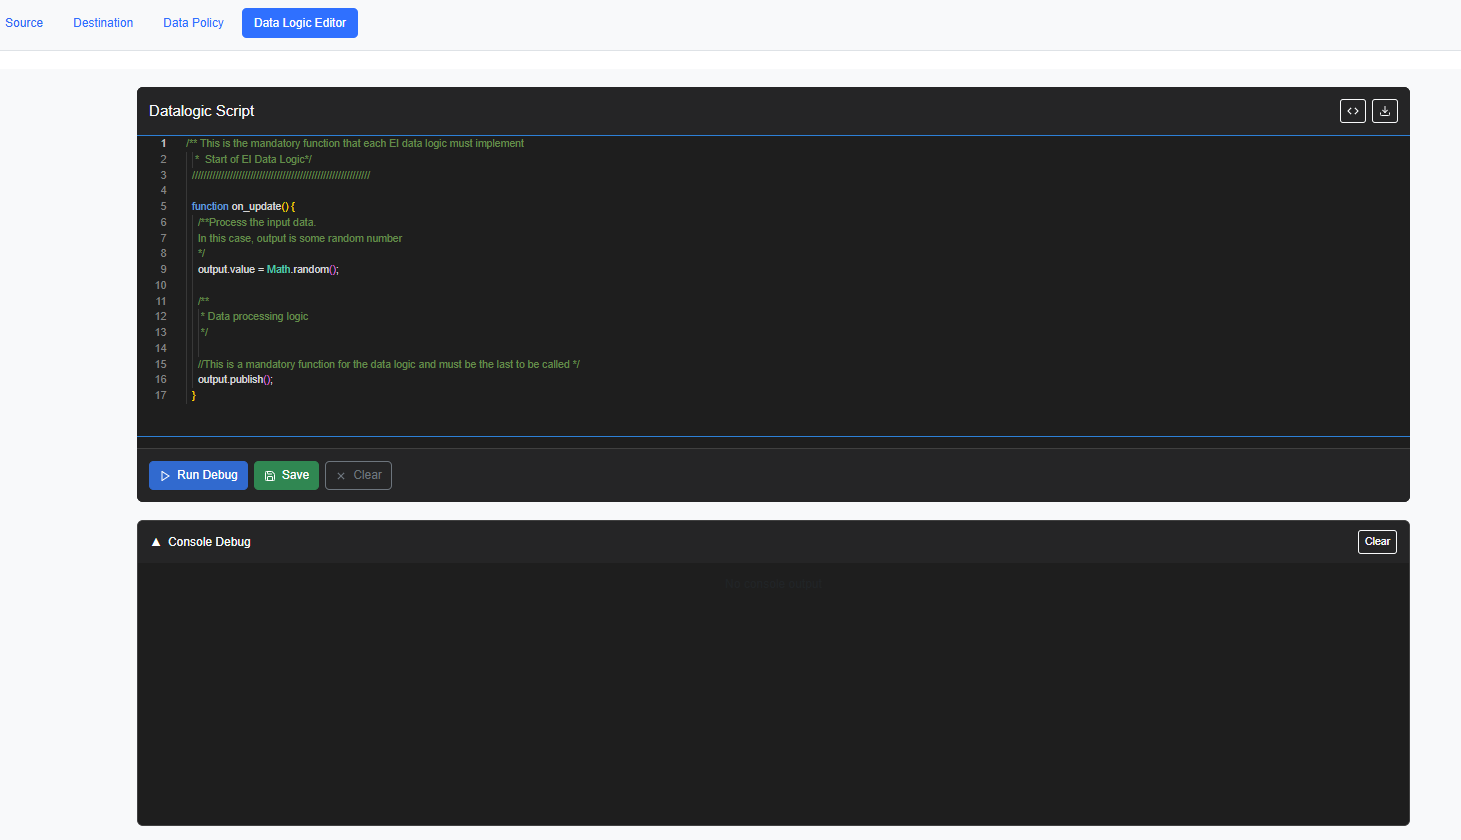
Data Logic is developed and debugged using JavaScript in Microsoft Visual Studio (VS Code) and embedded UI editor. Scripts are synchronized to Cisco IoT where they can be deployed to EI Agents running on Edge Devices.
Procedure
|
Step 1 |
From the Data Policy tab, select Data Logic checkbox. 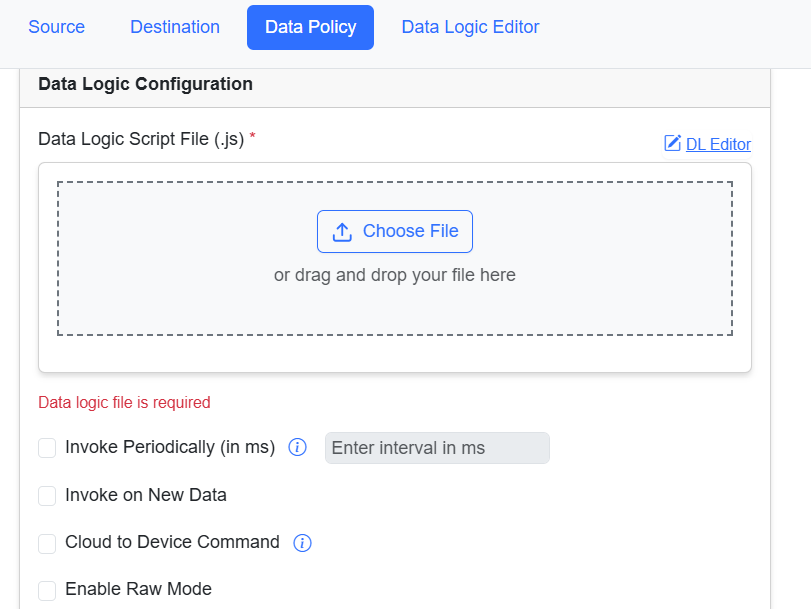
|
||
|
Step 2 |
To add a data logic script, click Choose File to select precreated new script (example: LogicExample.js) from your local drive. |
||
|
Step 3 |
To review or to create a new data logic script, click DL Editor.
 |
||
|
Step 4 |
After you upload a script file, the new download and delete icon appears. It helps to check/validate what uploaded from other agents. Another user can also check an existing pipeline and can download it. |
||
|
Step 5 |
From the following run-time options, select when the script will be run.
|
Create a Data Rule
Data rules define the flow of data, from connected assets to data destinations, without transformation.
Procedure
|
Step 1 |
From the Data Policy tab, select Data Rule checkbox. |
|
Step 2 |
To configure the Data Rule, select a data from Data Sampling Inerval (ms) drop-down list. 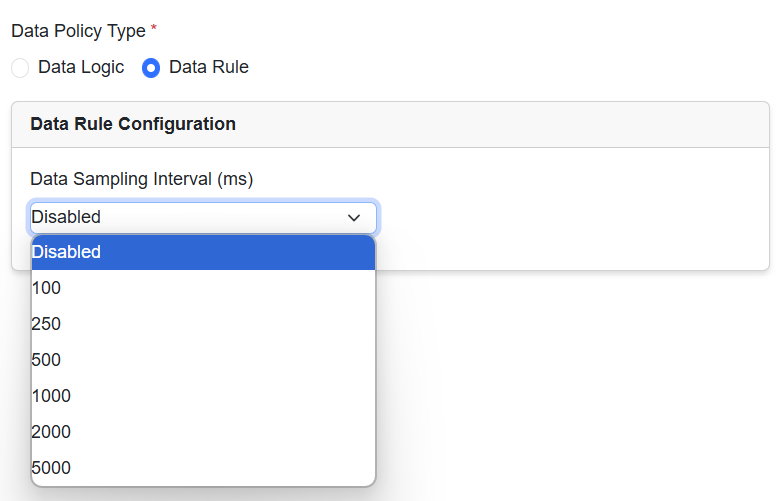 |
Deploy or undeploy pipelines
When deployed, a pipeline runs on the Cisco network device where the EI agent is installed.
Procedure
|
Step 1 |
To deploy a pipeline:
The deployed pipeline is listed in the Pipelines area of the Cisco Edge Intelligence page. |
|
Step 2 |
To undeploy a pipeline, in the Pipeline section, select a pipeline and click Undeploy. When you undeploy a pipeline, it is entirely removed from Cisco Edge Intelligence. If you wish to retain a copy of the configuration, save the pipeline configuration as a template before you undeploy the pipeline. |
View health status
To track the health status of an EI agent, select a pipeline from the list of pipelines.
Procedure
|
Step 1 |
From the left pane, click any Pipeline which you want to view the details. |
||||||||||
|
Step 2 |
Click Health Status tab. A combined list log of pipeline overview, source status, and destination status appears for the EI agent. |
||||||||||
|
Step 3 |
Click on any status tab to preview each log report.
|
 Feedback