The documentation set for this product strives to use bias-free language. For the purposes of this documentation set, bias-free is defined as language that does not imply discrimination based on age, disability, gender, racial identity, ethnic identity, sexual orientation, socioeconomic status, and intersectionality. Exceptions may be present in the documentation due to language that is hardcoded in the user interfaces of the product software, language used based on RFP documentation, or language that is used by a referenced third-party product. Learn more about how Cisco is using Inclusive Language.
The NetFlow Layer 2 and Security Monitoring Exports feature improves your ability to detect and analyze network threats such
as denial of service (DoS) attacks by increasing the number of fields from which NetFlow can capture relevant data.
NetFlow is a Cisco IOS technology that provides statistics on packets flowing through a router. NetFlow is the standard for
acquiring IP operational data from IP networks. NetFlow provides network and security monitoring, network planning, traffic
analysis, and IP accounting.
Finding Feature Information
Your software release may not support all the features documented in this module. For the latest caveats and feature information,
see Bug Search Tool and the release notes for your platform and software release. To find information about the features documented in this module,
and to see a list of the releases in which each feature is supported, see the feature information table.
Use Cisco Feature Navigator to find information about platform support and Cisco software
image support. To access Cisco Feature Navigator, go to https://cfnng.cisco.com/. An account on
Cisco.com is not required.
Prerequisites for NetFlow Layer 2 and Security Monitoring Exports
Before you configure NetFlow Layer 2 and Security Monitoring Exports, you should understand NetFlow accounting and know how
to configure your router to capture IP traffic accounting statistics using NetFlow. See the “Cisco IOS NetFlow Overview” and “Configuring NetFlow and NetFlow Data Export” modules for more details.
NetFlow and Cisco Express Forwarding (formerly known as CEF), distributed Cisco Express Forwarding (formerly known as dCEF),
or fast switching must be configured on your system.
If you want to export the data captured with the NetFlow Layer 2 and Security Monitoring feature, you must configure NetFlow
to use the NetFlow Version 9 data export format.
Information About NetFlow Layer 2 and Security Monitoring Exports
NetFlow Layer 2 and Security Monitoring
The Layer 2 and Layer 3 fields supported by the NetFlow Layer 2 and Security Monitoring Exports feature increase the amount
of information that can be obtained by NetFlow about the traffic in your network. You can use the network traffic information
for applications such as traffic engineering and usage-based billing.
Layer 3 fields captured by the NetFlow Layer 2 and Security Monitoring Exports feature improve the capabilities of NetFlow
for identifying DoS attacks. Layer 2 IP header fields help identify the path that the DoS attack is taking through the network.
Layer 2 and Layer 3 fields are not key fields. They provide additional information about the traffic in an existing flow.
Changes in the values of NetFlow key fields, such as the source IP address, from one packet to the next packet results in
the creation of a new flow. For example, if the first packet captured by NetFlow has a source IP address of 10.34.0.2 and
the second packet captured has a source IP address of 172.16.213.65, NetFlow will create two separate flows.
Most DoS attacks consist of an attacker sending the same type of IP datagram repeatedly, in an attempt to overwhelm target
systems. In such cases, the incoming traffic often has similar characteristics, such as the same values in each datagram for
one or more fields that the NetFlow Layer 2 and Security Monitoring Exports feature can capture.
The originator of DoS attacks cannot be easily identified because the IP source address of the device sending the traffic
is usually forged. However, you can easily trace the traffic back through the network to the router on which it is arriving
by using the NetFlow Layer 2 and Security Monitoring Exports feature to capture the MAC address and VLAN-ID fields. If the
router on which traffic is arriving supports NetFlow, you can configure the NetFlow Layer 2 and Security Monitoring Exports
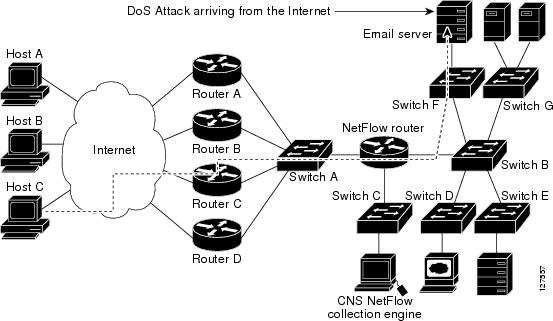
feature on it to identify the interface on which the traffic is arriving. The figure below shows an example of an attack in
progress.
Figure 1. DoS Attack Arriving over the Internet
Note
You can analyze the data captured by NetFlow directly from the router by using the
showipcacheverboseflow command or by the Cisco Network Services (CNS) NetFlow Collector Engine.
Once you have concluded that a DoS attack is taking place by analyzing the Layer 3 fields in the NetFlow flows, you can analyze
the Layer 2 fields in the flows to discover the path that the DoS attack is taking through the network.
An analysis of the data captured by the NetFlow Layer 2 and Security Monitoring Exports feature, for the scenario shown in
the above figure, indicates that the DoS attack is arriving on Router C, because the upstream MAC address is from the interface
that connects Router C to Switch A. It is also evident that there are no routers between the target host (the e-mail server)
and the NetFlow router, because the destination MAC address of the DoS traffic that the NetFlow router is forwarding to the
e-mail server is the MAC address of the e-mail server.
You can learn the MAC address that Host C is using to send traffic to Router C by configuring the NetFlow Layer 2 and Security
Monitoring Exports feature on Router C. The source MAC address will be from Host C. The destination MAC address will be for
the interface on the NetFlow router.
Once you know the MAC address that Host C is using and the interface on Router C on which Host C’s DoS attack is arriving,
you can mitigate the attack by reconfiguring Router C to block Host C’s traffic. If Host C is on a dedicated interface, you
can disable the interface. If Host C is using an interface that carries traffic from other users, you must configure your
firewall to block Host C’s traffic, but still allow the traffic from the other users to flow through Router C.
Layer 2 Information Capture Using NetFlow Layer 2 and Security Monitoring Exports
The NetFlow Layer 2 and Security Monitoring Exports feature can capture the values of the MAC address and VLAN ID fields
from flows. The two supported VLAN types are 802.1q and the Cisco Inter-Switch Link (ISL) protocol.
Layer 2 MAC Address Fields
The Layer 2 fields for which the NetFlow Layer 2 and Security Monitoring Exports feature captures the values are as follows:
The source MAC address field from frames that are received by the NetFlow router.
The destination MAC address field from frames that are transmitted by the NetFlow router.
The VLAN ID field from frames that are received by the NetFlow router.
The VLAN ID field from frames that are transmitted by the NetFlow router.
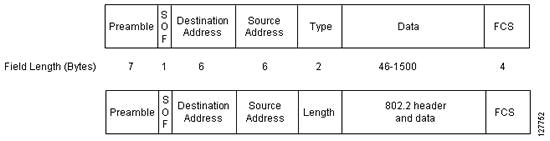
Figure 2 shows the Ethernet Type II and Ethernet 802.3 frame formats. The destination address field and the source address
field in the frame formats are the MAC address values that are captured by NetFlow.
Figure 2. Ethernet Type II and 802.3 Frame Formats
Table 1 explains the fields for the Ethernet frame formats.
Table 1. Ethernet Type II and 802.3 Frame Fields
Field
Description
Preamble
The entry in the Preamble field is an alternating pattern of 0s and 1s that communicates to receiving stations about an incoming
frame. It also provides a means for the receiving stations to synchronize their clocks with the incoming bit stream.
SOF (Start of frame)
The SOF field holds an alternating pattern of 0s and 1s, ending with two consecutive 1s, indicating that the next bit is
the first bit of the first byte of the destination MAC address.
Destination Address
The 48-bit destination address identifies which station on the LAN should receive the frame. The first two bits of the destination
MAC address are reserved for the following special functions:
The first bit in the destination address field indicates whether the address is an individual address (0) or a group address
(1).
The second bit indicates whether the destination address is globally administered (0) or locally administered (1).
The remaining 46 bits form a uniquely assigned value that identifies a single station, a defined group of stations, or all
stations on the network.
Source Address
The 48-bit source address identifies which station transmitted the frame. The source address is always an individual address,
and the leftmost bit in the Source Address field is always 0.
Type
or
Length
Type—In an Ethernet Type II frame, a part of the frame is used for the Type field. The Type field is used to identify the
next layer protocol in the frame.
Length—In an 802.3 Ethernet frame, a part of the frame is used for the Length field. The Length field is used to indicate
the length of the Ethernet frame. The value can be from 46 to 1500 bytes.
Data
or
802.2 header and data
Ethernet Type II—46 to 1500 bytes of data
or
802.3/802.2—8 bytes of header and 38 to 1492 bytes of data.
FCS (Frame Check Sequence)
This field contains a 32-bit cyclic redundancy check (CRC) value, which is created by the sending station and is recalculated
by the receiving station, to check for damaged frames. The FCS is generated for the destination address, source address, Type,
and Data fields of the frame. The FCS does not include the data portion of the frame.
Layer 2 VLAN ID Fields
NetFlow can capture the value in the VLAN ID field for 802.1q tagged VLANs and Cisco ISL encapsulated VLANs. This section
describes the two types of VLANs, 802.1q and ISL.
Note
ISL and 802.1q are commonly called VLAN encapsulation protocols.
Understanding 802.1q VLANs
Devices that use 802.1q insert a four-byte tag into the original frame before it is transmitted. Figure 3 shows the format
of an 802.1q tagged Ethernet frame.
Figure 3. 802.1q Tagged Ethernet Type II or 802.3 Frame
Table 2 describes the fields for 802.1q VLANs.
Table 2. 802.1q VLAN Encapsulation Fields
Field
Description
Destination Address
The 48-bit destination address identifies which stations on the LAN should receive the frame. The first two bits of the destination
MAC address are reserved for the following special functions:
The first bit in the destination address field indicates whether the address is an individual address (0) or a group address
(1).
The second bit indicates whether the destination address is globally administered (0) or locally administered (1).
The remaining 46 bits form a uniquely assigned value that identifies a single station, a defined group of stations, or all
stations on the network.
Source Address
The 48-bit source address identifies which station transmitted the frame. The source address is always an individual address,
and the leftmost bit in the Source Address field is always 0.
Type
or
Length
Type—In an Ethernet Type II frame, a part of the frame is used for the Type field. The Type field is used to identify the
next layer protocol in the frame.
Length—In an 802.3 Ethernet frame, a part of the frame is used for the Length field. The Length field is used to indicate
the length of the Ethernet frame. The value can be from 46 to 1500 bytes.
Data
or
802.2 header and data
Ethernet Type II—46 to 1500 bytes of data
or
802.3/802.2—8 bytes of header and 38 to 1492 bytes of data.
FCS (Frame Check Sequence)
This field contains a 32-bit cyclic redundancy check (CRC) value, which is created by the sending station and is recalculated
by the receiving station, to check for damaged frames. The FCS is generated for the destination address, source address, Type,
and Data fields of the frame. The FCS does not include the data portion of the frame.
Tag Protocol ID (TPID)
This 16-bit field is set to a value of 0x8100 to identify the frame as an IEEE 802.1q tagged frame.
Priority
This 3-bit field refers to the 802.1p priority. It is also known as user priority. It indicates the frame priority level
used for prioritizing traffic and can represent levels 0–7.
Tag Control Information
This 2-byte Tag Control Information field consists of the following two subfields:
Canonical Format Indentifier (CFI)—If the value of this 1-bit field is 1, the MAC address is in noncanonical format. If the
value of this field is 0, the MAC address is in canonical format.
VLAN ID—This 12-bit field uniquely identifies the VLAN to which the frame belongs. It can have a value from 0 to 4095.
Cisco ISL VLANs
ISL is a Cisco-proprietary protocol for encapsulating frames on a VLAN trunk. Devices that use ISL add an ISL header to the
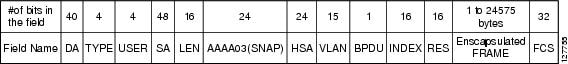
frame. This process is known as VLAN encapsulation. 802.1Q is the IEEE standard for tagging frames on a VLAN trunk. Figure
4 shows the format of a Cisco ISL-encapsulated Ethernet frame.
Figure 4. Cisco ISL Tagged Ethernet Frame
Table 3 describes the fields for 802.1q VLANs.
Table 3. ISL VLAN Encapsulation
Field
Description
DA (destination address)
This 40-bit field is a multicast address and is set at 0n01-00-0c-00-00 or 0n03-00-0c-00-00. The receiving host determines that the frame is encapsulated in ISL by reading the 40-bit DA field and matching
it with one of the two ISL multicast addresses.
TYPE
This 4-bit field indicates the type of frame that is encapsulated and to indicate alternative encapsulations.
TYPE codes:
0000—Ethernet
0001—Token Ring
0010—FDDI
0011—ATM
USER
This 4-bit field is used to extend the meaning of the Frame TYPE field. The default USER field value is 0000. For Ethernet
frames, the USER field bits 0 and 1 indicate the priority of the packet as it passes through the switch. Whenever traffic
can be handled more quickly, the packets with this bit set should take advantage of the quicker path. However, such paths
are not required.
USER codes:
xx00—Normal priority
xx01—Priority 1
xx10—Priority 2
xx11—Highest priority
SA
This 48-bit field is the source address field of the ISL packet. It should be set to the 802.3 MAC address of the switch
port transmitting the frame. The receiving device can ignore the SA field of the frame.
LEN
This 16-bit value field stores the actual packet size of the original packet. The LEN field represents the length of the
packet in bytes, excluding the DA, TYPE, USER, SA, LEN, and FCS fields. The total length of the excluded fields is 18 bytes,
so the LEN field represents the total length minus 18 bytes.
AAAA03(SNAP)
The AAAA03 Subnetwork Access Protocol (SNAP) field is a 24-bit constant value of 0xAAAA03.
HSA
This 24-bit field represents the upper three bytes (the manufacturer’s ID portion) of the SA field. It must contain the value
0x00-00-0C.
VLAN
This 15-bit field is the virtual LAN ID of the packet. This value is used to mark frames on different VLANs.
BPDU
The bit in the bridge protocol data unit (BPDU) field is set for all BPDU packets that are encapsulated by the ISL frame.
The BPDUs are used by the spanning tree algorithm to learn information about the topology of the network. This bit is also
set for Cisco Discovery Protocol and VLAN Trunk Protocol (VTP) frames that are encapsulated.
INDEX
This 16-bit field indicates the port index of the source of the packet as it exits the switch. It is used for diagnostic
purposes only, and may be set to any value by other devices. It is ignored in received packets.
RES
This 16-bit field is used when Token Ring or FDDI packets are encapsulated with an ISL frame.
Encapsulated FRAME
This field contains the encapsulated Layer 2 frame.
FCS
The FCS field consists of 4 bytes. It includes a 32-bit CRC value, which is created by the sending station and is recalculated
by the receiving station, to check for damaged frames. The FCS covers the DA, SA, Length/Type, and Data fields. When an ISL
header is attached to a Layer 2 frame, a new FCS is calculated over the entire ISL packet and added to the end of the frame.
Note
The addition of the new FCS does not alter the original FCS that is contained within the encapsulated frame.
Layer 3 Information Capture Using NetFlow Layer 2 and Security Monitoring Exports
The five fields that the NetFlow Layer 2 and Security Monitoring Exports feature captures from Layer 3 IP traffic in a flow
are the following:
Internet Control Message Protocol (ICMP) type and code
ID field
Fragment offset
Packet length field
Time-to-live field
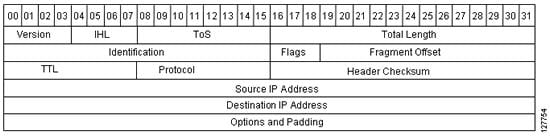
Figure 5 shows the fields in an IP packet header.
Figure 5. IP Packet Header Fields
Table 4 describes the header fields in Figure 5.
Table 4. IP Packet Header Fields
Field
Description
Version
The version of the IP protocol. If this field is set to 4, it is an IPv4 datagram. If this field is set to 6, it is an IPv6
datagram.
Note
IPv4 and IPv6 headers have different structures.
IHL (Internet Header Length)
Internet Header Length is the length of the Internet header in 32-bit word format and thus points to the beginning of the
data.
Note
The minimum value for the correct header length is 5.
ToS
Type of service (ToS) provides an indication of the abstract parameters of the quality of service desired. These parameters
are to be used to guide the selection of the actual service parameters when a networking device transmits a datagram through
a particular network.
Total Length
Total length is the length of the datagram, measured in octets, including Internet header and data.
Identification (ID)
The value in the ID field is entered by the sender. All the fragments of an IP datagram have the same value in the ID field.
Subsequent IP datagrams from the same sender will have different values in the ID field.
Frequently, a host receives fragmented IP datagrams from several senders concurrently. Also, frequently a host receives multiple
IP datagrams from the same sender concurrently.
The value in the ID field is used by the destination host to ensure that the fragments of an IP datagram are assigned to
the same packet buffer during the IP datagram reassembly process. The unique value in the ID field is used to prevent the
receiving host from mixing together IP datagram fragments of different IP datagrams from the same sender during the IP datagram
reassembly process.
Flags
A sequence of three bits is used to set and track IP datagram fragmentation parameters. The bits are:
001—The IP datagram can be fragmented. More fragments of the current IP datagram are in transit.
000—The IP datagram can be fragmented. This is the last fragment of the current IP datagram.
010—The IP datagram cannot be fragmented. This is the entire IP datagram.
Fragment Offset
This field indicates where in the datagram this fragment belongs.
TTL (Time-to-Live)
This field indicates the maximum time the datagram is allowed to remain in the Internet system. If this field contains the
value 0, then the datagram must be destroyed. This field is modified in Internet header processing. The TTL is measured in
units of seconds, but because every module that processes a datagram must decrease the TTL by at least 1 even if it processes
the datagram in less than a second, the TTL must be thought of only as an upper bound on the time a datagram can exist. The
intention is to discard undeliverable datagrams and bound the maximum datagram lifetime.
Protocol
Indicates the type of transport packet included in the data portion of the IP datagram. Common values are:
1—ICMP
6—TCP
17—UDP
Header checksum
A checksum on the header only. Because some header fields, such as the TTL field, change every time an IP datagram is forwarded,
this value is recomputed and verified at each point that the Internet header is processed.
Source IP Address
IP address of the sending station.
Destination IP Address
IP address of the destination station.
Options and Padding
The options and padding may appear in datagrams. If they do appear, they must be implemented by all IP modules (host and
gateways). Options and padding are always implemented in any particular datagram; transmissions are not.
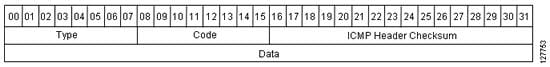
Figure 6 shows the fields in an ICMP datagram.
Figure 6. ICMP Datagram
Table 5 interprets the packet format in the figure seen above. ICMP datagrams are carried in the data area of an IP datagram,
after the IP header.
Table 5. ICMP Packet Format
Type
Name
Codes
0
Echo reply
0—None.
1
Unassigned
—
2
Unassigned
—
3
Destination unreachable
0—Network unreachable.
1—Host unreachable.
2—Protocol unreachable.
3—Port unreachable.
4—Fragmentation needed and don't fragment (DF) bit set.
5—Source route failed.
6—Destination network unknown.
7—Destination host unknown.
8—Source host isolated.
9—Communication with the destination network is administratively prohibited.
10—Communication with the destination host is administratively prohibited.
11—Destination network unreachable for ToS.
12—Destination host unreachable for ToS.
4
Source quench
0—None.
5
Redirect
0—None.
0—Redirect datagram for the network.
1—Redirect datagram for the host.
2—Redirect datagram for the ToS and network.
3—Redirect datagram for the ToS and host.
6
Alternate host address
0—Alternate address for the host.
7
Unassigned
—
8
Echo
0—None.
9
Router advertisement
0—None.
10
Router selection
0—None.
11
Time exceeded
0—Time to live exceeded in transit.
12
Parameter problem
0—Pointer indicates the error.
1—Missing a required option.
2—Inappropriate length.
13
Timestamp
0—None.
14
Timestamp reply
0—None.
15
Information request
0—None.
16
Information reply
0—None.
17
Address mask request
0—None.
18
Address mask reply
0—None.
19
Reserved (for security)
—
20–29
Reserved (for robustness experiment)
—
30
Trace route
—
31
Datagram conversion error
—
32
Mobile host redirect
—
33
IPv6 where-are-you
—
34
IPv6 I-am-here
—
35
Mobile registration request
—
36
Mobile registration reply
—
37–255
Reserved
—
NBAR Data Export
Network based application recognition (NBAR) is a classification engine that recognizes and classifies a wide variety of
protocols and applications, including web-based and other difficult-to-classify applications and protocols that use dynamic
TCP/UDP port assignments.
When NBAR recognizes and classifies a protocol or application, the network can be configured to apply the appropriate application
mapping with that protocol.
For a Catalyst 6500 series switch equipped with a Supervisor 32/programmable intelligent services accelerator (PISA), the
NBAR flow can be exported along with NetFlow export records.
The application-aware NetFlow feature integrates NBAR with NetFlow to provide the ability to export application information
collected by NBAR using NetFlow. The application IDs created for the NetFlow Version 9 attribute export application names
along with the standard attributes such as IP address and TCP/UDP port information. The NetFlow collector collects these flows
based on the source IP address and ID. The source ID refers to the unique identification for flows exported from a particular
device.
The NBAR data exported to the NetFlow collector contains application mapping information. Using the NetFlow Data export options,
the table containing the application IDs mapped to their application names is exported to the NetFlow collector. The mapping
table is sent using the
ipflow-exporttemplateoptionsnbar command. By default, the mapping information is refreshed every 30 minutes. You can configure the refresh interval by using
the
ipflow-exporttemplateoptionstimeout-rate command.
NetFlow export uses several aging mechanisms to manage the NetFlow cache. However, the NBAR data export intervals do not
use NetFlow aging parameters.
Benefits of NBAR NetFlow Integration
NBAR enables network administrators to track a variety of protocols and the amount of traffic generated by each protocol.
NBAR also allows network administrators to organize traffic into classes. These classes can then be used to provide different
levels of service for network traffic, thereby allowing better network management by providing the appropriate level of network
resources for network traffic.
How to Configure NetFlow Layer 2 and Security Monitoring Exports
Configuring NetFlow Layer 2 and Security Monitoring Exports
Before you begin
Cisco Express Forwarding (formerly known as CEF), distributed Cisco Express Forwarding (formerly known as dCEF), or fast
switching for IP must be configured on your system before you configure the NetFlow Layer 2 and Security Monitoring Exports
feature.
The task in the "Verifying NetFlow Layer 2 and Security Monitoring Exports" section uses the
showipcacheverboseflow command to display the values of the fields; the NetFlow Layer 2 and Security Monitoring Exports feature is configured to
capture the values of these fields. In order to display the values of the fields, your router must forward the IP traffic
that meets the criteria for these fields. For example, if you configure the
ipflow-captureip-id command, your router must be forwarding IP datagrams to capture the IP ID values from the IP datagrams in the flow.
Depending on the release that your router supports, you can capture the values of the Layer 3 IP fragment offset field from
the IP headers in your IP traffic using the
ipflow-capturefragment-offset command.
SUMMARY STEPS
enable
configureterminal
ipflow-capturefragment-offset
ipflow-captureicmp
ipflow-captureip-id
ipflow-capturemac-addresses
ipflow-capturepacket-length
ipflow-capturettl
ipflow-capturevlan-id
interfacetype [number |
slot/port]
Enter one of the following commands:
ipflowingress
ipflowegress
exit
DETAILED STEPS
Command or Action
Purpose
Step 1
enable
Example:
Device> enable
Enables privileged EXEC mode.
Enter your password if prompted.
Step 2
configureterminal
Example:
Device# configure terminal
Enters global configuration mode.
Step 3
ipflow-capturefragment-offset
Example:
Device(config)# ip flow-capture fragment-offset
(Optional) Enables the software to capture the value of the IP fragment offset field from the first fragmented IP datagram
in a flow.
Step 4
ipflow-captureicmp
Example:
Device(config)# ip flow-capture icmp
(Optional) Enables the software to capture the value of the ICMP type and code fields from ICMP datagrams in a flow.
Step 5
ipflow-captureip-id
Example:
Device(config)# ip flow-capture ip-id
(Optional) Enables the software to capture the value of the IP ID field from the first IP datagram in a flow.
Step 6
ipflow-capturemac-addresses
Example:
Device(config)# ip flow-capture mac-addresses
(Optional) Enables the software to capture the values of the source and destination MAC addresses from the traffic in a flow.
Step 7
ipflow-capturepacket-length
Example:
Device(config)# ip flow-capture packet-length
(Optional) Enables the software to capture the minimum and maximum values of the packet length field from IP datagrams in
a flow.
Step 8
ipflow-capturettl
Example:
Device(config)# ip flow-capture ttl
(Optional) Enables the software to capture the minimum and maximum values of the time-to-live (TTL) field from IP datagrams
in a flow.
Step 9
ipflow-capturevlan-id
Example:
Device(config)# ip flow-capture vlan-id
(Optional) Enables the software to capture the 802.1q or ISL VLAN-ID field from VLAN encapsulated frames in a flow that is
received or transmitted on trunk ports.
Step 10
interfacetype [number |
slot/port]
Example:
Device(config)# interface ethernet 0/0
Enters interface configuration mode for the type of interface specified in the command.
Step 11
Enter one of the following commands:
ipflowingress
ipflowegress
Example:
Device(config-if)# ip flow ingress
or
Device(config-if)# ip flow egress
Enables ingress NetFlow data collection on the interface.
or
Enables egress NetFlow data collection on the interface.
Step 12
exit
Example:
Device(config-if)# exit
Exits interface configuration mode.
Verifying NetFlow Layer 2 and Security Monitoring Exports
Perform this task to verify the configuration of NetFlow Layer 2 and Security Monitoring Exports.
Restrictions
The Verifying NetFlow Layer 2 and Security Monitoring Exports task uses the
showipcacheverboseflow command. The following restrictions apply to using the
showipcacheverboseflow command.
Displaying Detailed NetFlow Cache Information on Platforms Running Distributed Cisco Express Forwarding
On platforms running distributed Cisco Express Forwarding (formerly known as dCEF), NetFlow cache information is maintained
on each line card or Versatile Interface Processor (VIP). If you want to use the
showipcacheverboseflow command to display this information on a distributed platform, you must enter the command at a line card prompt.
Cisco 7500 Series Platform
To display detailed NetFlow cache information on a Cisco 7500 series router that is running distributed Cisco Express Forwarding
(formerly known as dCEF), enter the following sequence of commands:
Device# if-con

slot-number
LC-
slot-number
# show ip cache verbose flow
Depending on your release, you can retrieve detailed NetFlow cache information. Enter the following command to display detailed
NetFlow cache information:
Device# execute-on
slot-number
show ip cache verbose flow
Cisco 12000 Series Platform
To display detailed NetFlow cache information on a Cisco 12000 series router, enter the following sequence of commands:
Device# attach
slot-number
LC-
slot-number
# show ip cache verbose flow
Depending on your release, you can retrieve detailed NetFlow cache information. Enter the following command to display detailed
NetFlow cache information:
Device# execute-onslot-numbershow ip cache verbose flow
The following sample output shows values from the Layer 2 and Layer 3 fields in the flows captured by the NetFlow Layer 2
and Security Monitoring Exports feature.
Device# show ip cache verbose flow

IP packet size distribution (25229 total packets):
   1-32   64   96  128  160  192  224  256  288  320  352  384  416  448  480
   .000 .000 .000 .000 .000 .000 .000 .000 .000 .000 .000 .000 .000 .000 .000
    512  544  576 1024 1536 2048 2560 3072 3584 4096 4608
   .000 .000 .000 .206 .793 .000 .000 .000 .000 .000 .000
IP Flow Switching Cache, 278544 bytes
  6 active, 4090 inactive, 17 added
  505 ager polls, 0 flow alloc failures
  Active flows timeout in 1 minutes
  Inactive flows timeout in 10 seconds
IP Sub Flow Cache, 25736 bytes
  12 active, 1012 inactive, 39 added, 17 added to flow
  0 alloc failures, 0 force free
  1 chunk, 1 chunk added
  last clearing of statistics never
Protocol         Total    Flows   Packets Bytes  Packets Active(Sec) Idle(Sec)
--------         Flows     /Sec     /Flow  /Pkt     /Sec     /Flow     /Flow
TCP-Telnet           1      0.0       362   940      2.7      60.2       0.0
TCP-FTP              1      0.0       362   840      2.7      60.2       0.0
TCP-FTPD             1      0.0       362   840      2.7      60.1       0.1
TCP-SMTP             1      0.0       361  1040      2.7      60.0       0.1
UDP-other            5      0.0         1    66      0.0       1.0      10.6
ICMP                 2      0.0      8829  1378    135.8      60.7       0.0
Total:              11      0.0      1737  1343    147.0      33.4       4.8
SrcIf          SrcIPaddress    DstIf          DstIPaddress    Pr TOS Flgs  Pkts
Port Msk AS                    Port Msk AS    NextHop              B/Pk  Active
Et0/0.1        10.251.138.218  Et1/0.1        172.16.10.2     06 80  00      65
0015 /0  0                     0015 /0  0     10.0.0.0               840    10.8
MAC: (VLAN id) aaaa.bbbb.cc03  (005)          aaaa.bbbb.cc06  (006)
Min plen:      840                            Max plen:       840
Min TTL:        59                            Max TTL:         59
IP id:           0
Configuring NBAR Support for NetFlow Exports
Perform this task to export NBAR data to the Cisco NetFlow Collector Software.
Before you begin
You must enable NetFlow Version 9 and NBAR before you configure NBAR data export.
You must add and configure the following fields to the Cisco NetFlow Collector Software to identify the flow exported by
the NBAR data export feature:
app_id field as an integer with Numeric ID of 95.
app_name field as a UTF-8 String with Numeric ID of 96.
sub_app_id field as an integer with Numeric ID of 97.
biflowDirection field as an integer with Numeric ID of 239.
Note
The biflowDirection field provides information about the host that initiates the session. The size of this field is one byte.
RFC 5103 provides details for using this field.
Note
NBAR support can be configured only with the NetFlow Version 9 format. If you try to configure NBAR data export with other
versions, the following error message appears:
1d00h: %FLOW : Export version 9 not enabled
NBAR data export does not use NetFlow aging parameters.
SUMMARY STEPS
enable
configureterminal
ipflow-exportversion9
ipflow-capturenbar
ipflow-exporttemplateoptionsnbar
exit
showipflowexportnbar
clearipflowstatsnbar
DETAILED STEPS
Command or Action
Purpose
Step 1
enable
Example:
Router> enable
Enables privileged EXEC mode.
Enter your password if prompted.
Step 2
configureterminal
Example:
Router# configure terminal
Enters global configuration mode.
Step 3
ipflow-exportversion9
Example:
Router(config)# ip flow-capture version 9
Enables the Version 9 format to export NetFlow cache entries.
Step 4
ipflow-capturenbar
Example:
Router(config)# ip flow-capture nbar
Enables you to capture the NBAR data in NetFlow export records.
Step 5
ipflow-exporttemplateoptionsnbar
Example:
Router(config)# ip flow-export template options nbar
Exports application mapping information to the Cisco NetFlow Collector Software.
Step 6
exit
Example:
Router(config)# exit
Exits global configuration mode.
Step 7
showipflowexportnbar
Example:
Router# show ip flow export nbar
(Optional) Displays NBAR export records.
Step 8
clearipflowstatsnbar
Example:
Router# clear ip flow stats nbar
(Optional) Clears NetFlow accounting statistics for NBAR.
Configuration Examples for NetFlow Layer 2 and Security Monitoring Exports
Example: Configuring NetFlow Layer 2 and Security Monitoring Exports
The following example shows how to configure the NetFlow Layer 2 and Security Monitoring Exports feature:
Router> enable
Router# configure terminal
Router(config)# ip flow-capture fragment-offset
Router(config)# ip flow-capture icmp
Router(config)# ip flow-capture ip-id
Router(config)# ip flow-capture mac-addresses
Router(config)# ip flow-capture packet-length
Router(config)# ip flow-capture ttl
Router(config)# ip flow-capture vlan-id
Router(config)# interfaceethernet 0/0
Router(config-if)# ip flow ingress
or
Router(config-if)# ip flow egress
Router(config-if)# exit
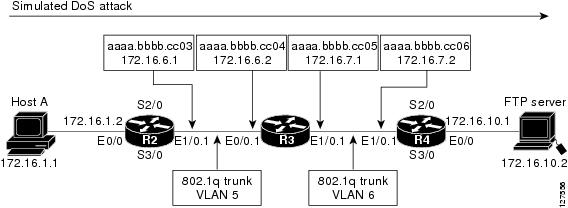
Example: Analyzing a Simulated FTP Attack
The following example shows how to use the NetFlow Layer 2 and Security Monitoring Exports feature to find out whether your
network is being attacked by a host that is sending fake FTP traffic in an attempt to overwhelm the FTP server. This attack
might cause end users to see a degradation in the ability of the FTP server to accept new connections or to service existing
connections.
Figure 7 shows a network in which Host A is sending fake FTP packets to the FTP server.
This example also shows you how to use the Layer 2 data, captured by the NetFlow Layer 2 and Security Monitoring Exports
feature, to learn where the traffic is originating and what path it is taking through the network.
Figure 7. Test Network
Tip
Track the MAC addresses and IP addresses of the devices in your network. You can use them to analyze attacks and resolve
problems.
Note
This example does not include the
ipflow-captureicmp command, which captures the value of the ICMP type and code fields.
R2
!
hostname R2
!
interface Ethernet0/0
 mac-address aaaa.bbbb.cc02
 ip address 172.16.1.2 255.255.255.0
!
interface Ethernet1/0
 mac-address aaaa.bbbb.cc03
 no ip address
!
interface Ethernet1/0.1
 encapsulation dot1Q 5
 ip address 172.16.6.1 255.255.255.0
!
!
router rip
 version 2
 network 172.16.0.0
 no auto-summary
!
R3
!
hostname R3
!
ip flow-capture fragment-offset
ip flow-capture packet-length
ip flow-capture ttl
ip flow-capture vlan-id
ip flow-capture ip-id
ip flow-capture mac-addresses
!
interface Ethernet0/0
 mac-address aaaa.bbbb.cc04
 no ip address
!
interface Ethernet0/0.1
 encapsulation dot1Q 5
 ip address 172.16.6.2 255.255.255.0
 ip accounting output-packets
 ip flow ingress
!
interface Ethernet1/0
 mac-address aaaa.bbbb.cc05
 no ip address
!
interface Ethernet1/0.1
 encapsulation dot1Q 6
 ip address 172.16.7.1 255.255.255.0
 ip accounting output-packets
 ip flow egress
!
router rip
 version 2
 network 172.16.0.0
 no auto-summary
!
R4
!
hostname R4
!
interface Ethernet0/0
 mac-address aaaa.bbbb.cc07
 ip address 172.16.10.1 255.255.255.0
!
interface Ethernet1/0
 mac-address aaaa.bbbb.cc06
 no ip address
!
interface Ethernet1/0.1
 encapsulation dot1Q 6
 ip address 172.16.7.2 255.255.255.0
!
router rip
 version 2
 network 172.16.0.0
 no auto-summary
!
The
showipcacheverboseflow command displays the NetFlow flows that have been captured from the FTP traffic that Host A is sending.
The fields that have values captured by the
ipflow-capture command are shown in Table 6. The fields and values are used to analyze the traffic for this example. The other fields captured
by the
showipcacheverboseflow command are explained in subsequent tables (Table 7 to Table 9).
The preceding output shows the percentage distribution of packets by size. In this display, 99.5 percent of the packets fall
in the 1024-byte size range, and 0.3 percent fall in the 64-byte range.
The rest of the output of the
showipcacheverboseflow command is as follows:
IP Flow Switching Cache, 278544 bytes
  5 active, 4091 inactive, 25 added
  719 ager polls, 0 flow alloc failures
  Active flows timeout in 1 minutes
  Inactive flows timeout in 10 seconds
IP Sub Flow Cache, 25736 bytes
  10 active, 1014 inactive, 64 added, 25 added to flow
  0 alloc failures, 0 force free
  1 chunk, 1 chunk added
  last clearing of statistics never
Protocol         Total    Flows   Packets Bytes  Packets Active(Sec) Idle(Sec)
--------         Flows     /Sec     /Flow  /Pkt     /Sec     /Flow     /Flow
TCP-FTP              5      0.0       429   840      6.6      58.1       1.8
Total:               5      0.0       129   835      6.6      17.6       7.9
SrcIf          SrcIPaddress    DstIf          DstIPaddress    Pr TOS Flgs  Pkts
Port Msk AS                    Port Msk AS    NextHop              B/Pk  Active
Et0/0.1        10.132.221.111  Et1/0.1        172.16.10.2     06 80  00     198
0015 /0  0                     0015 /0  0     0.0.0.0               840    41.2
MAC: (VLAN id) aaaa.bbbb.cc03  (005)          aaaa.bbbb.cc06  (006)
Min plen:      840                            Max plen:       840
Min TTL:        59                            Max TTL:         59
IP id:           0
Et0/0.1        10.251.138.218  Et1/0.1        172.16.10.2     06 80  00     198
0015 /0  0                     0015 /0  0     0.0.0.0               840    41.2
MAC: (VLAN id) aaaa.bbbb.cc03  (005)          aaaa.bbbb.cc06  (006)
Min plen:      840                            Max plen:       840
Min TTL:        59                            Max TTL:         59
IP id:           0
Et0/0.1        10.10.12.1      Et1/0.1        172.16.10.2     06 80  00     203
0015 /0  0                     0015 /0  0     0.0.0.0               840    42.2
MAC: (VLAN id) aaaa.bbbb.cc03  (005)          aaaa.bbbb.cc06  (006)
Min plen:      840                            Max plen:       840
Min TTL:        59                            Max TTL:         59
IP id:           0
Et0/0.1        10.231.185.254  Et1/0.1        172.16.10.2     06 80  00     203
0015 /0  0                     0015 /0  0     0.0.0.0               840    42.2
MAC: (VLAN id) aaaa.bbbb.cc03  (005)          aaaa.bbbb.cc06  (006)
Min plen:      840                            Max plen:       840
Min TTL:        59                            Max TTL:         59
IP id:           0
Et0/0.1        10.71.200.138   Et1/0.1        172.16.10.2     06 80  00     203
0015 /0  0                     0015 /0  0     0.0.0.0               840    42.2
MAC: (VLAN id) aaaa.bbbb.cc03  (005)          aaaa.bbbb.cc06  (006)
Min plen:      840                            Max plen:       840
Min TTL:        59                            Max TTL:         59
IP id:           0
R3#
Table 6 describes the significant fields shown in the NetFlow cache section of the output.
Table 6. Field Descriptions in the NetFlow Cache Section of the Output
Field
Description
bytes
Number of bytes of memory used by the NetFlow cache.
active
Number of active flows in the NetFlow cache at the time this command was entered.
inactive
Number of flow buffers that are allocated in the NetFlow cache but that were not assigned to a specific flow at the time
this command was entered.
added
Number of flows created since the start of the summary period.
ager polls
Number of times the NetFlow code caused entries to expire (used by Cisco Customer Support Engineers (CSEs) for diagnostic
purposes).
flow alloc failures
Number of times the NetFlow code tried to allocate a flow but could not.
last clearing of statistics
The period of time that has passed since the
clearipflowstats command was last executed. The standard time output format of hours, minutes, and seconds (hh:mm:ss) is used for a period
of time less than 24 hours. This time output format changes to hours and days after the time exceeds 24 hours.
Table 7 describes the significant fields shown in the activity by the protocol section of the output.
Table 7. Field Descriptions in the Activity by Protocol Section of the Output
Field
Description
Protocol
IP protocol and the well-known port number. (Refer to
http://www.iana.org, Protocol Assignment Number Services, for the latest RFC values.)
Note
Only a small subset of all protocols is displayed.
Total Flows
Number of flows for this protocol since the last time statistics were cleared.
Flows/Sec
Average number of flows for this protocol per second, which is equal to the total flows divided by the number of seconds
for this summary period.
Packets/Flow
Average number of packets for the flows for this protocol, which is equal to the total packets for this protocol divided
by the number of flows for this protocol for this summary period.
Bytes/Pkt
Average number of bytes for the packets for this protocol, which is equal to the total bytes for this protocol divided by
the total number of packets for this protocol for this summary period.
Packets/Sec
Average number of packets for this protocol per second, which is equal to the total packets for this protocol divided by
the total number of seconds for this summary period.
Active(Sec)/Flow
Number of seconds between the first and the last packet of an expired flow divided by the number of total flows for this protocol,
for this summary period.
Idle(Sec)/Flow
Number of seconds observed from the last packet in each nonexpired flow for this protocol until the time at which the
showipcacheverboseflow command was entered divided by the total number of flows for this protocol, for this summary period.
Table 8 describes the significant fields in the NetFlow record section of the output.
Table 8. Field Descriptions in the NetFlow Record Section of the Output
Field
Description
SrcIf
Interface on which the packet was received.
Port Msk AS
Source port number (displayed in hexadecimal format), IP address mask, and autonomous system number. This is always set to
0 in Multiprotocol Label Switching (MPLS) flows.
SrcIPaddress
The source IP address of the traffic in the five flows. The traffic is using five different IP source addresses. They are:
10.132.221.111
10.251.138.218
10.10.12.1
10.231.185.254
10.71.200.138
DstIf
Interface from which the packet was sent.
Note
If an asterisk (*) immediately follows the DstIf field, the flow being shown is an egress flow.
Port Msk AS
Source port number (displayed in hexadecimal format), IP address mask, and autonomous system number. The value of this field
is always set to 0 in MPLS flows.
DstIPaddress
The destination IP address of the traffic.
Note
172.17.10.2 is the IP address of the FTP server.
NextHop
The Border Gateway Protocol (BGP) next-hop address. This is always set to 0 in MPLS flows.
Pr
IP protocol “well-known” port number, displayed in hexadecimal format. (Refer to
http://www.iana.org, Protocol Assignment Number Services, for the latest RFC values.)
ToS
Type of service, displayed in hexadecimal format.
B/Pk
Average number of bytes observed in the packets seen for this flow.
Flgs
TCP flag, shown in hexadecimal format. This value is the result of bitwise OR of the TCP flags from all packets in the flow.
Pkts
Number of packets in this flow.
Active
Time the flow has been active.
Table 9 describes the fields and values for the NetFlow Traffic Classification and Identification fields for the NetFlow
record lines section of the output.
Table 9. NetFlow Traffic Classification and Identification Fields in the NetFlow Record lines section of the Output
Field
Description
MAC
The source and destination MAC addresses from the traffic, read from left to right in the output.
The traffic is received from MAC address aaaa.bbbb.cc03.
Note
This MAC address is interface 1/0.1 on router R2.
The traffic is transmitted to MAC address aaaa.bbbb.cc06.
Note
This MAC address is interface 1/0.1 on router R4.
VLAN id
The source and destination VLAN IDs, read from left to right in the output.
The traffic is received from VLAN 5.
The traffic is transmitted to VLAN 6.
Min plen
The minimum packet length for packets captured in the five flows.
The current value is 840.
Max plen
The maximum packet length for packets captured in the five flows.
The current value is 840.
Min TTL
The minimum time to live (TTL) for packets captured in the five flows.
The current value is 59.
Max TTL
The maximum TTL for packets captured in the five flows.
The current value is 59.
IP ID
The IP identifier field for the traffic in the five flows.
The current value is 0.
The fact that the Layer 3 TTL, identifier, and packet length fields in the five flows have the same values indicates that
this traffic is a DoS attack. If this data had been captured from real traffic, the values would normally be different. The
fact that all five of these flows have a TTL value of 59 indicates that this traffic is originating from points that are at
the same distance from R3. Real user traffic would normally be arriving from different distances; therefore, the TTL values
would be different.
If this traffic is identified as a DoS attack (based on the data captured in the Layer 3 fields), you can use the Layer 2
information in the flows to identify the path the traffic is taking through the network. In this example, the traffic is being
sent to R3 on VLAN 5, by R2. You can demonstrate that R2 is transmitting the traffic over interface 1/0.1 because the source
MAC address (aaaa.bbbb.cc03) belongs to 1/0.1 on R2. You can identify that R3 is transmitting the traffic using VLAN 6 on
interface 1/0.1 to interface 1/0.1 on R4 because the destination MAC address (aaaa.bbbb.cc06) belongs to interface 1/0.1 on
R4.
You can use this information to mitigate this attack. One possible way to mitigate this attack is to configure an extended
IP access list that blocks FTP traffic from any host with a source address that is on the 10.0.0.0 network. Another possible
solution is to configure a default route for the 10.0.0.0 network that points to the null interface on the router.
Caution
Each of these solutions blocks traffic from legitimate hosts on the 10.0.0.0 network. Therefore these solutions should be
used only while you identify the point of origin of the attack and decide how to stop it.
Example: Analyzing a Simulated ICMP Ping Attack
The following example shows how to use the NetFlow Layer 2 and Security Monitoring Exports feature to learn that your network
is being attacked by ICMP traffic. It uses the network shown in Figure 7. Host A is sending very large ICMP ping packets to
the FTP server.
R2
!
hostname R2
!
interface Ethernet0/0
 mac-address aaaa.bbbb.cc02
 ip address 172.16.1.2 255.255.255.0
!
interface Ethernet1/0
 mac-address aaaa.bbbb.cc03
 no ip address
!
interface Ethernet1/0.1
 encapsulation dot1Q 5
 ip address 172.16.6.1 255.255.255.0
!
!
router rip
 version 2
 network 172.16.0.0
 no auto-summary
!
R3
!
hostname R3
!
ip flow-capture fragment-offset
ip flow-capture packet-length
ip flow-capture ttl
ip flow-capture vlan-id
ip flow-capture icmp
ip flow-capture ip-id
ip flow-capture mac-addresses
!
interface Ethernet0/0
 mac-address aaaa.bbbb.cc04
 no ip address
!
interface Ethernet0/0.1
 encapsulation dot1Q 5
 ip address 172.16.6.2 255.255.255.0
 ip accounting output-packets
 ip flow ingress
!
interface Ethernet1/0
 mac-address aaaa.bbbb.cc05
 no ip address
!
interface Ethernet1/0.1
 encapsulation dot1Q 6
 ip address 172.16.7.1 255.255.255.0
 ip accounting output-packets
 ip flow egress
!
router rip
 version 2
 network 172.16.0.0
 no auto-summary
!
R4
!
hostname R4
!
interface Ethernet0/0
 mac-address aaaa.bbbb.cc07
 ip address 172.16.10.1 255.255.255.0
!
interface Ethernet1/0
 mac-address aaaa.bbbb.cc06
 no ip address
!
interface Ethernet1/0.1
 encapsulation dot1Q 6
 ip address 172.16.7.2 255.255.255.0
!
router rip
 version 2
 network 172.16.0.0
 no auto-summary
!
The
showipcacheverboseflow command displays the NetFlow flows that have been captured from the ICMP traffic that Host A is sending.
The fields that have their values captured by the
ipflow-capture command are explained in Table 10. The fields and values are used to analyze the traffic for this example. The other fields
captured by the
showipcacheverboseflow command are explained in the subsequent tables (Table 11 to Table 13).
The preceding output shows the percentage distribution of packets by size. In this display, 16.6 percent of the packets fall
in the 1024-byte size range and 83.2 percent fall in the 1536-byte range.
The rest of the output of the
showipcacheverboseflow command is as follows:
IP Flow Switching Cache, 278544 bytes
  3 active, 4093 inactive, 7 added
  91 ager polls, 0 flow alloc failures
  Active flows timeout in 1 minutes
  Inactive flows timeout in 10 seconds
IP Sub Flow Cache, 25736 bytes
  7 active, 1017 inactive, 17 added, 7 added to flow
  0 alloc failures, 0 force free
  1 chunk, 0 chunks added
  last clearing of statistics 00:01:13
Protocol         Total    Flows   Packets Bytes  Packets Active(Sec) Idle(Sec)
--------         Flows     /Sec     /Flow  /Pkt     /Sec     /Flow     /Flow
ICMP                 2      0.0      1500  1378     42.8      11.4      10.9
Total:               2      0.0       600  1378     42.9      11.5      10.8
SrcIf          SrcIPaddress    DstIf          DstIPaddress    Pr TOS Flgs  Pkts
Port Msk AS                    Port Msk AS    NextHop              B/Pk  Active
Et0/0.1        10.106.1.1      Et1/0.1        172.16.10.2     01 00  10     391
0000 /0  0                     0800 /0  0     0.0.0.0              1500     8.6
MAC: (VLAN id) aaaa.bbbb.cc03  (005)          aaaa.bbbb.cc06  (006)
Min plen:      1500                            Max plen:       1500
Min TTL:         59                            Max TTL:          59
ICMP type:       8                            ICMP code:        0
IP id:       13499
Et0/0.1        10.106.1.1      Et1/0.1        172.16.10.2     01 00  00    1950
0000 /0  0                     0000 /0  0     0.0.0.0              1354     8.6
MAC: (VLAN id) aaaa.bbbb.cc03  (005)          aaaa.bbbb.cc06  (006)
Min plen:      772                            Max plen:       1500
Min TTL:         59                           Max TTL:          59
ICMP type:       0                            ICMP code:        0
IP id:       13499                            FO:            185
R3#
For field descriptions of the NetFlow Cache output, see Table 10.
Table 10. Field Descriptions in the NetFlow Cache Section of the Output
Field
Description
bytes
Number of bytes of memory used by the NetFlow cache.
active
Number of active flows in the NetFlow cache at the time this command was entered.
inactive
Number of flow buffers that are allocated in the NetFlow cache but that were not assigned to a specific flow at the time
this command was entered.
added
Number of flows created since the start of the summary period.
ager polls
Number of times the NetFlow code caused entries to expire (used by Cisco Customer Support Engineers (CSEs) for diagnostic
purposes).
flow alloc failures
Number of times the NetFlow code tried to but was not able to allocate flows.
last clearing of statistics
The period of time that has passed since the
clearipflowstats command was last executed. The standard time output format of hours, minutes, and seconds (hh:mm:ss) is used for a period
of time less than 24 hours. The time output format changes to hours and days after the time exceeds 24 hours.
For field descriptions of the Activity by Protocol lines section of the output, see Table 11.
Table 11. Field Descriptions in the Activity by Protocol lines section of the Output
Field
Description
Protocol
IP protocol and the well-known port number. (Refer to
http://www.iana.org, Protocol Assignment Number Services, for the latest RFC values.)
Note
Only a small subset of all protocols is displayed.
Total Flows
Number of flows for this protocol since the last time statistics were cleared.
Flows/Sec
Average number of flows for this protocol per second, which is equal to the total flows divided by the number of seconds
for this summary period.
Packets/Flow
Average number of packets for the flows for this protocol, which is equal to the total packets for this protocol divided
by the number of flows for this protocol for this summary period.
Bytes/Pkt
Average number of bytes for the packets for this protocol, which is equal to the total bytes for this protocol divided by
the total number of packets for this protocol for this summary period.
Packets/Sec
Average number of packets for this protocol per second, which is equal to the total packets for this protocol divided by
the total number of seconds for this summary period.
Active(Sec)/Flow
Number of seconds between the first and the last packet of an expired flow divided by the number of total flows for this protocol,
for this summary period.
Idle(Sec)/Flow
Number of seconds observed from the last packet in each nonexpired flow for this protocol until the time at which the
showipcacheverboseflow command was entered, divided by the total number of flows for this protocol, for this summary period.
For field descriptions of the NetFlow Record lines section of the output, see Table 12.
Table 12. Field Descriptions in the NetFlow Record lines section of the Output
Field
Description
SrcIf
Interface on which the packet was received.
Port Msk AS
Source port number (displayed in hexadecimal format), IP address mask, and autonomous system number. The value of this field
is always set to 0 in MPLS flows.
SrcIPaddress
IP address of the device that transmitted the packet. The sending host is using 10.106.1.1 as the source IP address.
DstIf
Interface from which the packet was sent.
Note
If an asterisk (*) immediately follows the DstIf field, the flow being shown is an egress flow.
Port Msk AS
Destination port number (displayed in hexadecimal format), IP address mask, and autonomous system. This is always set to
0 in MPLS flows.
DstIPaddress
IP address of the destination device.
NextHop
The BGP next-hop address. This is always set to 0 in MPLS flows.
Pr
IP protocol “well-known” port number, displayed in hexadecimal format. (Refer to
http://www.iana.org, Protocol Assignment Number Services, for the latest RFC values.)
ToS
Type of service, displayed in hexadecimal format.
B/Pk
Average number of bytes observed for the packets seen for this flow.
Flgs
TCP flag, shown in hexadecimal format. This value is the result of bitwise OR of the TCP flags from all packets in the flow.
Pkts
Number of packets in this flow.
Active
Time the flow has been active.
For field descriptions of the NetFlow Traffic Classification and Identification fields, see Table 13.
Table 13. NetFlow Traffic Classification and Identification
Field
Description
MAC
The source and destination MAC addresses from the traffic, read from left to right in the output.
The traffic is received from MAC address aaaa.bbbb.cc03.
Note
This MAC address is interface 1/0.1 on router R2.
The traffic is transmitted to MAC address aaaa.bbbb.cc06.
Note
This MAC address is interface 1/0.1 on router R4.
VLAN id
The source and destination VLAN IDs, read from left to right in the output.
The traffic is received from VLAN 5.
The traffic is transmitted to VLAN 6.
Min plen
The minimum packet length for the packets captured in the two flows.
The current value for the first flow is 1500.
The current value for the second flow is 772.
Max plen
The maximum packet length for the packets captured in the two flows.
The current value for the first flow is 1500.
The current value for the second flow is 1500.
Min TTL
The minimum time to live (TTL) for the packets captured in the two flows.
The current value is 59.
Max TTL
The maximum TTL for the packets captured in the two flows.
The current value is 59.
IP
The IP identifier field for the traffic in the flows. The current value is 13499 for the two flows.
ICMP type
The Internet Control Message Protocol (ICMP) type field from the ICMP datagram captured in the first flow.
The value is 8.
ICMP code
The ICMP code field from the ICMP datagram captured in the second flow.
The value is 0.
FO
This is the value of the fragment offset field from the first fragmented datagram in the second flow.
The value is 185.
Two ICMP flows are shown in the output. They are from the same ICMP datagram because they have the same IP ID field value
of 13499. When two ICMP flows have the same IP ID value, the ICMP datagram being analyzed has been fragmented. The first flow
has the ICMP type field set to 8, which indicates that this is an ICMP echo request (ping) datagram. The value of 185 in the
fragment offset (FO) field in the second flow shows where this fragment will be placed in the memory buffer of the FTP server
as the server reassembles the ICMP datagram. The value of 185 applies only to the first fragment of this datagram. The subsequent
values will be greater because they include the previous fragments.
The value of 0 in the ICMP type field of the second flow does not mean that this flow is an ICMP echo reply as Table 13 shows.
In this case, the ICMP type field value is set to 0 because the ICMP headers for fragments of ICMP datagrams do not have the
type and code fields. The default value of 0 is inserted instead.
Note
If this data were captured from a real ICMP attack, it would probably have more than one flow.
Although you cannot learn the original size of the ICMP datagram from the information shown by the
showipcacheverboseflow command, the fact that the datagram was large enough to be fragmented in transit is a good indication that this is not a
normal ICMP datagram. Notice the values in the minimum packet length and maximum packet length fields for both flows. The
values for both fields are set to 1500 for the first flow. The value for the minimum packet length is set to 772 and the value
for the maximum packet length is set to 1500 for the second flow.
If this traffic is identified as a DoS attack based on the data captured in the Layer 3 fields, you can use the Layer 2 information
in the flows to identify the path that the traffic is taking through the network. In this example, the traffic is being sent
to R3 on VLAN 5, by R2. Here, R2 is transmitting the traffic over interface 1/0.1 because the source MAC address (aaaa.bbb.cc03)
belongs to 1/0.1 on R2. It is evident that R3 is transmitting the traffic using VLAN 6 on interface 1/0.1 to interface 1/0.1
on R4, because the destination MAC address (aaaa.bbbb.cc06) belongs to interface 1/0.1 on R4.
You can use this information to mitigate the attack. One possible way to mitigate this attack is by configuring an extended
IP access list that blocks ICMP traffic from any host with a source address that is on the 10.0.0.0 network. Another possible
solution is to configure a default route for the 10.0.0.0 network that points to the null interface on the router.
Caution
Each of these solutions blocks traffic from legitimate hosts on the 10.0.0.0 network. Therefore, these solutions should be
used only while you identify the point of origin of the attack and decide how to stop it.
Example: Configuring NBAR Support for NetFlow Exports
The following example shows how to configure NBAR support for NetFlow exports:
Device(config)# ip flow-export version 9
Device(config)# ip flow-capture nbar
Device(config)# ip flow-export template options nbar
Device(config)# exit
The following is sample output from the
showipflowexportnbar command:
Device# show ip flow export nbar

Nbar netflow is enabled
10 nbar flows exported
0 nbar flows failed to export due to lack of internal buffers
The following example shows how to clear NBAR data from NetFlow accounting statistics:
The Cisco Technical Support website contains thousands of pages of searchable technical content, including links to products,
technologies, solutions, technical tips, and tools. Registered Cisco.com users can log in from this page to access even more
content.
Feature Information for NetFlow Layer 2 and Security Monitoring Exports
The following table provides release information about the feature or features described in this module. This table lists
only the software release that introduced support for a given feature in a given software release train. Unless noted otherwise,
subsequent releases of that software release train also support that feature.
Use Cisco Feature Navigator to find information about platform support and Cisco software image support. To access Cisco
Feature Navigator, go to https://cfnng.cisco.com/. An account on Cisco.com is not required.
Table 14. Feature Information for NetFlow Layer 2 and Security Monitoring Exports
Feature Name
Releases
Feature Information
Application-Aware NetFlow
12.2(18)ZYA2
The Application-Aware NetFlow feature enables capturing of application information collected by PISA NBAR and exports using
NetFlow Version 9.
The following commands were modified by this feature:
clearipflowstats,
ipflow-capture,
ipflow-exporttemplateoptions, and
showipflowexport.
NetFlow Layer 2 and Security Monitoring Exports
12.2(33)SRA
12.3(14)T
The NetFlow Layer 2 and Security Monitoring Exports feature enables the capture of values from fields in Layer 2 and Layer
3 of IP traffic for accounting and security analysis.
The following commands were modified by this feature:
ipflow-capture,
ipflow-export, and
showipcacheverboseflow.
Support for capturing the value from the fragment offset field of IP headers added to NetFlow Layer 2 and Security Monitoring
Exports1
12.4(2)T
The
fragment-offset keyword for the
ipflow-capture command enables capturing the value of the IP fragment offset field from the first fragmented IP datagram in a flow.
1 This is a minor enhancement. Minor enhancements are not typically listed in Feature Navigator.
Glossary
exportpacket—A type of packet built by a device (for example, a router) with NetFlow services enabled. The packet contains NetFlow statistics.
The packet is addressed to another device (for example, the NetFlow Collection Engine). The other device processes the packet
(parses, aggregates, and stores information about IP flows).
flow—A set of packets with the same source IP address, destination IP address, protocol, source/destination ports, type of service,
and the same interface on which flow is monitored. Ingress flows are associated with the input interface, and egress flows
are associated with the output interface.
NBAR—A classification engine in the Cisco IOS software that recognizes a wide variety of applications, including web-based and
client/server applications.
NetFlow—Cisco IOS accounting feature that maintains per-flow information.
NetFlowAggregation—A NetFlow feature that lets you summarize NetFlow export data on a Cisco IOS router before the data is exported to a NetFlow
data collection system such as the NetFlow Collection Engine. This feature lowers bandwidth requirements for NetFlow export
data and reduces platform requirements for NetFlow data collection devices.
NetFlowCollectionEngine (formerly NetFlow FlowCollector)—A Cisco application that is used with NetFlow on specific Cisco devices. The NetFlow Collection
Engine collects packets from the device that is running NetFlow and decodes, aggregates, and stores them. You can generate
reports on various aggregations that can be set up on the NetFlow Collection Engine.
NetFlowv9—NetFlow export format Version 9. A flexible and extensible means of carrying NetFlow records from a network node to a collector.
NetFlow Version 9 has definable record types and is self-describing for easier NetFlow Collection Engine configurations.


 Feedback