
New and changed information
The following table provides an overview of the significant changes up to this current release. The table does not provide an exhaustive list of all changes or of the new features up to this release.
| Release Version | Feature | Description |
|---|---|---|
|
Nexus Dashboard 4.1.1 |
Improved navigation and workflow for performing search and explore |
Beginning with Nexus Dashboard 4.1.1, the navigation and workflow when performing search and explore of Nexus Dashboard have been enhanced. |
|
Nexus Dashboard 4.1.1 |
Ability to query and view flow telemetry data across fabrics for multi-fabric stitching |
With this release, Nexus Dashboard supports the ability to query and view flow telemetry data across ACI to ACI fabrics and NX-OS to NX-OS fabrics on the Search and Explore page. For more information, see Configure multi-fabric traffic path tracing and fault correlation. |
|
Nexus Dashboard 4.1.1 |
Telemetry support for Policy-based redirect (PBR) services |
With this release, Nexus Dashboard enhanced the configuration and policy table in How do they talk? for PBR-enabled contracts. This is applicable only to ACI fabrics. For more information, see Policy-based redirect support for Search and Explore. |
|
Nexus Dashboard 4.1.1 |
Multi-cluster global endpoint search |
The new global search feature in Cisco Nexus Dashboard now includes enhanced filtering options to narrow down searches. You can view resource details directly, even if the resource is in a remote cluster, and easily navigate back to the local cluster’s fabric listing page. This feature requires telemetry-enabled clusters and delivers real-time search results. For more information, see Multi-cluster connectivity global search across all clusters. |
Search and Explore
How Search and Explore works
Search and Explore functionality allows you to quickly search for an IP or MAC address, interface name, or switch name across all the fabrics managed by Nexus Dashboard and view the results within a few seconds. You can also create a Show query to display anomalies, advisories, controllers and switches in inventory, interfaces, endpoints, and more. Search and Explore also enables you to ask questions or use explore queries to understand how different elements communicate with each other as well as other associations.
Multi-cluster connectivity global search across all clusters
The Nexus Dashboard 4.1.1 introduces multi-cluster connectivity global search across all clusters, providing a unified search capability across multiple Nexus Dashboard clusters. From any cluster, you can search for various network objects, including IP address, MAC address, and endpoints. This feature supports historical searches and caches your past search strings.
Supported query types
Search and Explore supports these queries.
-
What query — Answers how the different networking entities are related to each other.
Examples:
-
What EPGs are associated with VRF: uni/tn-AIOps/ctx-APP1
-
What endpoints are associated with interface: topology/pod-1/paths-101/pathep-[eth1/10]
-
What EPGs are associated with bridge domains: uni/tn-AIOps/BD-10.0.0.0_24 and leaf leaf-101
-
-
Can query — Answers whether the entities in the ACI policy can communicate with each other. Can queries allow you to determine if the entities in the ACI policy can communicate using protocols such as TCP, UDP, or ICMP and the source and destination ports used for communication.
Examples:
-
Can entity — Can A_ talk to entity B?
-
Can EPG — Can uni/tn-secure/ap-AP0/epg-B talk to EPG: uni/tn-secure/ap-AP0/epg-A on tcp dport: 80 sport: 10?
-
-
Show query — Allows you to view any of the various objects across any fabric currently visible in Nexus Dashboard.
You can perform Show queries on anomalies, advisories, switches, controllers, endpoints, interfaces, flows, and more.
Guidelines and limitations for Search and Explore
-
Nexus Dashboard supports Search and Explore, search supports both IPv4 and IPv6 addresses but explore supports only IPv4 address.
-
When you enter a search string, auto-suggest displays the results that begin with the input string. The search string is case sensitive.
-
Search and Explore is not available for hardware and capacity resources on leaf switches.
-
In certain cases, single keyword search for interface types such as port channel, virtual port channel, and virtual port channel peer link is supported.
-
Scale limits for Search and Explore include:
-
On a virtual Nexus Dashboard, Nexus Dashboard supports snapshots with 100,000 logical rules and 350,000 (Vertices + Edges).
-
On a physical Nexus Dashboard, Nexus Dashboard supports snapshots with 300,000 logical rules and 1000,000 (Vertices + Edges).
-
Guidelines and limitations for multi-cluster connectivity global search
-
Primarily supports single-word searches for MAC and IP addresses.
-
Auto-suggest provides detailed results including switch, interface, and VLAN information.
-
Results are limited to 10,000 entries and display fabric names.
-
Refine search results by applying filters to columns or description sections within the results table.
-
The search bar is unavailable, and a warning appears if no fabrics across your clusters have telemetry enabled.
-
-
The Details column provides additional information with links to external resources.
-
You can view the details of remote resources within the context of the current clusters.
-
Clicking an endpoint loads its details page within the search view; external links from this page are restricted.
-
Redirecting to a remote cluster does not retain endpoint filters, takes you only to the fabric-level, and provides no direct return to the search view.
Guidelines and limitations for queries in any fabric
-
A What X to any association query is only supported for single fabrics.
-
The retention period for a What query is seven days. After that, the What query does not display in historical searches.
Guidelines and limitations for queries in a Cisco ACI fabric
-
A Can any-to-any query is not supported.
-
For a Can query between prefixes, if the number of EPGs shared by the prefixes is greater than 25, the endpoint table fails to load the data and displays an error message.
-
To explore the Cisco APIC resources successfully using the Search and Explore feature, the Cisco APIC policy must contain either valid endpoints such as fv:CEp or valid EPGs.
Guidelines and limitations for queries in an NX-OS or Nexus Dashboard fabric
-
Can query is supported only on ACI fabric and it is not available on NX-OS.
-
Queries for Nexus Dashboard resources (such as interfaces, VRFs, or vPCs) are unavailable on Nexus Dashboard clusters integrated when telemetry is enabled on the local cluster.
-
Specific queries, such as show anomalies on interface, show anomalies on vpc, or show endpoints on interface, are unavailable on Nexus Dashboard clusters running on the same Nexus Dashboard instance when the controller is present on the local cluster.
-
A What X to any association query is only supported for single fabrics. Additionally, Can queries are not supported for NX-OS fabrics.
-
The retention period for a What query is seven days. After that, the What query does not display in historical searches.
-
For NX-OS fabrics, this feature provides a switch-wide view of VRFs, VLANs, interfaces, endpoints, and leaf switch resources in the fabric. Search and Explore also provides Layer 2 VNI and Layer 3 VNI as resources.
-
Resource aggregation is supported for VLAN and VRF resources. With resource aggregation, resources like VRF and VLAN are discovered for the entire fabric and all the leaf switches are aggregated by these resources. If you query What VLANs are associated with any? in the Query Results area, you see a list of all the VLANs available across the fabric. EP and LEAF counts are aggregated by VLAN, and you can find all the EPs and LEAFs associated with a single VLAN by clicking the aggregated resource counts.
Additionally, as the VLAN and VRF queries are fabric-wide, if you want to explore resources for a VLAN on a specific leaf switch, you must use the AND operator in your query.
Example: What EPs are associated with VRF:vrf-vrf_51020 and LEAF:CANDID-SYS-S1-L1
-
A networking asset, such as interfaces on a leaf switch, must be associated with an endpoint in the leaf switch for you to be able to explore it in Search and Explore.
-
When a VRF is not operational, Search and Explore discovers the endpoints as a Layer 2 endpoint. Search and Explore discovers endpoints as Layer 3 or Layer 2 endpoints. All endpoints present in a VLAN are discovered, and other endpoints are ignored.
-
In Search and Explore, if you do not see endpoints or other network assets, look for system anomalies in the associated snapshot. Verify that the collection has succeeded in all the leaf switches. If the collection failed, it may result in endpoints not being discovered.
-
Nexus Dashboard-based fabrics must have endpoints available in the VNIs or VRFs for certain What queries to work, since this feature is based on the endpoints that are learnt on VNIs and/or VRFs. If the endpoints are not available, the What query for the VRF or L3 VNI does not display accurate results.
Perform a Search and Explore operation
Follow these steps to perform a search and explore operation.
-
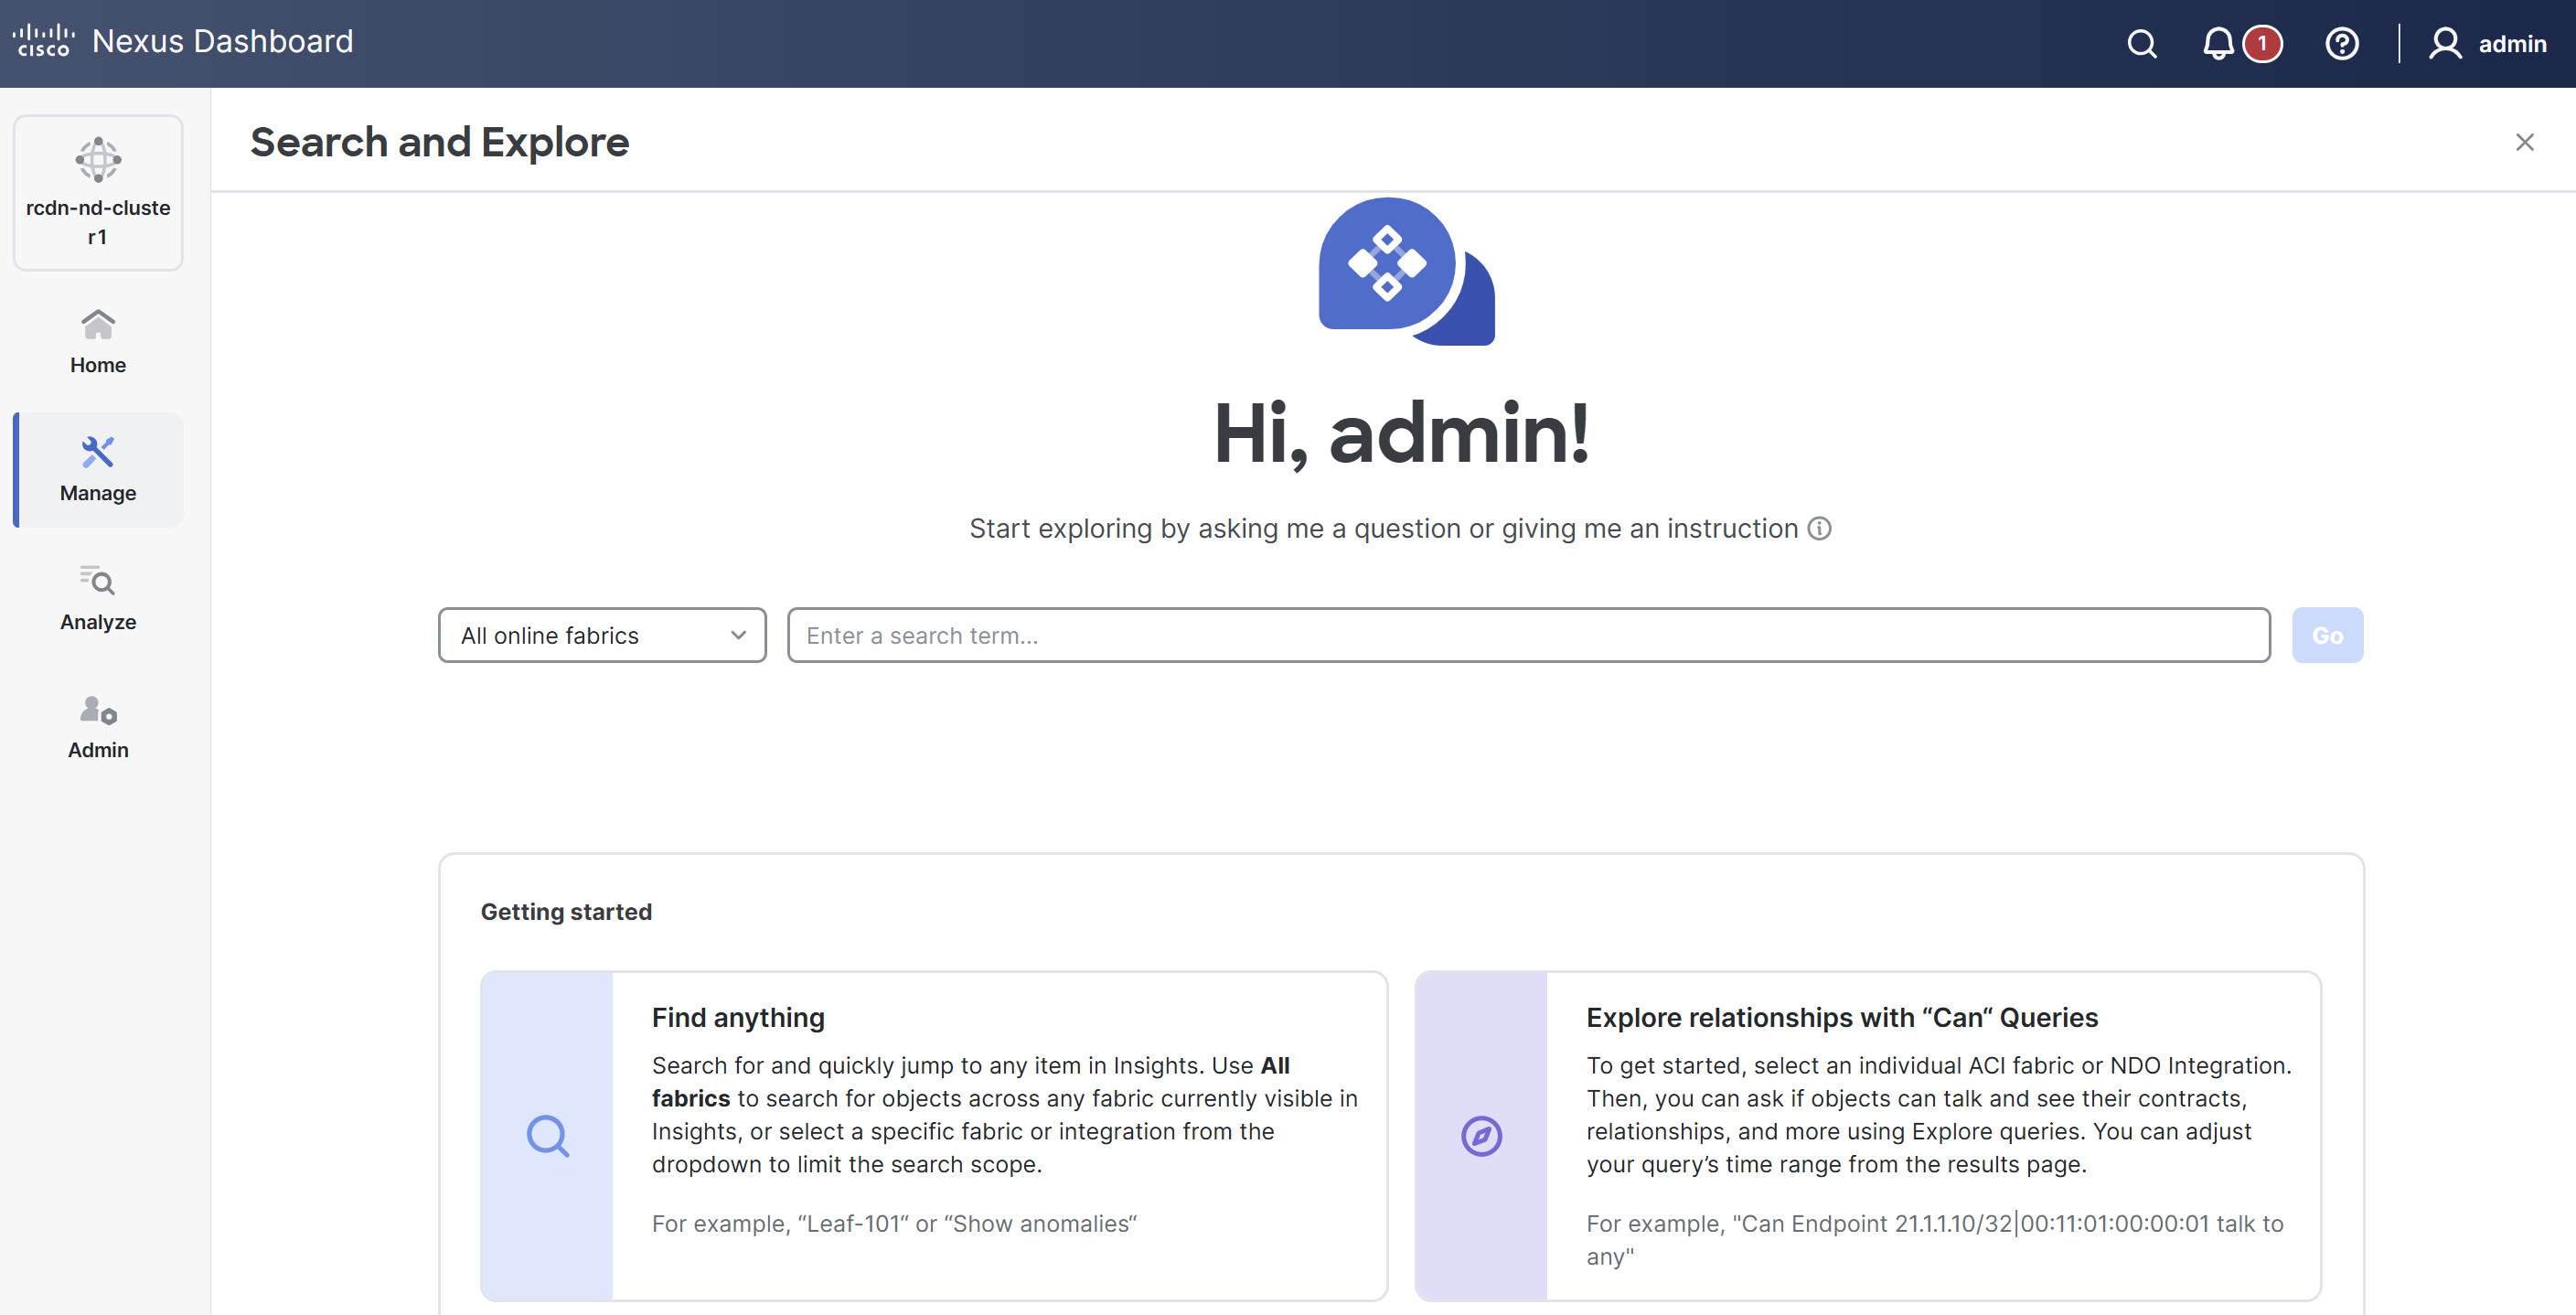
Click the Search and Explore icon at the top of the Nexus Dashboard GUI.
The Search and Explore page appears.
-
From the drop-down list, choose All online fabrics or a single fabric.
-
Keyword Search
-
To perform a keyword search, start typing the interface name, switch name, or an endpoint IP or MAC address. Switches must be searched by name, or by using Show queries. After you start typing the first three letters or numbers, auto-suggest results are displayed along with the detailed descriptions such as fabric endpoint, switch, interface on VRF, and VLAN details. The auto-suggest option is available for both All online fabrics and single fabric queries, across local and multi-clusters.
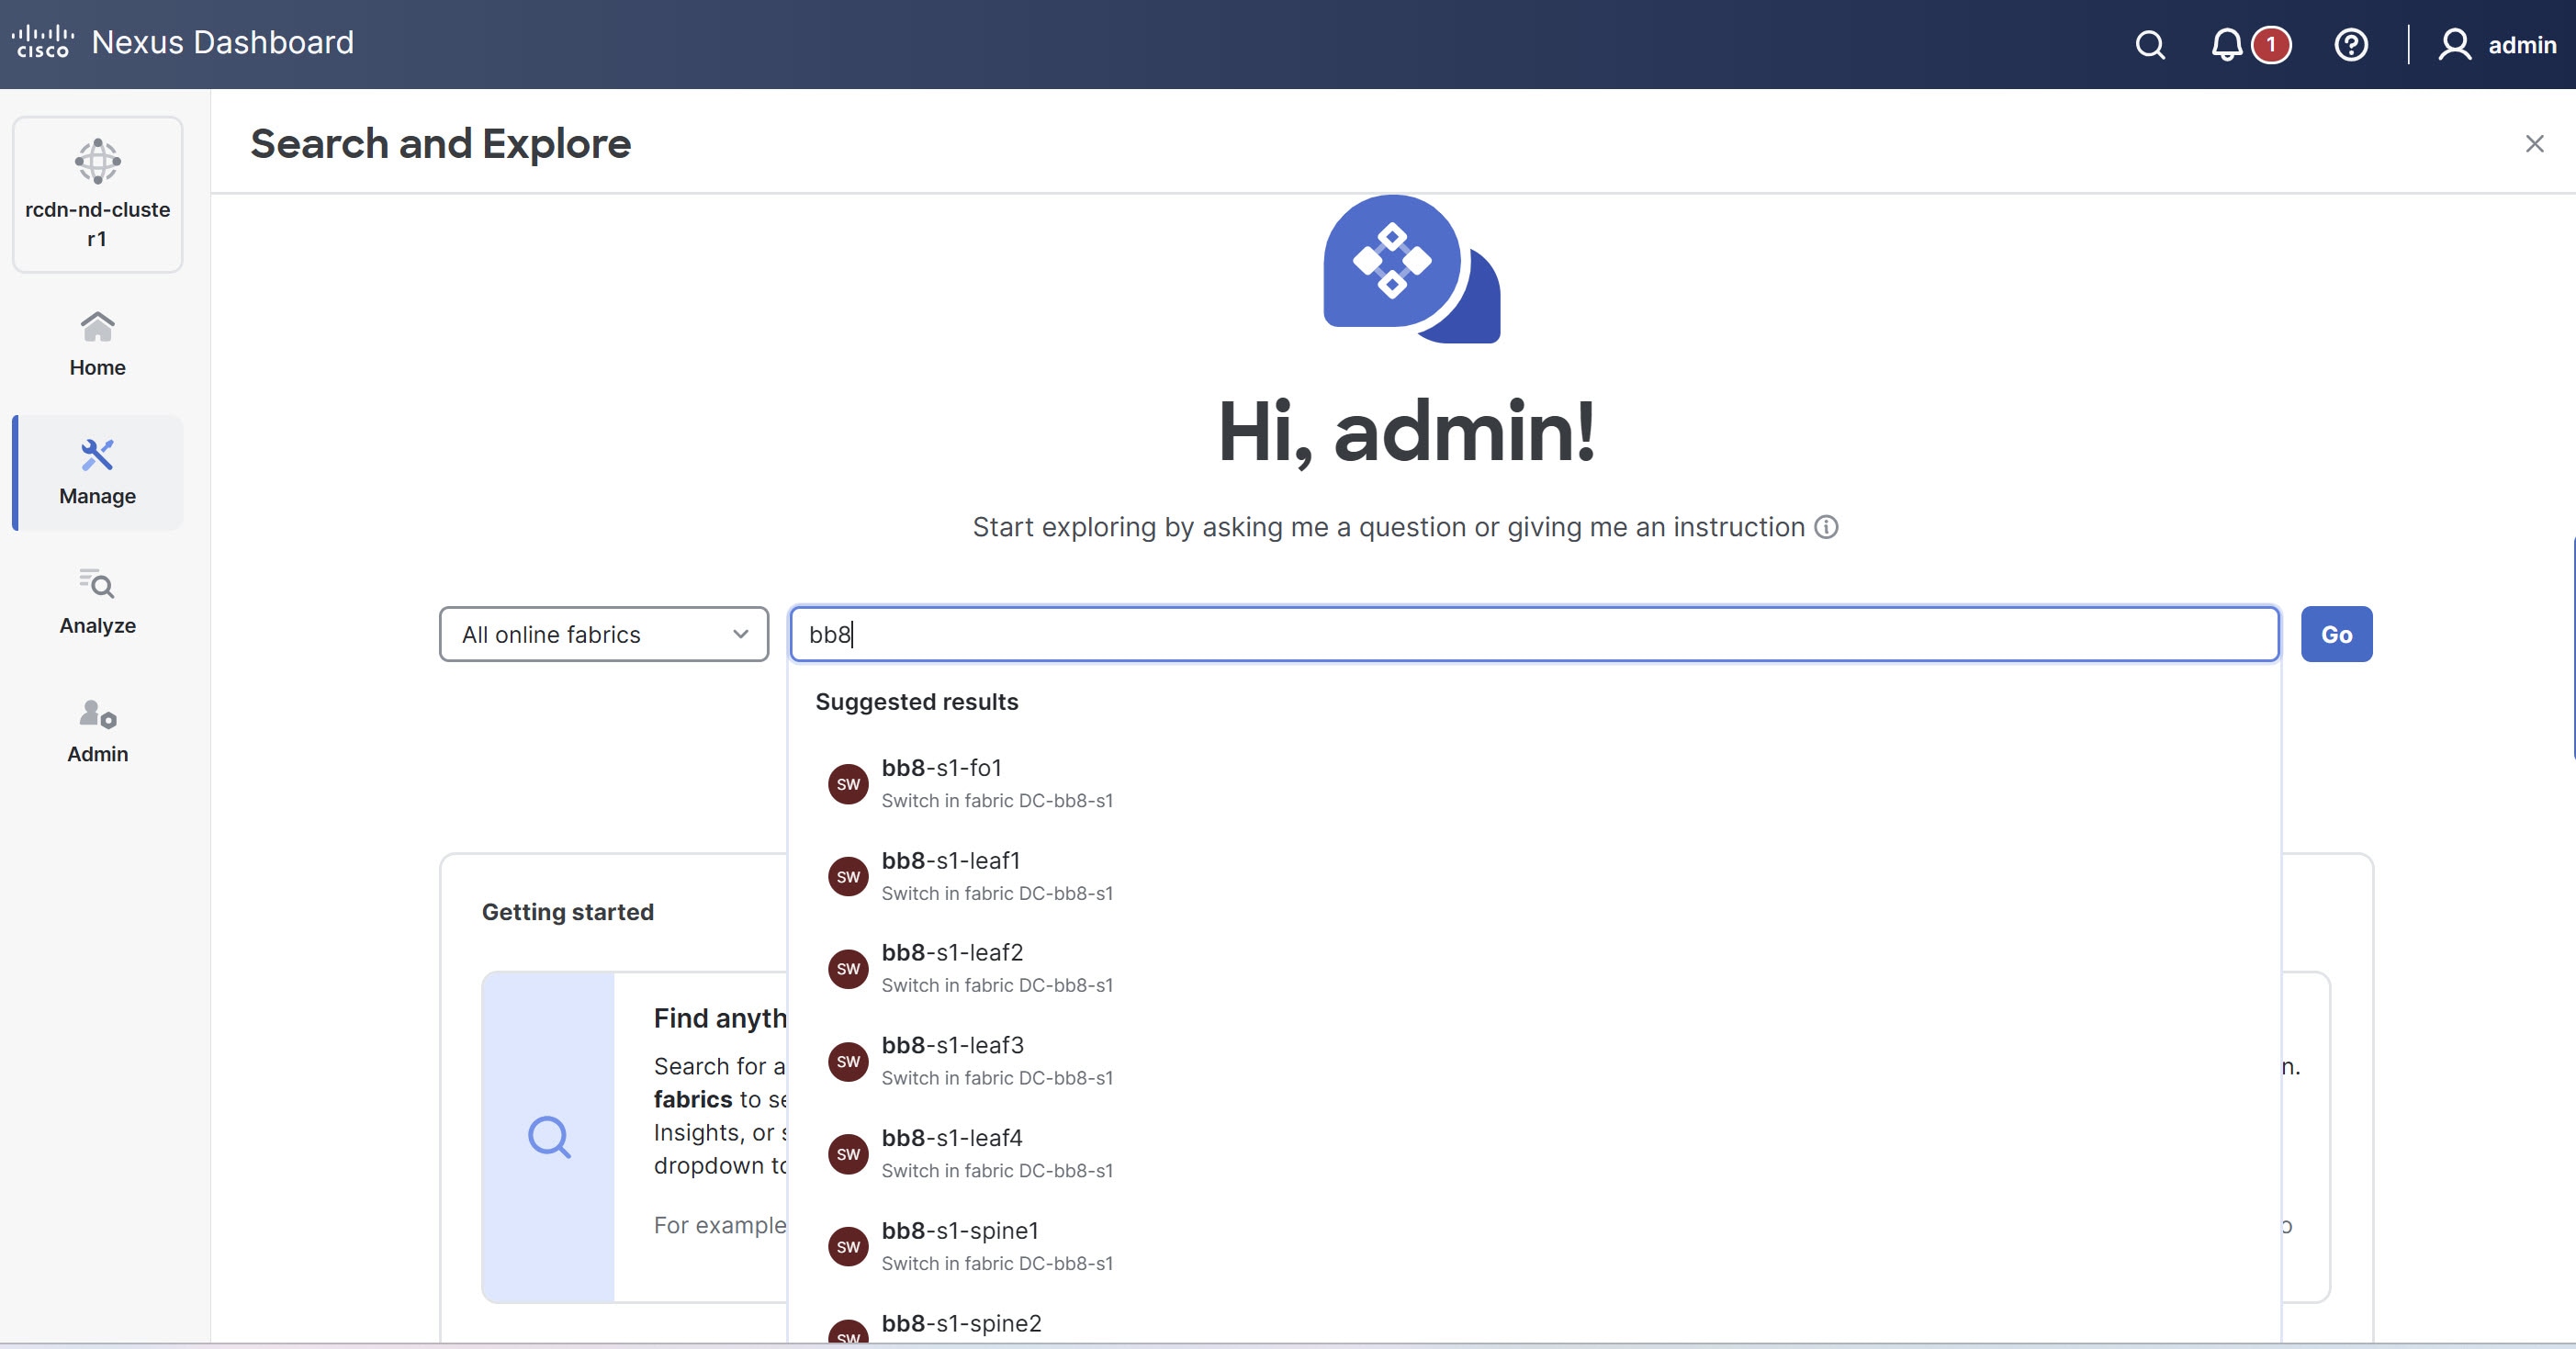

Keyword search is supported on online fabrics. Keyword search is case-sensitive.
-
Choose a result from the suggested results and click Go.
-
By default, search results for Active Now are displayed.
-
For MAC and IP address searches, the endpoint page is displayed. For switch and interface name searches, the respective page displays.
-
-
Show Queries
-
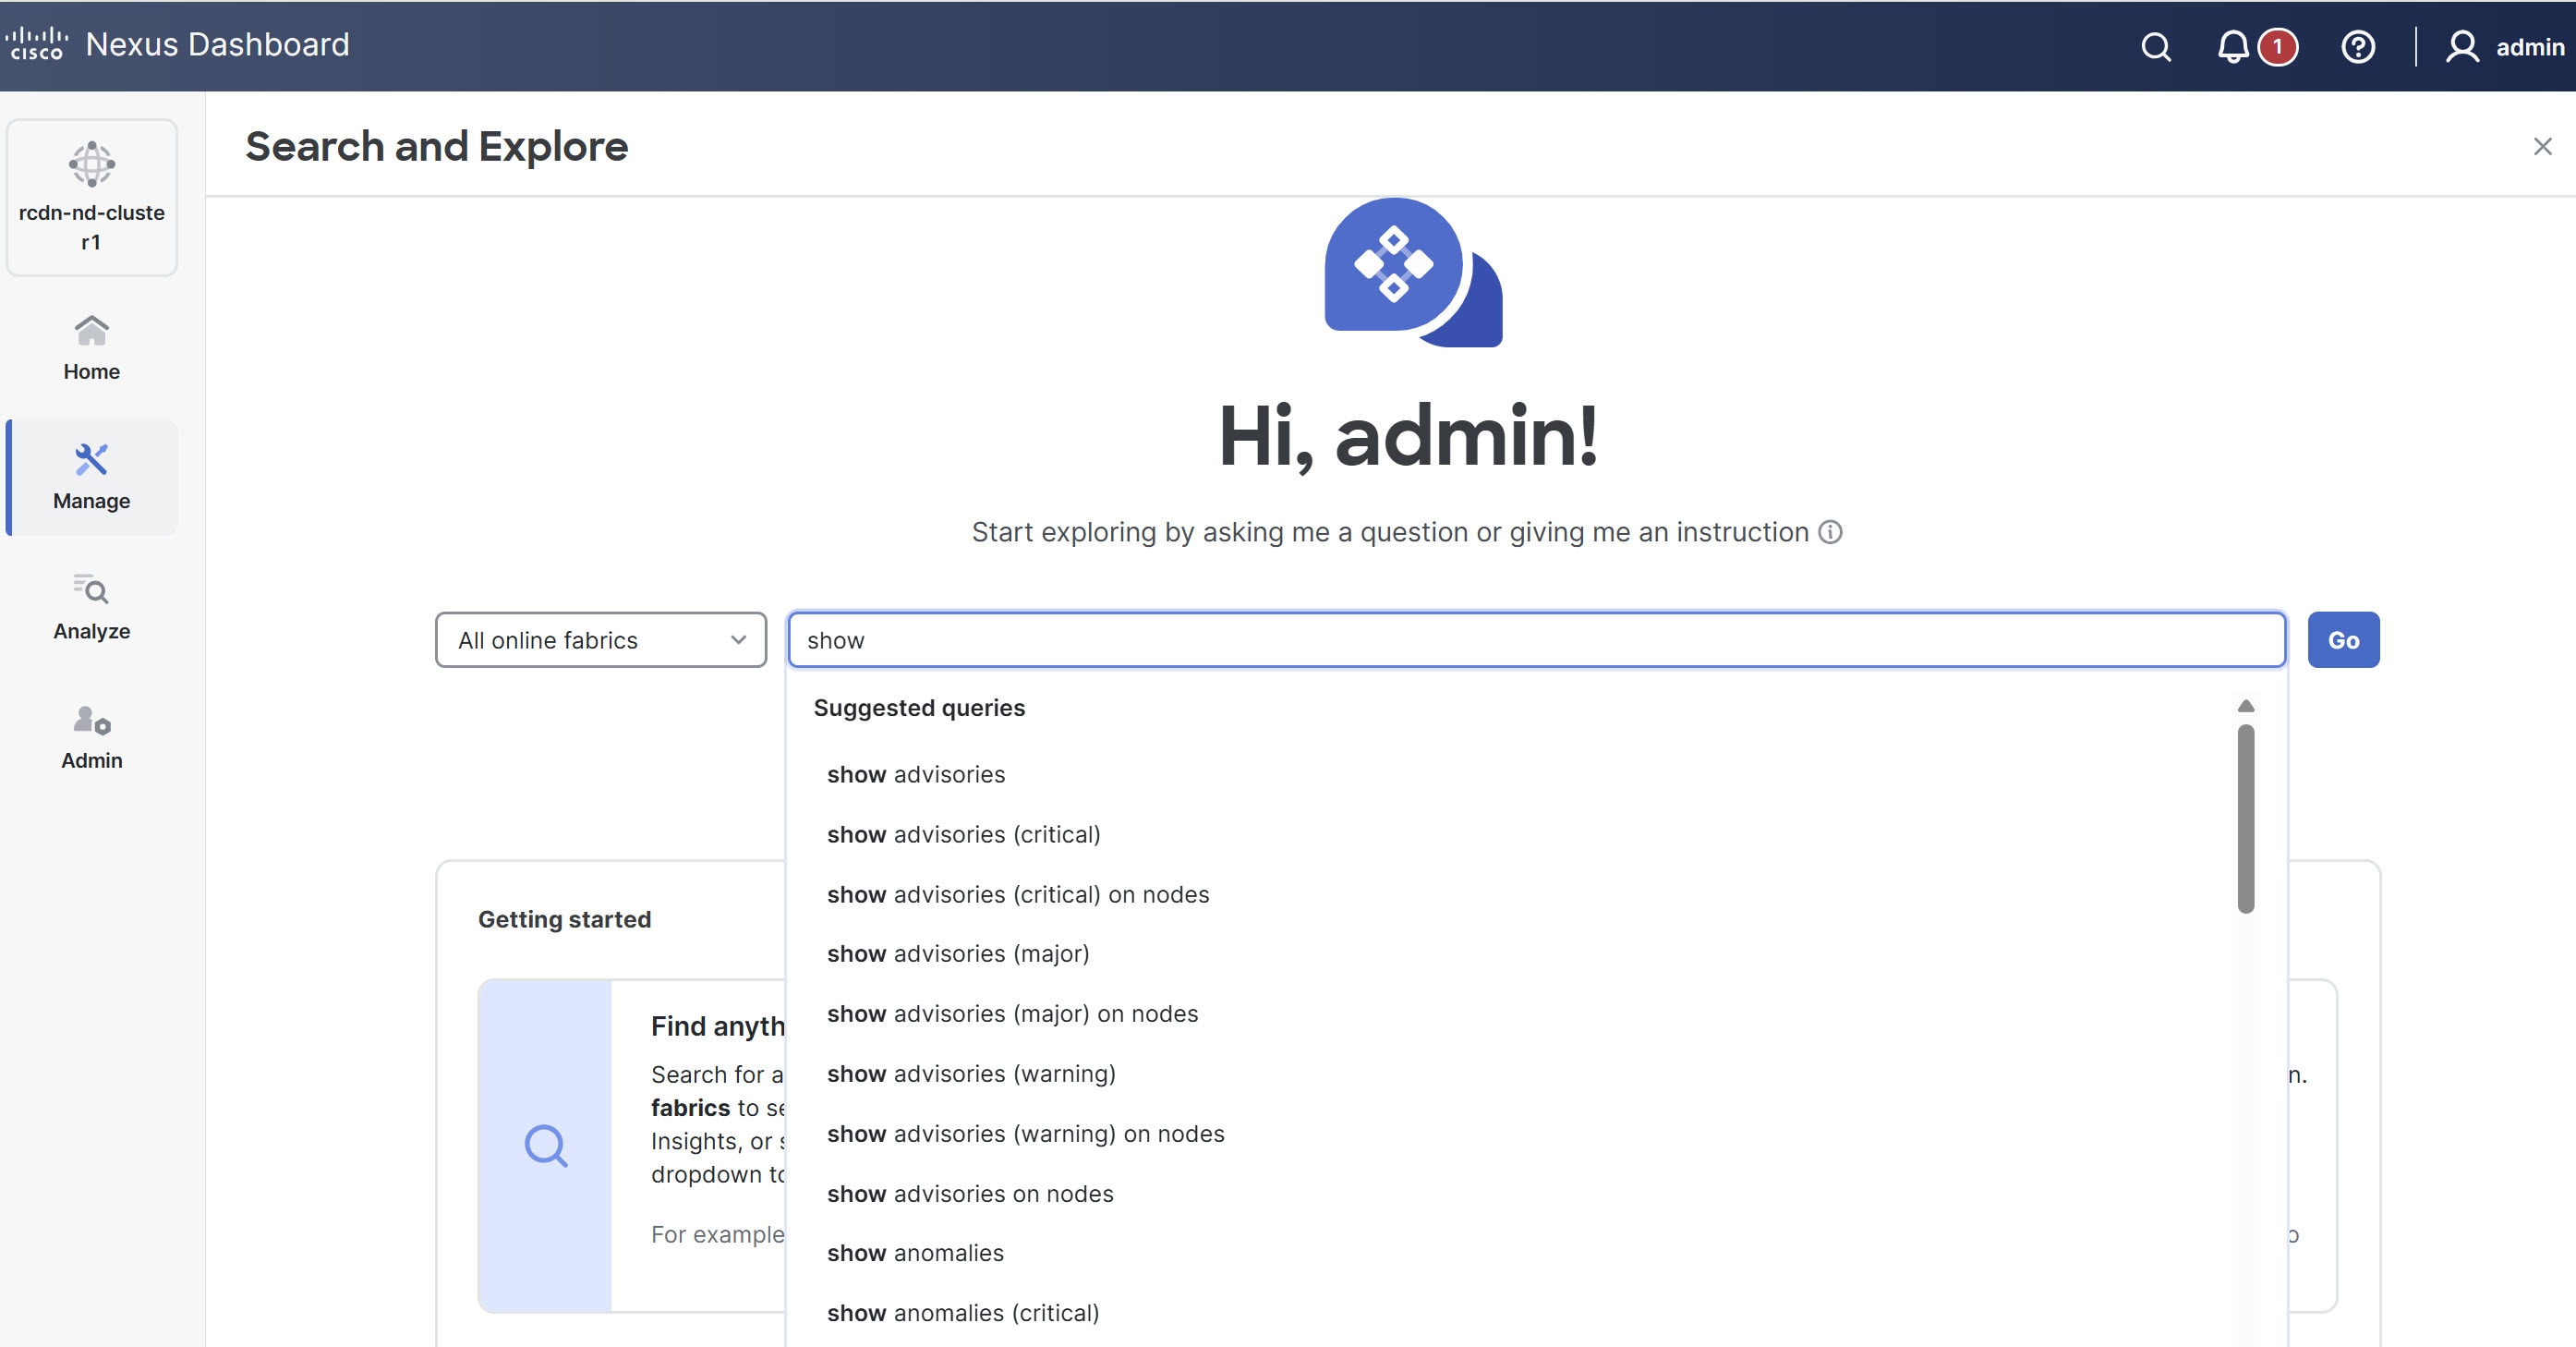
You can perform Show queries on anomalies, advisories, switches, controllers, endpoints, interfaces, flows and more.
-
To perform a Show query, start typing show. Once you start typing, auto-suggest displays the results.
-
Choose a query from the suggested results and click Go.
-
By default, search results for Active Now are displayed.
-
The Show query results are displayed in the existing Nexus Dashboard page with filters.
-
-
What Queries
-
You can perform a What query to answer the question, What entities are associated with each other? This option is unavailable for multi-fabric queries.
-
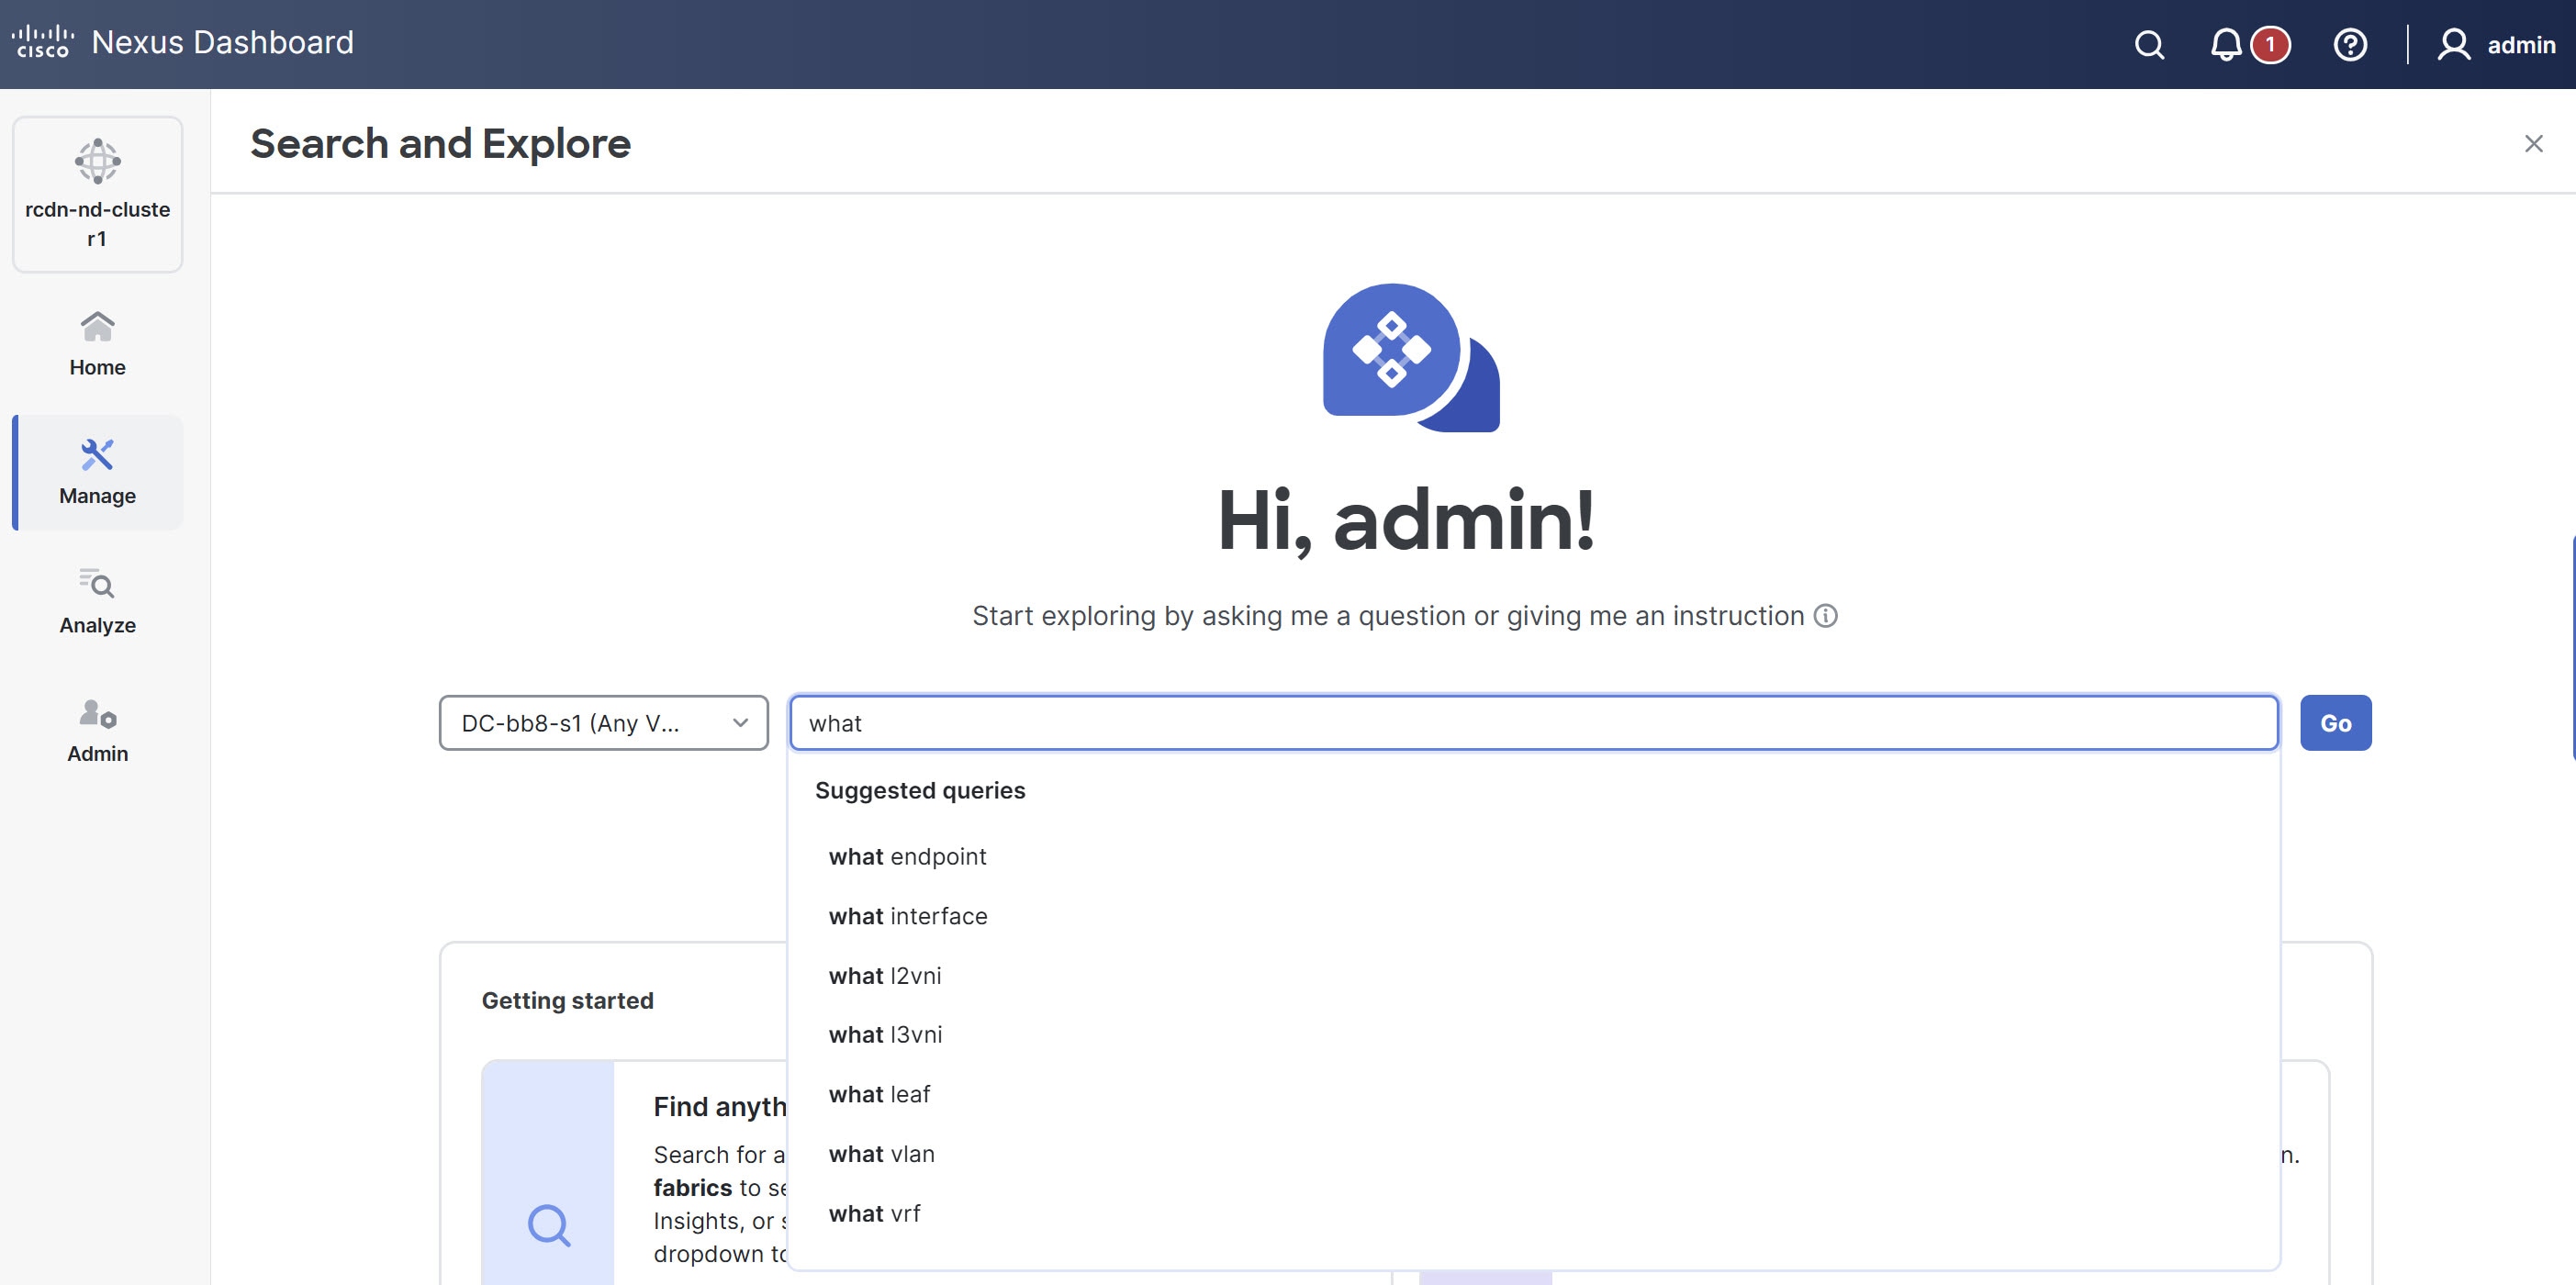
To perform a What query, choose a single fabric from the drop-down list and start typing what.
-
Once you start typing, auto-suggest results are displayed.
-
Choose a query from the suggested results and click Go.
-
By default, search results for Active Now are displayed. From the Date and Time selector, choose the time range to view results for a specific time.
-
The what query results are displayed in a tabular format.
-
-
Can Queries
-
You can perform a Can query to determine if the entities can communicate with each other and the health of the connectivity.
-
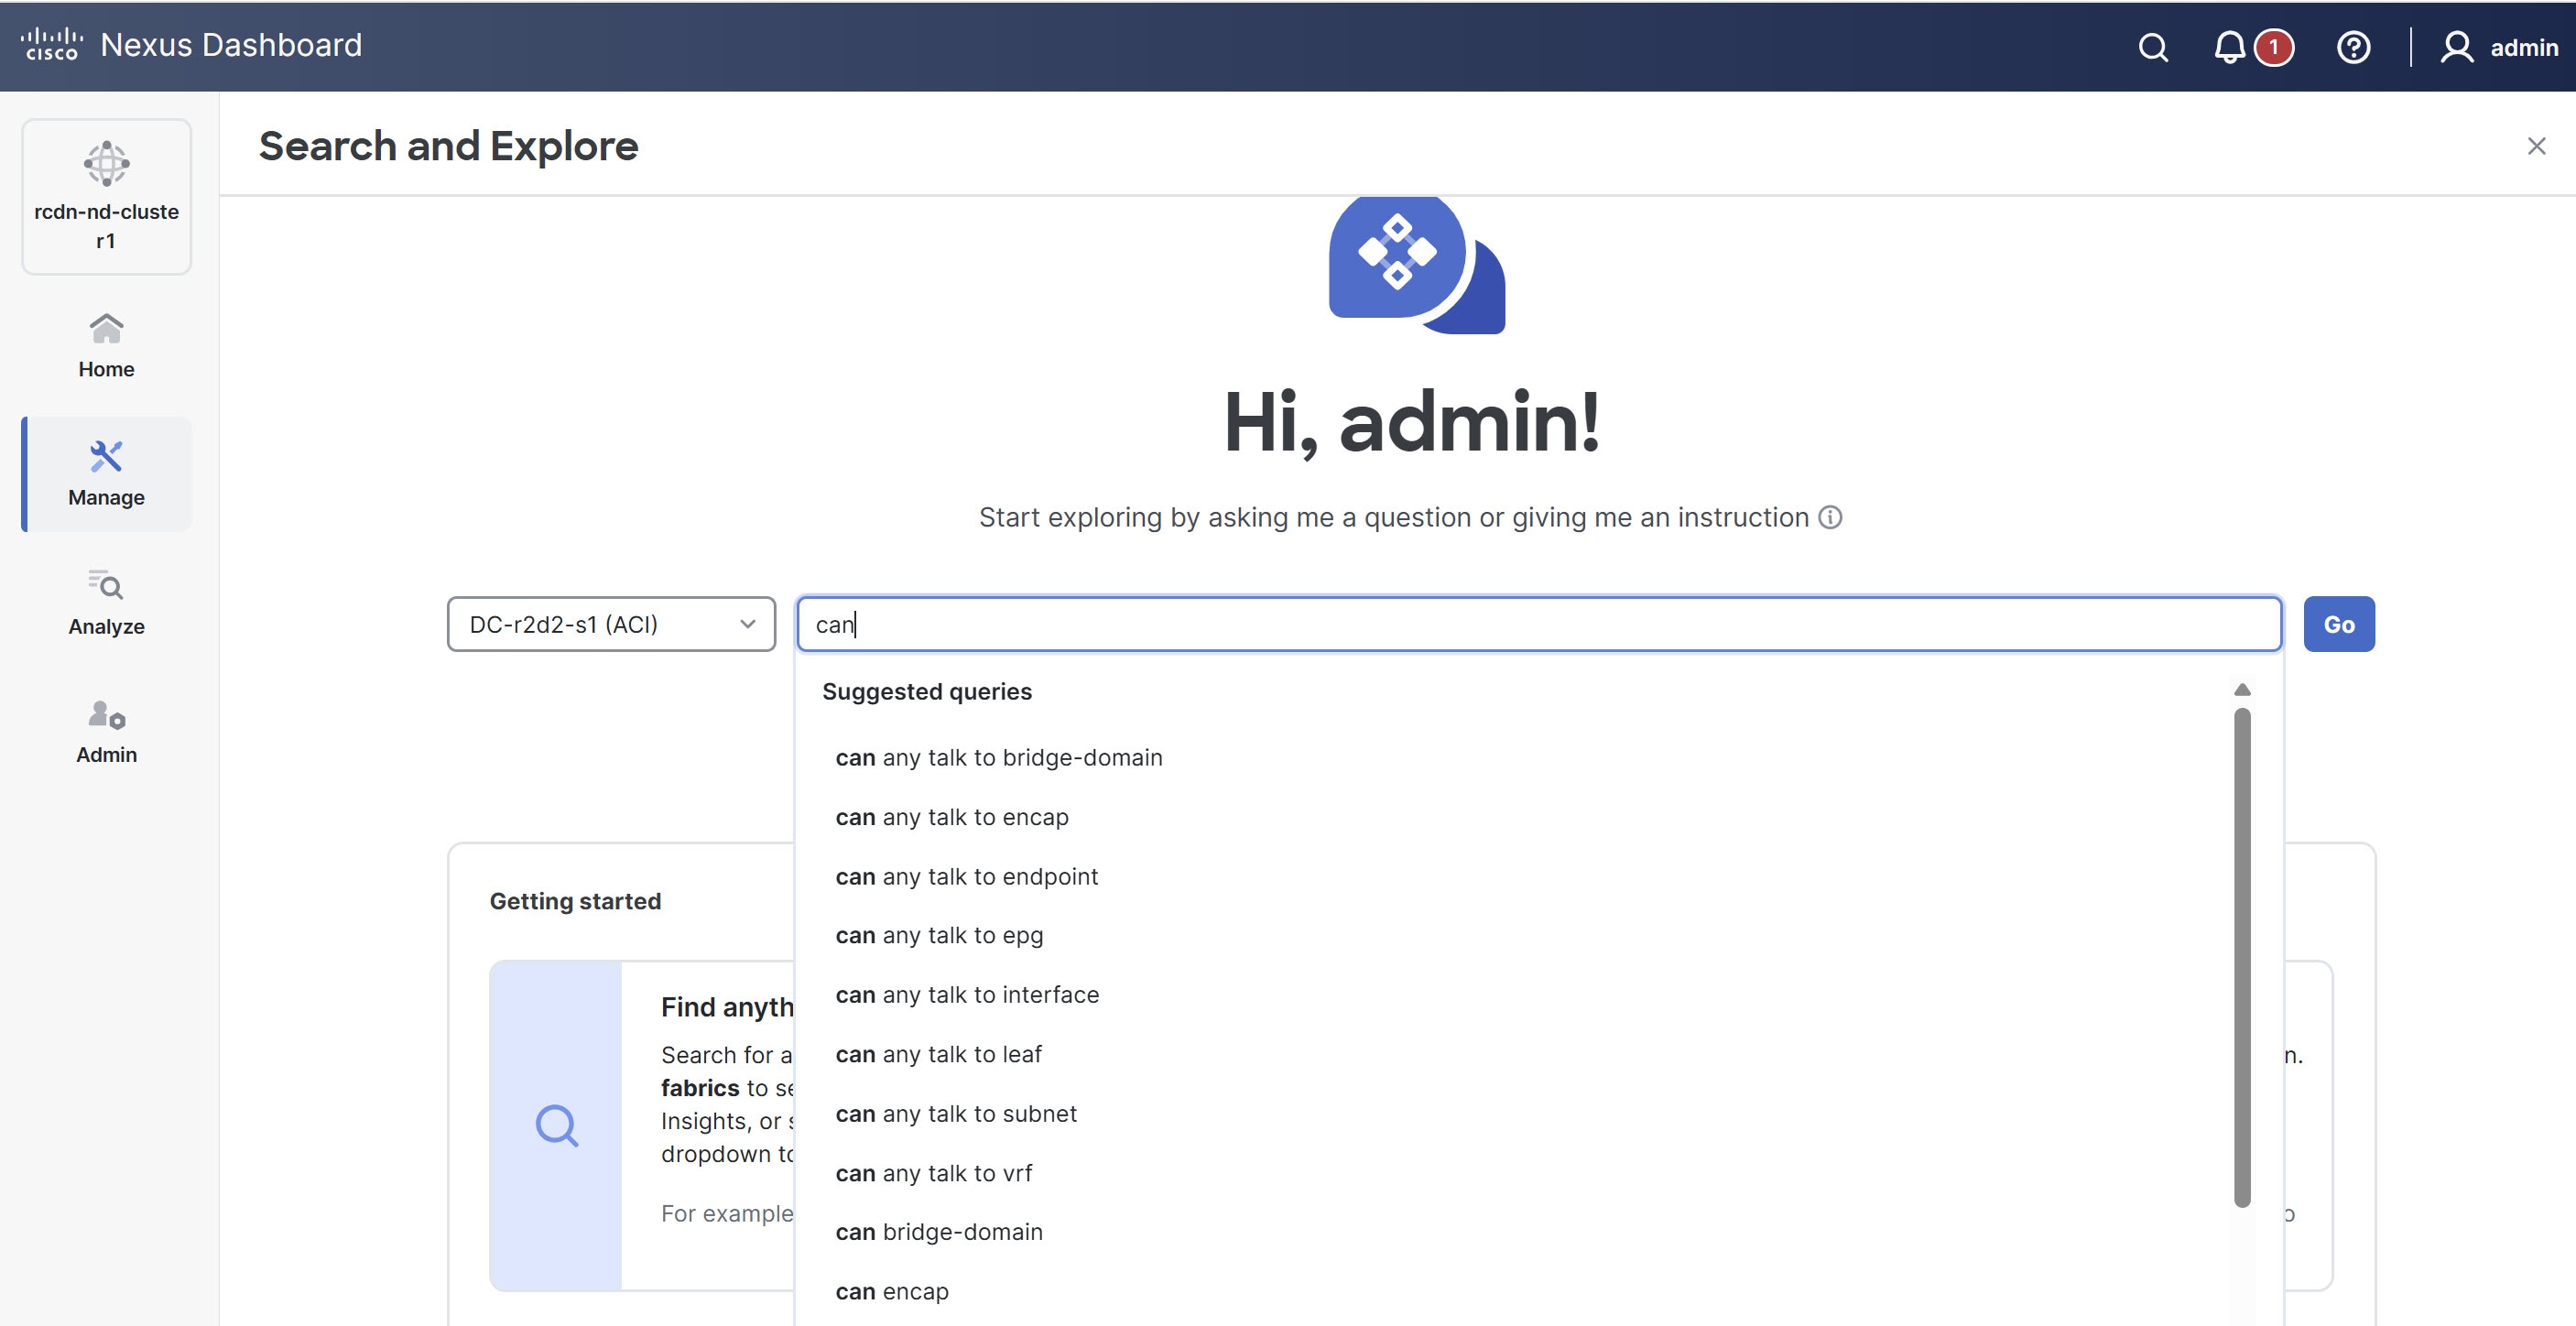
To perform a Can query, choose a single fabric or single ACI fabric from the drop-down list and start typing can.
-
Once you start typing, auto-suggest results are displayed.
-
Choose a query from the suggested results and click Go.
-
By default, search results for Active Now are displayed. From the Date and Time selector, choose the time range to view results for a specific time.
-
The Can query results are displayed in a graphical format.
-
Click Reverse Query to reverse the source and destination entities for a query.
-
Can query results
The Can query determines if the entities can communicate with each other and the health of the connectivity. The Can query results displays information about if source objects can talk to destination objects, which entities can talk to each other, and how do they talk to each other.
Can source objects talk to destination objects
This displays the flow of the traffic and the connectivity between the entities.
Which entities can talk to each other
The default radial view displays if the EPGs can talk to each other and the health of the EPGs. The source EPG is highlighted in light blue whereas the destination EPG is highlighted in dark blue.
The single radial band is used to view the prefixes or EPGs as entities. View enables you to filter the information displayed in the radial view. EPGs displays connectivity information between different EPGs as configured in the APIC policy, while Prefixes displays connectivity information between prefixes as configured in the APIC policy or learnt prefixes.
You can choose different entities under Type to explore the associations between the different objects such as objects, tenants and VRFs. The associations will be displayed using inner and outer radial bands.
-
If you choose EPGs, Tenants, and Both, the outer ring represents the tenants, the inner ring represents the application profiles, and arced lines in the middle show the health of the contracts.
-
If you choose EPGs, VRFs, and Both, the outer ring represents the VRFs, the inner ring represents the bridge domains, and arced lines in the middle show the health of the contracts.
-
If you choose Prefixes and VRFs, and Both, the outer ring represents the VRFs, the inner ring represents the bridge domains or L3Outs, and arced lines in the middle show the health of the contracts.
Health Status allows you to view the healthy and unhealthy connections between the entities.
How do they talk?
This is where you can view the configuration used for communication between the entities and the health of the connectivity. The possible causes for unhealthy connectivity include security violations, forwarding violations, and endpoint violations. In How do they talk?, the results display under Connectivity Table, Policy Table, Forwarding Table, Endpoints Table, and Anomalies table.
-
Connectivity — Displays the source EPG, destination EPG, source prefix, destination prefix, source VRF and destination VRF between the entities.
-
Policy — Displays the security flows between the source and destination. It lists the source EPG, destination EPG, policy enforcement VRF, policy owner (contract), ether type, protocol, source port from, source port to, destination port from, destination port to, TCP rules and rule action. For a non PBR contract, it displays one rule while for a PBR enabled rule, it displays two.
-
Forwarding — Displays the prefix table between the source and destination. You can click Subnet/Route to see information regarding the prefixes.
When you create a PBR, you can configure a BD for the provider/consumer connector of the service node, which allows us to see the service BD and the service BD subnet in addition to the consumer and provider BD information.
-
Endpoints — Displays the endpoint details of the source and destination. For a PBR enabled rule, an additional EPG (service EPG) will be listed with the EPG column and BD column populated.
-
Anomalies — Lists all the anomalies generated from the query. You can click the anomaly to determine the objects in your fabric that are affected by the issue. Pass or fail checks are performed on the anomaly and the suggested steps to resolve the issue are displayed.
Policy-based redirect support for Search and Explore
Starting from Nexus Dashboard 4.1.1, How do they talk? has been enhanced for PBR-enabled contracts.
-
In the permit rule, there is only a direct contract, so there is no PBR. Since no PBR, the columns such as service graph, are hidden and not available in Table configuration options.
-
In the redirect rule, the policy table displays the columns such as service graph instance, redirect IP address, and redirect device information. Additionally, the graph has been enhanced to include the PBR node.
In addition, a Can EPG_A talk to EPG_B query is enhanced for a PBR-enabled contract.
On the Query Results page, you can view this information for a PBR-enabled contract.
-
The Policy table displays the redirect rule from
EPG_A to EPG_Band the permit rule from serviceEPG to EPG_B. -
The Forwarding table also displays subnets from a service EPG.
-
The Endpoint table displays endpoints from a service EPG.
In addition, you can query a service EPG as a regular EPG.
Examples:
-
Can serviceEPG_name talk to regularEPG_name
-
What endpoints are associated with serviceEPG_name
Search and Explore for multi-fabric
The Search and Explore feature in Nexus Dashboard allows network operators to discover assets and their object associations in an easy-to-consume natural language query format. Explore workflows currently support a Can EPG talk to EPG query where the query must include two distinct Orchestration-policy entities to view their connectivity.
After you run assurance analyses against the fabrics in your deployment, you will be able to navigate associations between EPGs, explore EPG to EPG communication, and enable visibility and troubleshooting across fabrics.
Explore provides you with EPG details from your programmed templates or schemas. You can view which EPG entities can communicate. The entities stretch across the fabrics. If there are anomalies raised in these connections, Search and Explore displays those anomalies here.
Currently, only Can EPG to EPG queries are supported for Orchestration assurance. What queries are not supported. For Can EPG to EPG queries, additional filtering based on protocols and port is not supported.
Examples:
-
This is an example of a query that is supported.
Can EPG: uni/tn-secure/ap-AP0/epg-B talk to EPG: uni/tn-secure/ap-AP0/epg-A
-
This is an example of a query that is not supported.
Can EPG: uni/tn-secure/ap-AP0/epg-B talk to EPG: uni/tn-secure/ap-AP0/epg-A on tcp dport: 80
You can choose from the auto-suggested query list of all EPGs within Orchestration-enabled fabrics. You can access Can query results as an aggregated view across all fabrics within Orchestration-enabled fabrics and not per ACI fabric. All queries are across-fabric queries, and the maximum severity of assets and associations across all fabrics is shown in the results.
Guidelines and limitations for multi-fabric
-
After running your query, when you view the Connectivity Table and the Policy Table, in the Source EPG and Destination EPG columns, a shadow tag to an EPG displays if the EPG is a shadow in the corresponding fabric. For example, epgname(shadow). If an EPG is not a shadow, there will be no shadow tag after the EPG name. However, if you have a version of APIC/Orchestration that does not have the shadow annotation, the shadow tag does not display even for shadow EPGs.
-
In the Endpoints, Forwarding, and the Policy tables, you can click a fabric for specific anomaly details.
-
The Anomalies table displays individual, aggregated, or inter-fabric anomalies based on the queries that you have chosen.
Create a Can query in an Orchestration-enabled fabric for inter-fabric connectivity
You must complete running assurance analyses against the fabrics in your Orchestration deployment.
Follow these steps to create a Can query in an Orchestration-enabled fabric for inter-fabric connectivity.
-
Click Search and Explore.
-
To perform a Can query, choose an Orchestration fabric from the drop-down list and start typing can.
-
Once you start typing, Search and Explore displays auto-suggest results. Choose a query from the suggested results and click Go.
-
By default, search results for Active Now are displayed. From the Date and Time selector, choose the time range to view results for a specific time.
-
The can query results are displayed in a graphical format. In the Can source talk to destination area, you can confirm whether a source can talk to a destination.
-
Click Reverse Query to reverse the source and destination entities for a query.
-
In the Which entities Can Talk? area, under View Control, click EPGs to view the communication between the EPGs. The EPG view displays connectivity information between different EPGs.
-
Click the appropriate arrow inside the radial to view further details on the page.
-
In the How do they talk? area, view how the entities communicate with one another.
Can query results
For a Can query, the results are displayed in a radial format in the Which entities can talk area.
The results display if the queried EPGs can communicate with one another. The color of the arrow represents the maximum severity for the connection. If the query results are large, Nexus Dashboard displays the message 'The query returned too much data to display`.
Choose a single resource from the Would you like to check connectivity of a single resource drop-down list to create a specific query. When you click a specific connection in the radial view, you can view the details for the connection in the tables that follow.
You can see the policy that is programmed as part of the EPG. You can verify the prefixes that are part of the connection. You can also view which endpoints are affected because of this communication.
For Orchestration Inter-Fabric Assurance Explore, the Policy, Forwarding, and Endpoints tables display an additional Fabrics column. Nexus Dashboard displays the connectivity information for each fabric that is part of your query. For each of these fabrics, if there are any anomalies that are generated, you can view them here. For example, as a part of the endpoints, if there is a Major anomaly, you can click to choose the anomaly and click Analyze to view the details for the anomaly.
Nexus Dashboard displays the inter-fabric details in the Orchestration context. You can learn what is being programmed by Orchestration across multiple fabrics and you can verify the query and check the communication between different EPGs. The inter-fabric view displays any Orchestration-enabled fabric anomalies.
Configure multi-fabric traffic path tracing and fault correlation
Monitor flows from different fabrics in a single view
To monitor flows, you can stitch together flows from across two different fabrics into one single view. This enables you to have end-to-end views for the paths and end-to-end details for the particular flow with latency information for that flow.
When two sites use different tenants, VRFs, and EPGs, the destination switch processes and exports only the outer packet header for inter-site flows. In VXLAN environments, this means the inner packet header is unavailable for telemetry. Consequently, Nexus Dashboard Insights may display incomplete details for inter-tenant or shadow VRF traffic as this is a limitation and the inner header information for these flows will not appear.
Use cases for multi-fabric traffic path tracing and fault correlation
-
You can correlate flows across fabrics and display flow details with stitched paths.
-
You can monitor flows across fabrics and generate inter-fabric anomalies that are trigger based.
-
You can monitor flows across fabrics and view the end-to-end latency for ACI fabrics.
Configure multi-fabric traffic path tracing and fault correlation
You must have enabled telemetry with the appropriate license tier before configuring the multi-fabric traffic path tracing and fault correlation feature. For more information on how to enable telemetry, see Creating LAN and ACI Fabrics and Fabric Groups. For more information on configuring licensing, see Configuring Licensing.
On the Search and Explore page, you can view the flow path between two ports, their IP addresses, and their VRFs.
Follow these steps to configure multi-fabric traffic path tracing and fault correlation.
-
Navigate to the Search and Explore page. For more information, see Perform a Search and Explore operation.
-
On the Search and Explore page for All online fabrics, enter a query starting with show flows from that includes the source IP address, port number, destination IP address, and destination port number to view the flow path.
Example:
show flows from ip ip-address and port port-number to ip ip-address and port port-number
-
Click Go.
-
In the Query Results > Current drop-down list for Time Selection, choose Date and Time Range and specify a date and time range.
Time Selection has a 15-minute maximum time limit for multi-fabric queries. By default, Nexus Dashboard uses 15 minutes as the time selection. You can view older flows in the past seven days, but the 15-minute restriction still applies.
-
Click Apply.
If Nexus Dashboard finds the queried flow in multiple fabrics, you can pick and choose the source and destination fabric to view the flow information and path.
The Query results area displays the chosen date and time stamp for your query.
Nexus Dashboard search and explore functionality finds and returns all the fabrics where this flow was discovered for the specified IP address in the All returned flows area.
-
In the All returned flows area, choose the appropriate source and destination fabrics to view their aggregated information, flow path summary, flow details, aggregated flow records for each fabric, and anomalies.
-
You must specify which fabric you want as your source and which fabric you want as your destination. Nexus Dashboard stitches the information based on your input. You can only choose one source and one destination at a time to stitch together this information. Based upon your selection of source and destination fabrics, Nexus Dashboard returns the names of the fabrics that it finds.
In the Flow Path Summary area, Nexus Dashboard displays details for the two fabrics as a graphical flow path that displays the end-to-end information, from source to destination. You can see the first fabric with the endpoint and a set of nodes and how it is connected to the second fabric with the second set of nodes followed by the endpoint. The graphical representation also identifies the firewall in the path if a firewall is present. The graph also captures the end-to-end flow path network latency.
When you select source and destination sites for multi-fabric flows, Nexus Dashboard Insights uses Endpoint (EP) and Time-to-Live (TTL) checks to determine the displayed path. However, for Layer 2 and Layer 3 Outside (L3Out) flows, these checks may not function as expected due to limitations. This can result in incorrect or misleading flow path visualizations.
Nexus Dashboard displays specific details for the source and the destination fabrics in each of the flows tables.
On the destination fabric, if egress traffic passes through a sub-interface on a Virtual Interface (VIF), the system exports only the parent interface ID, not the sub-interface ID. As a result, sub-interface level details do not appear in flow reporting within Nexus Dashboard Insights, leading to less granular information.
-
In the Anomalies table, choose Grouped to view the grouped anomalies for your selected flows.