
New and changed information
The following table provides an overview of the significant changes up to this current release. The table does not provide an exhaustive list of all changes or of the new features up to this release.
| Release Version | Feature | Description |
|---|---|---|
|
Nexus Dashboard 4.1.1 |
Improved navigation and workflow for history and logs |
Beginning with Nexus Dashboard 4.1.1, the navigation and workflow for the history and logs feature have been enhanced. |
Understanding history and logs
You can review history and log information in your Nexus Dashboard at several levels:
-
At the upper Nexus Dashboard level: The History and Logs page allows you to see the system-wide list of events and alerts in your Nexus Dashboard cluster. See Review history and logs for your Nexus Dashboard for more information.
-
At the lower fabric levels: The History tab within a configured fabric provides audit logs, deployment history, and policy change history information for that specific fabric. See Review history and logs for a fabric for more information.
Enable history and log settings
To enable history and log setting and set the maximum audit record retention duration for your Nexus Dashboard:
-
Go to Admin > System Settings > General.
-
Under History and logs settings, click Edit.
The History and logs settings dialog box opens.
-
Check the box in the Enable audit logs streaming field to enable that feature, then choose a remote streaming server from the drop-down list.
See Add remote streaming servers for more information on adding remote streaming servers.
-
In the Maximum Number Record Retention duration field, enter the number of months as the duration that you want to have the records retained.
Valid entries are from
1-12. The default duration is 12 months. -
In the Maximum Number of Audit Records field, enter the maximum number of audit records that you want to retain.
Valid entries are from
0-2147483647. The default value for maximum number of audit records is 100K for virtual cluster setup and 500K for a physical cluster.
Review history and logs for your Nexus Dashboard
The History and Logs page allows you to see the system-wide list of audits in your Nexus Dashboard cluster.
View Audit Logs
Nexus Dashboard audit logging, which is automatically enabled when you first deploy the cluster, captures the operational changes made by the users in the environment.
You can view the History and logs by selecting Admin > History and Logs from the main navigation menu. You can also view History and Logs from the Home section of the main navigation menu. To view History and Logs, click View All under Recent Activity.
History and Logs provides this information for the audit logs in your Nexus Dashboard.
| Field | Description |
|---|---|
|
Creation time |
Shows the date and time that the audit log was created. |
|
User |
Shows the user who was logged into the Nexus Dashboard when the audit log was created. |
|
Affected object |
Shows the object that was affected when the audit log was created. |
|
Action performed |
Shows the action that was performed when the audit log was created. |
|
Description |
Shows a description of the audit log. Click the entry in the Description column to display a drawer with additional information. |
|
Fabric name |
Shows the fabric that is associated with the audit log, if applicable. |

The logs are not sorted by default. You can sort the list by clicking on any of the column headings. You can also sort data by choosing time modes like Current, Last, and Date and Time Range.
To filter the list by attribute, provide a specific attribute and value pair in the Filter by attributes field. For any entry in the table, click the funnel icon that appears to the right of that entry to automatically enter the filter attributes for that specific entry.
To filter the list based on time selection, click the clock icon next to History and Logs. Make the appropriate choice in the Mode area that appears:
-
Current: Shows the latest available data.
-
Last…: Choose from these options in the Period area:
-
last 15 minutes
-
last hour
-
last 2 hours
-
last 6 hours
-
last day
-
last week
-
-
Date and Time Range: Choose the date and time range to use to filter the list.
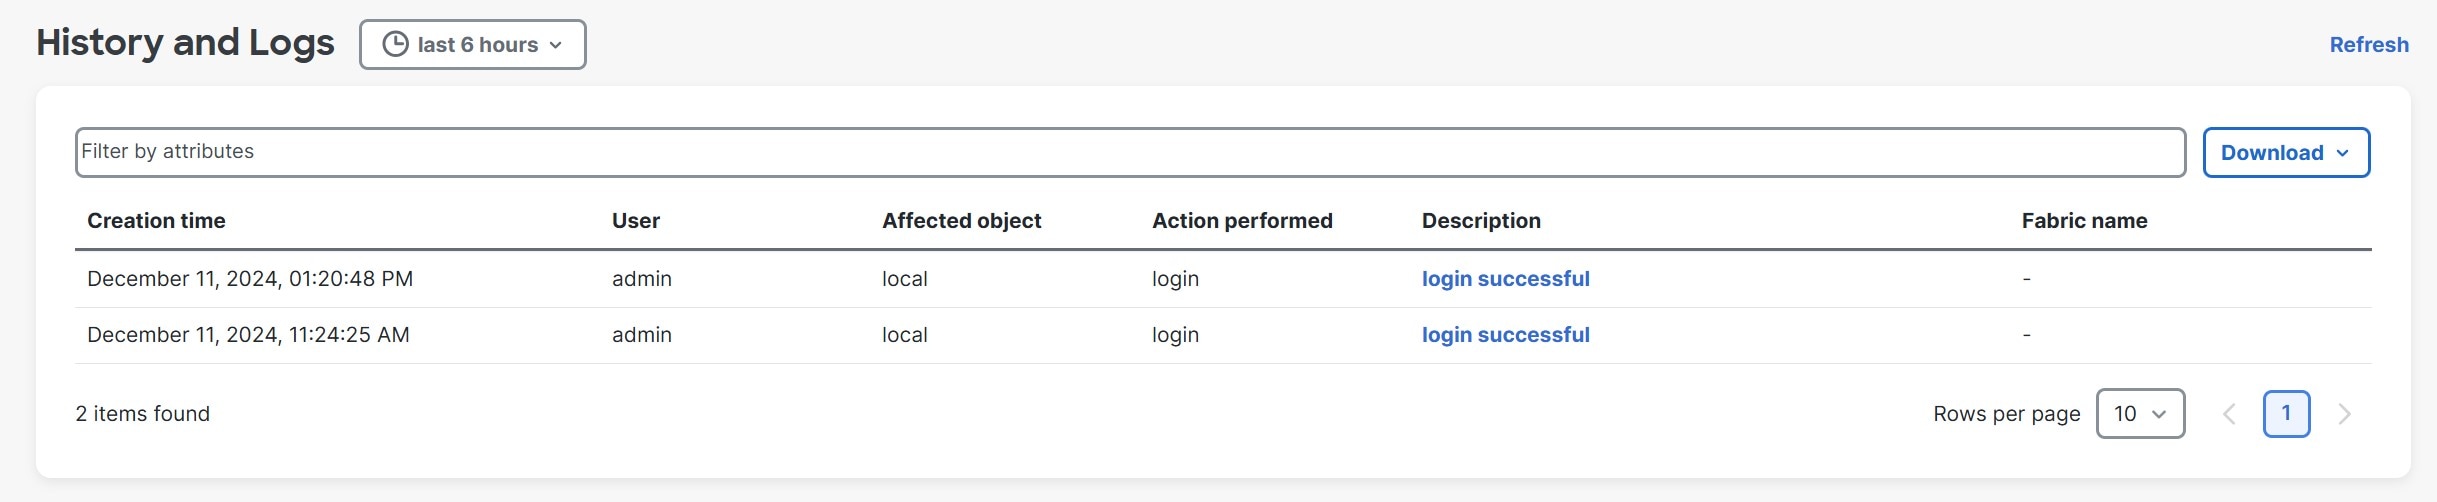
Click Apply after you have made the appropriate choice in this page. The entries in the table are updated based on the choice the you made in the Mode area. The figure below shows example output where last 6 hours is chosen in the Mode area.
To view detailed information about a specific entry, click the link in the Description column to open the Details page for that entry.
Download Audit Logs
In the History and Logs page, click the Download button and choose either Download as CSV or Download as JSON to download audit logs.
The Download as CSV option downloads all audit log data, irrespective of the time selection in the Mode area and attributes filter in the Filter by attributes field.
Review history and logs for a fabric
You can review these history and logs at the fabric level:
View audit logs
Nexus Dashboard audit logging is automatically enabled when you first deploy the cluster, and captures the operational changes made by the users in the environment.
To view the audit logs for a fabric:
-
Navigate to the fabric where you want to view the audit logs:
-
Navigate to the main Fabrics page:
Manage > Fabrics
-
Single-click on the fabric where you want to view the audit logs.
The Overview page for that fabric appears.
-
-
Click the History tab.
-
Click the Audit Logs subtab.
These fields appear in the Audit Logs page.
-
The logs are not sorted by default; you can sort the list by clicking on any of the column headings.
-
You can choose to filter the list using the Filter by attributes field and providing a specific attribute and value pair.
Field Description Creation Time
Provides the date and time when an action was performed.
User
Provides information on the user who performed an action.
Resource
Provides information on the resource where an action was performed.
Action Performed
Describes what action was performed.
Description
Provides a description of the action that was performed.
Fabric Name
Provides information on the fabric name where an action was performed.
You can also perform these actions in this page.
Action Description Download > Download as CSV
Click to download the audit log information to a CSV file.
Download > Download as JSON
Click to download the audit log information to a JSON file.
-
When you create anomaly alert rules, any updates to anomalies will not be recorded in the audit logs.
View deployment history
Deployment history of the switches and networks that are involved in the selected service policy or route peering are displayed in the Deployment History tab. The deployment history captures the changes that are pushed or deployed from Nexus Dashboard to the switches. The deployment history captures the changes that are pushed or deployed from Nexus Dashboard to the switches.
To view the deployment history for a fabric:
-
Navigate to the fabric where you want to view the deployment history:
-
Navigate to the main Fabrics window:
Manage > Fabrics
-
Single-click on the fabric where you want to view the deployment history.
The Overview window for that fabric appears.
-
-
Click the History tab.
-
Click the Deployment History subtab.
This table describes the fields that appear on this page.
Field Description Hostname
Specifies the host name of the entity.
Entity Name
Specifies the entity name.
Entity Type
Specifies the entity type.
Source
Specifies the source of the deployment on the entity.
Commands
Click the link in the Commands column to bring up a window that displays the command execution details for the entity.
Status
Specifies the status of the host.
Serial Number
Specifies the serial number of the entity.
Status Description
Specifies the deployment status on the entity.
User
Specifies the user who performed the deployment on the entity.
Time of Completion
Specifies the timestamp of the deployment.
In certain scenarios after deploying configurations on a switch, the Status column displays the following error indicating a failure:
Deployment Failed to execute job for this device with "Reason: dcnm-sim-agent-xx expired.
However, the Config Status in Manage > Inventory > Switches page displays In-Sync. The reason for a conflicting status is due to inter-node connectivity issue that causes the keep alives between the sim-agent and the sim-master to fail, resulting in an agent expiry event, whereas the sim-agent is alive and deploying the configuration on the switch. No further action is required from you for this error.
View policy change history
Different users can simultaneously change expected configuration of switches in the Nexus Dashboard. You can view the history of policy changes in the Policy Change History tab.
To view the policy change history for a fabric:
-
Navigate to the fabric where you want to view the policy change history:
-
Navigate to the main Fabrics window:
Manage > Fabrics
-
Single-click on the fabric where you want to view the policy change history.
The Overview page for that fabric appears.
-
-
Click the History tab.
-
Click the Policy Change History subtab.
This table describes the fields that appear on this page.
Field Description Template
Specifies the template that was used in the policy change.
Description
Specifies the description of the policy change.
Content Type
Specifies the content type for the policy change.
Operations
Specifies the Policy Template Instances (PTIs).
Generated Config
Specifies the configuration history for the policy change. Click Detailed History, if available, to view the configuration history for the policy change.
Entity Name
Specifies the entity name where the policy change was performed.
Entity Type
Specifies the entity type where the policy change was performed.
Source
Specifies the source of the policy change.
Priority
Specifies the priority value of the policy change.
Policy ID
Specifies the policy ID of the policy change.
Host Name
Specifies the host name where the policy change was performed.
Created On
Specifies that date on which the policy was created.
Serial Number
Specifies the serial number where the policy change was performed.
User
Specifies the user who performed the policy change.
Add remote streaming servers
You might need remote streaming servers to be configured when you deal with various areas in Nexus Dashboard, such as tech support, anomalies, and history and logs.
To add remote streaming servers:
-
Choose Admin > System Settings.
The General tab is selected by default.
-
Locate the Remote streaming servers tile and click Edit.
A table showing any already-configured remote streaming servers appears.
-
Click Add Server.
The Add Server dialog box opens.
-
Determine the service where you want to add remote streaming servers.
Splunk
-
In the Protocol field, choose HTTP or HTTPS based on the Splunk URL that you use.
For example:
-
Choose HTTP, if your login URL is
http://splunk.mycompany.com:8000. -
Choose HTTPS, if your login URL is
https://mycompany.splunkcloud.com/,https://mycompany.splunkcloud.com:443, orhttps://splunk.mycompany.com.
Before enabling HTTP or HTTPS, you must upload the CA certificate for the Splunk destination host to Nexus Dashboard.
-
-
Enter a name for the Splunk remote streaming server in the Name field.
-
In the Hostname/IP Address, enter the hostname or IP address.
-
In the Port field, enter the HTTP event collector (HEC) port number.
The HEC port number for Splunk deployments over HTTP or HTTPS protocols can be one of the following:
-
8088 on Splunk Cloud free trials
-
443 by default on Splunk Cloud Platform instances
-
-
In the Token field, enter the HEC token.
For more information on Splunk deployment guidelines, see the https://docs.splunk.com/Documentation/Splunk/9.4.0/Data/UsetheHTTPEventCollector [Set up and use HTTP Event Collector in Splunk Web].
-
In the Index field, enter the necessary index information for the Splunk remote streaming server.
The index details on the Nexus Dashboard should match with the Splunk index.
-
Click Save in the Add Server page.
You are returned to the Remote streaming server page.
-
In the Remote streaming server page, click Add Server to add another remote streaming server or click Save to save the configured remote streaming servers.
Syslog
-
In the Protocol field, choose either TCP or UDP.
-
Enter a name for the Syslog remote streaming server in the Name field.
-
In the Hostname/IP Address and Port fields, enter the hostname or IP address and port details.
-
Check the box next to the TLS field to enable this option.
Before enabling TLS, you must upload the CA certificate for the Syslog destination host to Nexus Dashboard. See Managing Certificates in your Nexus Dashboard for more information.
-
Click Save in the Add Server page.
You are returned to the Remote streaming server page.
-
In the Remote streaming server page, click Add Server to add another remote streaming server or click Save to save the configured remote streaming servers.
The CA certificate you upload is used to sign the certificate that Splunk and Syslog uses. The certificate for Splunk and Syslog should contain the IP address or DNS name in the Subject Alternative Name (SAN) section.