Troubleshooting Platform Health Issues

This chapter contains the following sections:

Downloading System Logs

This section describes how to generate a troubleshooting report and infrastructure logs file for all the schemas, sites, tenants, and users that are managed by Cisco ACI Multi-Site Orchestrator.

Procedure


Step 1

Log in to your Multi-Site Orchestrator GUI.

Step 2

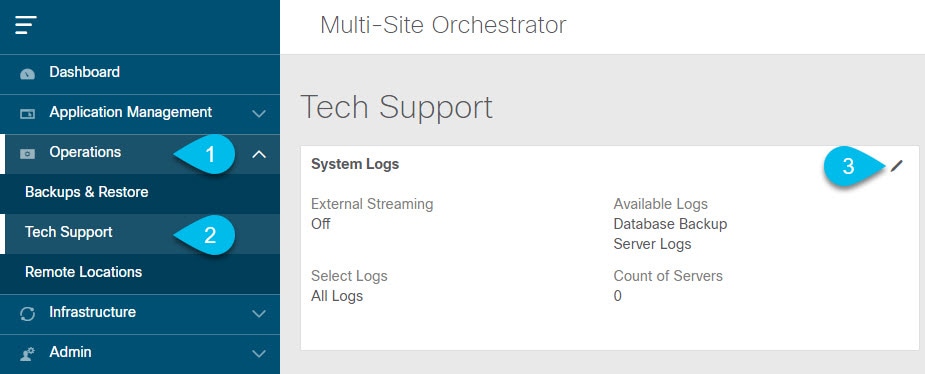
Open the System Logs screen.

  1. In the main menu, select Operations > Tech Support.

  2. In the top right corner of the System Logs frame, click the edit button.

Step 3

Download the logs.

  1. Select which logs you want to download.

  2. Click the Download button.

    An archive of the selected items will be downloaded to your system. The report contains the following information:

    • All schemas in JSON format

    • All sites definitions in JSON format

    • All tenants definitions in JSON format

    • All users definitions in JSON format

    • All logs of the containers in the infra_logs.txt file


Gathering Docker Container Information

You can log in to one of the Orchestrator VMs and gather information about the Docker services and its logs for specific containers. A number of useful Docker commands is available from the following cheat sheet: https://www.docker.com/sites/default/files/Docker_CheatSheet_08.09.2016_0.pdf.

Inspecting the Health of Docker Containers

To inspect the health of Docker services, you can use the docker service ls command. The output of the command lists the current health status of each service. All services should have all containers replicated as displayed in the REPLICAS column. If any one of them is down, there may be issues that need to be addressed.

# docker service ls
ID                  NAME                      MODE                REPLICAS  [...]
ve5m9lwb1qc4        msc_auditservice          replicated          1/1       [...]
bl0op2eli7bp        msc_authyldapservice      replicated          1/1       [...]
uxc6pgzficls        msc_authytacacsservice    replicated          1/1       [...]
qcws6ta7abwo        msc_backupservice         global              3/3       [...]
r4p3opyf5dkm        msc_cloudsecservice       replicated          1/1       [...]
xrm0c9vof3r8        msc_consistencyservice    replicated          1/1       [...]
le4gy9kov7ey        msc_endpointservice       replicated          1/1       [...]
micd93h5gj97        msc_executionengine       replicated          1/1       [...]
6wxh4mgnnfi9        msc_jobschedulerservice   replicated          1/1       [...]
lrj1764xw91g        msc_kong                  global              3/3       [...]
n351htjnks75        msc_kongdb                replicated          1/1       [...]
xcikdpx9o3i6        msc_mongodb1              replicated          1/1       [...]
u9b9ihxxnztn        msc_mongodb2              replicated          1/1       [...]
m0byoou6zuv5        msc_mongodb3              replicated          1/1       [...]
logqawe8k3cg        msc_platformservice       global              3/3       [...]
m3sxof6odn74        msc_schemaservice         global              3/3       [...]
3wd4zrqf6kbk        msc_siteservice           global              3/3       [...]
ourza0yho7ei        msc_syncengine            global              3/3       [...]
ojb8jkkrawqr        msc_ui                    global              3/3       [...]
zm94hzmzzelg        msc_userservice           global              3/3       [...]

Getting Container IDs

You can get the list of all running container IDs using the docker ps command.

# docker ps
CONTAINER ID    IMAGE                        COMMAND                  [...]
05f75d088dd1    msc-ui:2.1.2g                "/nginx.sh"              [...]
0ec142fc639e    msc-authyldap:v.4.0.6        "/app/authyldap.bin"     [...]
b08d78533b3b    msc-cloudsecservice:2.1.2g   "bin/cloudsecservice"    [...]
685f54b70a0d    msc-executionengine:2.1.2g   "bin/executionengine"    [...]
0c719107adce    msc-schemaservice:2.1.2g     "bin/schemaservice"      [...]
f2e3d144738c    msc-userservice:2.1.2g       "bin/userservice"        [...]
edd0d4604e27    msc-syncengine:2.1.2g        "bin/syncengine"         [...]
001616674a00    msc-siteservice:2.1.2g       "bin/siteservice"        [...]
7b30c61f8aa7    msc-platformservice:2.1.2g   "bin/platformservice"    [...]
d02923992d77    msc-backupservice:2.1.2g     "bin/backupservice"      [...]
9de72d291aaa    msc-kong:2.1.2g              "/docker-entrypoint.…"   [...]
6135f9de5dd2    msc-mongo:3.6                "sh -c 'sleep 3 && e…"   [...]

You can get the running container ID for a specific service using the docker ps | grep <service-name> command.

# docker ps | grep executionengine
685f54b70a0d    msc-executionengine:2.1.2g   "bin/executionengine"    [...]

To get all container IDs for a service, including the ones that are exited, you can use the docker ps –a | grep <service-name> command.

# docker ps -a | grep executionengine
685f54b70a0d    msc-executionengine:2.1.2g   "bin/executionengine"    Up 2 weeks (healthy)
3870d8031491    msc-executionengine:2.1.2g   "bin/executionengine"    Exited (143) 2 weeks ago

Viewing Container Logs

Use the docker logs <container-id> command to view the logs for a container. The logs for a container could be large as there are many files to be transferred, so consider your network speed when you run the command.

The sample location of the log files for a container is /var/lib/docker/containers/<container> There can be multiple <container>-json.log files.

# cd /var/lib/docker/containers
# ls -al
total 140
drwx------. 47 root root 4096 Jul  9 14:25 .
drwx--x--x. 14 root root 4096 May  7 08:31 ..
drwx------.  4 root root 4096 Jun 24 09:58 051cf8e374dd9a3a550ba07a2145b92c6065eb1071060abee12743c579e5472e
drwx------.  4 root root 4096 Jul 11 12:20 0eb27524421c2ca0934cec67feb52c53c0e7ec19232fe9c096e9f8de37221ac3
[...]
# cd 051cf8e374dd9a3a550ba07a2145b92c6065eb1071060abee12743c579e5472e/
# ls -al
total 48
drwx------.  4 root root 4096 Jun 24 09:58 .
drwx------. 47 root root 4096 Jul  9 14:25 ..
-rw-r-----.  1 root root 4572 Jun 24 09:58 051cf8e374dd9a3a550ba07a2145b92c6065eb1071060abee12743c579e5472e-json.log
drwx------.  2 root root    6 Jun 24 09:58 checkpoints
-rw-------.  1 root root 4324 Jun 24 09:58 config.v2.json
-rw-r--r--.  1 root root 1200 Jun 24 09:58 hostconfig.json
-rw-r--r--.  1 root root   13 Jun 24 09:58 hostname
-rw-r--r--.  1 root root  173 Jun 24 09:58 hosts
drwx------.  3 root root   16 Jun 24 09:58 mounts
-rw-r--r--.  1 root root   38 Jun 24 09:58 resolv.conf
-rw-r--r--.  1 root root   71 Jun 24 09:58 resolv.conf.hash

Viewing Docker Networks

You can view the list of networks used by Docker using the docker network list command.

# docker network list
NETWORK ID          NAME                DRIVER              SCOPE
c0ab476dfb0a        bridge              bridge              local
79f5e2d63623        docker_gwbridge     bridge              local
dee475371fcb        host                host                local
99t2hdts7et0        ingress             overlay             swarm
588qhaj3mrj1        msc_msc             overlay             swarm
a68901087366        none                null                local

Removing Stale Docker Containers

Typically, when you perform a Multi-Site Orchestrator upgrade, the upgrade process removes any old docker containers that are replaced by a newer version from the upgrade. However, during normal Docker operation containers may be stopped, for example if a service fails, and new containers may be created to replace them. These stopped containers remain in the system until they are removed by the next upgrade.

If for any reason you want to manually remove any stale containers, you can use the instructions in this section to collect the container logs and remove the containers.

Procedure


Step 1

Check if there are any stale containers in the system.

We recommend doing manual container removal only if you see an excessive number of stale containers in the system. If there are only a few or no stopped containers, we recommend leaving them to be removed by the next upgrade process.

You can check for any stale containers by running the docker ps -a command and checking for any containers with Exited status, for example:

# docker ps -a
CONTAINER ID    IMAGE                              COMMAND                  CREATED         STATUS
5bd87a6a6813    [...]/msc-kong:3.0.1i              "/docker-entrypoint.…"   23 hours ago    Up 23 hours (healthy)
bf73df31ff51    [...]/msc-ui:3.0.1i                "/nginx.sh"              25 hours ago    Up 25 hours (healthy)
77c96b515e63    [...]/msc-ui:3.0.1i                "/nginx.sh"              25 hours ago    Exited (1) 25 hours ago
dfedfd82233a    [...]/msc-ui:3.0.1i                "/nginx.sh"              25 hours ago    Exited (1) 25 hours ago
d70aa6262396    [...]/msc-kong:3.0.1i              "/docker-entrypoint.…"   25 hours ago    Exited (143) 23 hours ago
7c15db4db6eb    [...]/msc-endpointservice:3.0.1i   "python3 main.py"        25 hours ago    Up 25 hours (healthy)
Step 2

Collect system logs using the Orchestrator GUI.

Removing inactive Docker containers also removes any logs associated with them. If you do choose to manually clean up old containers, we recommend first collecting and saving the logs in case you may need them later.

Collecting system logs is described in Downloading System Logs.

Step 3

Log in to one of the nodes and execute the following commands to remove stale containers.

  1. Ensure that the exited containers are stopped.

    # docker ps --filter "status=exited" --format '{{.ID}}' | xargs --no-run-if-empty docker container stop
  2. Remove the containers.

    # docker ps --filter "status=exited" --format '{{.ID}}' | xargs --no-run-if-empty docker container rm -f
    # docker container prune -f
Step 4

Repeat the previous step for the other two nodes.


Troubleshooting Missing Node Labels

If you cannot log in to your Multi-Site Orchestrator GUI, but the Orchestrator nodes are still reachable via SSH, one of the nodes may have lost its label. This section describes how to diagnose this issue and resolve it by re-applying the proper node label.

Procedure


Step 1

Log in to one of the Multi-Site Orchestrator nodes via SSH.

You can log in to any one of the nodes.

Step 2

Check if the MongoDB containers are properly replicated on all nodes.

# docker service ls
ID                  NAME              MODE            REPLICAS    IMAGE
[...]
jvztl0waek4c        msc_mongodb1      replicated      1/1         msc-mongo:3.6
x1tkpwf1q1df        msc_mongodb2      replicated      1/1         msc-mongo:3.6
zbi376btmjbg        msc_mongodb3      replicated      0/1         msc-mongo:3.6
[...]

In the above output, you can see that the MongoDB container is not properly replicated on one of the nodes.

Step 3

Find the hostnames of all the nodes.

# docker node ls
ID                            HOSTNAME    STATUS      AVAILABILITY    MANAGER STATUS  ENGINE VERSION
z3b6sqc38gfgoerte8cx1w17r     node1       Ready       Active          Reachable       18.06.1-ce
mb3hqe1g0r55oa2zoe32yyfiw *   node2       Ready       Active          Leader          18.06.1-ce
ur5vq2gli8zfc8ngafjn8plej     node3       Ready       Active          Reachable       18.06.1-ce
Step 4

Inspect each node.

Repeat the following command for each node, replacing <node-name> with the hostname of the node from the previous step.

# docker inspect <node-name>

Example:

# docker inspect node3
[
    {
        "ID": "ur5vq2gli8zfc8ngafjn8plej",
        "Version": {
            "Index": 317093
        },
        "CreatedAt": "2018-01-19T11:00:41.522951756Z",
        "UpdatedAt": "2019-03-17T07:38:35.487509349Z",
        "Spec": {
            "Labels": {},
            "Role": "manager",
            "Availability": "active"
        },
[...]

If one or more nodes are missing a label, the Labels field will be empty.

Step 5

Restore the missing label for the node.

In the following command:

  • Replace <node-label> with the label appropriate for the node.

    While the hostname of each node can be customized, the labels must be msc-node1, msc-node2, or msc-node3.

  • Replace <node-name> with the hostname of the node that is missing a label.

# docker node update --label-add "msc-node=<node-label>" <node-name>

Example:

# docker node update --label-add "msc-node=msc-node3" node3
Step 6

Verify that the label was added correctly.

# docker inspect node3
[
    {
        "ID": "ur5vq2gli8zfc8ngafjn8plej",
        "Version": {
            "Index": 317093
        },
        "CreatedAt": "2018-01-19T11:00:41.522951756Z",
        "UpdatedAt": "2019-03-17T07:38:35.487509349Z",
        "Spec": {
            "Labels": {
                "msc-node": "msc-node3"
            },
            "Role": "manager",
            "Availability": "active"
        },
[...]

Troubleshooting Intersite Packet Flow in a Stretched BD Network

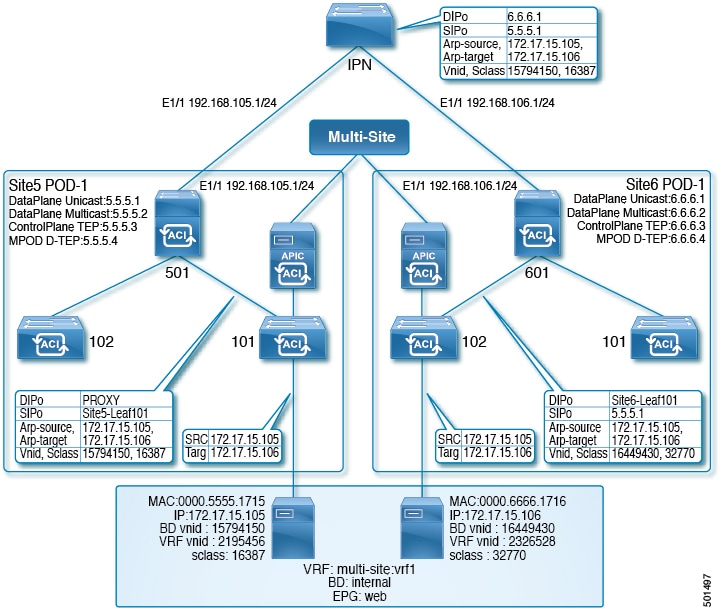
Figure 1 shows a stretched bridge domain (BD) network with Layer 2 Broadcast extension between sites. The BD is an L3 BD with ARP flood enabled, using L2 Unknown Unicast Proxy.

Figure 1. Intersite ARP Flow

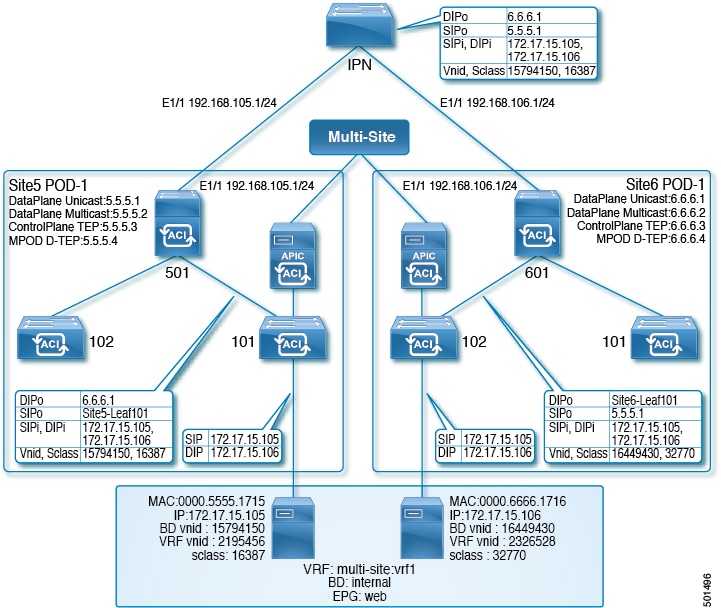
Figrue 2 shows the same stretched BD network with focus on the unicast packet flow.

Figure 2. Intersite Unicast Flow

When the site5 host at 172.17.15.105 sends a unicast packet (for example, an ICMP echo) towards the site6 host with IP address 172.17.15.106, the following troubleshooting steps apply to the scenario, in which Site5-leaf101 has learned the site6 endpoint (EP), 172.17.15.106. If site5-leaf101 has not learned the site6 EP, it either floods the packet or sends spine501 data for proxy, based on the BD's Layer 2 unknown unicast forward settings.

Procedure


Step 1

On the site5 ingress leaf switch (leaf101 in this case), use the NX-OS style CLI show endpoint mac mac-address command to determine whether the system has learned both the source and destination EP, as in the following example:

Example:

leaf101# show endpoint mac 0000.6666.1716
Legend:
s - arp              O - peer-attached    a - local-aged       S - static
V - vpc-attached     p - peer-aged        M - span             L - local
B - bounce           H - vtep
+-----------------+---------------+-----------------+--------------+-------------+
      VLAN/         Encap           MAC Address       MAC Info/       Interface
      Domain        VLAN            IP Address        IP Info
+-----------------+---------------+-----------------+--------------+-------------+
3                    vlan-201       0000.6666.1716 L                 eth1/40
msite-site:vrf1      vlan-201       172.17.15.106 L                  eth1/40
Step 2

If both the local and remote EPs have been learned, and the policy permits the EPs to communicate (using the default contract permitting intra-EPG traffic), site5-leaf101 encapsulates the ICMP packet with the following data, and forwards the packet out through the fabric uplink port towards the spine switch:

  • VXLAN header's outer destination IP address, 6.6.6.1

  • VXLAN ID (VNID), 15794150

  • src-class (sclass), 16387

  • Source IP address, which is the site5-leaf101 TEP address through the VRF overlay-1

When the spine switch receives a packet from the VRF overlay-1, it verifies that the destination IP address (DIP) belongs to the MAC proxy address. For example, if the DIP 6.6.6.1 does not belong to the MAC proxy address of spine501, the spine switch forwards the packet like a normal IP packet, based on the longest match in the routing table. In this case, since the DIP matches a remote site's spine overlay unciast TEP address, spine501 rewrites the outer source IP (SIP) address from site5-leaf101's TEP to site5's unicast overlay unicast TEP (5.5.5.1). In this process, Spine501 should have learnt 6.6.6.1 through OSPF in the interpod network (IPN), so spine501 forwards the packet to the next hop,which is the IPN switch in this case.

Step 3

If there is a concern about the packet being forwarded, run ERSPAN in fabric mode on the APIC, in the NX-OS style CLI, to capture the outgoing packet from the uplink interface, using commands such as in the following example.

Example:

This example configures Fabric ERSPAN to capture outgoing packets from switch 101, interface eth1/1, with focus on VRF vrf1, and BD bd1, in tenant t1.

apic1# configure terminal 
apic1(config)# monitor access session mySession
apic1(config-monitor-fabric)# description "This is my fabric ERSPAN session"
apic1(config-monitor-fabric)# destination tenant t1 application app1 epg epg1 destination-ip 192.0.20.123 source-ip-prefix 10.0.20.1
apic1(config-monitor-fabric-dest)# erspan-id 100
apic1(config-monitor-fabric-dest)# ip dscp 42
apic1(config-monitor-fabric-dest)# ip ttl 16
apic1(config-monitor-fabric-dest)# mtu 9216
apic1(config-monitor-fabric-dest)# exit
apic1(config-monitor-fabric)# source interface eth 1/1 switch 101
apic1(config-monitor-fabric-source)# direction tx
apic1(config-monitor-fabric-source)# filter tenant t1 bd bd1
apic1(config-monitor-fabric-source)# filter tenant t1 vrf vrf1
apic1(config-monitor-fabric-source)# exit
apic1(config-monitor-fabric)# no shut

For more information, see Configuring SPAN in Cisco APIC NX-OS Style Command-Line Interface Configuration Guide.

Step 4

To verify whether the routing table contains an explicit entry for 6.6.6.1, use the NX-OS style command, show ip route 6.6.6.1 vrf overlay-1.

Step 5

When the next-hop interface has been found, use the show lldp neighbor command to determine whether the next hop of the interface , where 6.6.6.1 is learned from, is the expected IPN interface.

Use the Fabric ERSPAN to confirm that spine501 has recieved the packet from the leaf switch or forwarded it through the correct egress interface.

Step 6

When the packet arrives at IPN, because it is a unicast packet, IPN forwards the IP packet based on the routing table. To confirm the routing table has the correct/expected next-hop interface, use the command show ip route 6.6.6.1.

Use Fabric ERSPAN to capture one packet or a multiple packets from different interfaces. The next-hop interface from IPN in the topology above is spine601's interface.

If the packet arrvies at the site6 switch, spine601, it maps the remote site's ID based on the outer SIP, 5.5.5.1 to site5, together with the source VNID to 15794150. Also, spine601 translates that VNID to the VNID of the local BD,16449430, and translates the src-class ID, 16387, to the local EP src-clas, 32770. Then it performs a look up based on the destination-MAC address, within the scope of the translated VNID.

Step 7

To verify the VNID translation bewteen site5 and site6, on spine601 enter the show dcimgr repo vnid-maps verbose command.

Step 8

To verify the sclass translation between site5 and site6, on spine601 enter the show dcimgr repo sclass-maps command.

Finally, spine601 rewrites the outer destination to the TEP of site6-leaf101 and forwards the packet there.

Step 9

To determine if the packet was forwarded properly, go to the expected leaf switch (site6-leaf101) run Fabric ERSPAN to capture the packet.

Step 10

If the packet arrives at site6-leaf101, leaf101 performs a local lookup, based on the destination MAC within the scope of VNID, 16449430, to determine the egress interface. To determine the egress interface, enter the show endpoint mac mac-address command.

Step 11

To determine if the packet was forwarded properly, use access SPAN to capture the outgoing packet on the expected interface, using commands such as in the following example.

Example:

This example configures SPAN in access mode to capture packets being sent on leaf 101, interface eth1/2, with focus on EPG epg1 in tenant t1.

apic1# configure terminal 
apic1(config)# monitor access session mySession
apic1(config-monitor-access)# description "This is my SPAN session"
apic1(config-monitor-access)# destination interface eth 1/2 leaf 101
apic1(config-monitor-access)# source interface eth 1/1 leaf 101
apic1(config-monitor-access-source)# direction tx
apic1(config-monitor-access-source)# filter tenant t1 application app1 epg epg1
apic1(config-monitor-access-source)# exit
apic1(config-monitor-access)# no shut
apic1(config-monitor-access)# show run

This is the traditional SPAN configuration, local to an Access leaf node. Traffic originating from one or more access ports or port-channels can be monitored and sent to a destination port local to the same leaf node.

In the ACI fabric, you can also use an access mode ERSPAN configuration to monitor traffic originating from access ports, port-channels, and vPCs in one or more leaf nodes. For an ERSPAN session, the destination is always an EPG which can be deployed anywhere in the fabric. The monitored traffic is forwarded to the destination wherever the EPG is moved.

For more information, see Configuring SPAN in Cisco APIC NX-OS Style Command-Line Interface Configuration Guide.


Troubleshooting Inter-Site BGP Sessions

For Multi-Site BGP sessions to be established on site spine switches, the following settings are required:

  • The update source should have the mscp-etep flag set

  • The BGP peer type should be inter-site

  • The node role should be msite-speaker

To troubleshoot inter-site BGP session failures, verify the following MOs on the spines, using Visore:

  • fvNodeDef

  • bgpInfraPeerDef

  • bgpAsP

  • fvIntersitePeeringDef

  • l3extIntersiteLoopBackIfPDef

  • l3LbRtdIf with type set to inter-site

  • LoopBackId

  • ipv4If with the same loopback ID has the modeExtn property set to mscp-etep

If any of these MOs are missing, the BGP sessions do not come up.

For information about entering queries using Visore, see Accessing REST API Tools in Using the REST API in the Cisco APIC REST API Configuration Guide.


Note

Visore is supported on the Firefox, Chrome, and Safari browsers.


Procedure


Step 1

In a supported browser, enter the URL of the spine switch followed by /visore.html, as in the following example:

Example:

https://spine-ip-address/visore.html
Step 2

When prompted, log in using the same credentials you would use to log in to the spine CLI interface.

Step 3

Enter a query for l3LbRtdIf to verify that the type is inter-site.

Step 4

Enter a query for Ipv4IF to verify that the mode is cp-etep and the modeExtn is mscp-etep.

Step 5

Enter a query for Intersite BgpPeers to verify it was created with the inter-site type and uses the CP-TEP loopback address as the source interface.

Step 6

If any of these values is incorrect, go to the APIC for the site and correct the values. Return to the Sites tab in Multi-Site and click CONFIGURE INFRA, and then click Apply.


Recovering from BGP Connectivity Loss After Spine Switch Recommission

When you decommission and recommission a multi-site spine switch in one of the fabrics without removing it from the APIC, the external BGP peering is turned off and may remain disabled on the switch. This BGP peering is required by the Multi-Site Orchestrator for inter-site communication.

This section describes how to re-establish BGP peering by loading the latest site connectivity information and re-deploying the Infra configuration to the site in case it is required..

Procedure


Step 1

Log in to the Cisco ACI Multi-Site Orchestrator GUI.

Step 2

Refresh site connectivity information.

  1. In the Main menu, select Infrastructure > Infra Configuration.

  2. In the top right of the main Infra Configuration view, click the Configure Infra button.

  3. In the left pane, under Sites, select the site with the recommissioned spine switch.

  4. In the main window, click the Reload Site Data button to pull fabric information from the APIC.

  5. In the Confirmation dialog, ensure that you check the Remove config for decommissioned spine nodes checkbox.

    When you select the checkbox, the old configuration information for the decommissioned spine switch will be removed from the Multi-Site Orchestrator database.

  6. Finally, click Yes to confirm and load the connectivity information.

    This will update the site connectivity information including the recommissioned switch by re-importing it from the APIC.

Step 3

Verify spine switches configuration.

Select the spine switches in the site you refreshed in the previous step and verify that all configuration is correct.

If you need to update any information, detailed instructions on spine switch Infra configuration are available in the "Infrastructure Management" chapter of the Cisco ACI Multi-Site Configuration Guide.

Step 4

In the top right of the main Fabric Connectivity Infra view, click the Deploy button.

If you have cloud sites in your Multi-Site deployment, you will have multiple options available here. Since you are updating on-premises sites only for the recommissioned switch, simply click Deploy to deploy the Infra configuration to that site.


Troubleshooting Unicast or Multicast Traffic Failures

Use these steps in Visore to troubleshoot inter-site Unicast and Multicast traffic failures.

For information about entering queries using Visore, see Accessing REST API Tools in Using the REST API in the Cisco APIC REST API Configuration Guide.


Note

Visore is supported on the Firefox, Chrome, and Safari browsers.


Procedure


Step 1

Browse to the spine switch's Visore page.

https://<spine-ip-address>/visore.html
Step 2

Log in using the same credentials you would use to log in to the spine CLI interface.

Step 3

Enter a query to verify the fvIntersiteConnPDef and fvIntersiteMcastConnPDef MOs are under fvSiteConnPDef.

These are the remote site unicast and multicast DP TEPs.

Step 4

Enter a query to verify that the tunnelIf MO was created with the type dci-ucast or dci-mcast-hrep, and the destination is the same as the remote site DP TEPs.

Step 5

Check the local site unicast and multicast DP TEPs. Enter a query for fvIntersiteConnPDef under fvPodConnPDef and fvIntersiteMcastConnPDef under fvFabricExtConnPDef.

Step 6

Enter a query for the SiteLocal ipv4If MOs to verify they were created with the mode dci-ucast and dci-mcast-hrep and the ipv4Addr MO was configured under it with the same address as the DP TEP's.

Step 7

If any of these values is incorrect, go to the APIC for the site and correct the values. Return to the Sites tab in Multi-Site and click CONFIGURE INFRA, and then click Apply.


Troubleshooting Multi-Site Multicast Functionality

This task provides the steps for troubleshooting the Multi-Site multicast functionality in a stretched bridge domain (BD) use case. This topic assumes that the L2STRETCH and INTERSITEBUMTRAFFICALLOW options are enabled in the stretched BD.

Multicast traffic flows between sites in the following process:

  • TX (Sending) from local to remote site

    The Group IP Outer address (GIPo) traffic (part of Layer 2 Broadcast, Unknown Unicast, Multicast traffic) from the local site is Head-End Replicated (HREP) to each remote site from the Spine switch. The Destination IP address of the outer header (DIPo) is rewritten to a unicast address called as Multicast HREP TEP IP (also called Multicast DP-TEP IP) of the remote site. The Source IP address of the outer header (SIPo) is rewritten with the Unicast ETEP IP.

  • RX (Receiving) by remote from local site

    Incoming traffic destined to the local site Multicast HREP TEP IP address is translated. The APIC on the site derives the local site BD-GIPo from that data, and follows the regular GIPo lookup path from then on.

To troubleshoot problems in this process, log on to the spine switch CLIs and use the following steps:

Procedure


Step 1

To verify the locally configured Multi-Site TEP IP addresses, log on to the Supervisor module, and enter a command such as the following example:

Example:

swmp11-spine6# show ip interface vrf overlay-1 
loopback11, Interface status: protocol-up/link-up/admin-up, iod: 126, mode: dci-ucast, vrf_vnid: 16777199
  IP address: 33.20.1.1, IP subnet: 33.20.1.1/32
  IP primary address route-preference: 1, tag: 0
loopback12, Interface status: protocol-up/link-up/admin-up, iod: 127, mode: mcast-hrep, vrf_vnid: 16777199
  IP address: 33.30.1.1, IP subnet: 33.30.1.1/32
Step 2

To confirm the MFDM on the spine switch, log on to the Supervisor module and enter a command such as the following example:

Example:

swmp11-spine6# show forwarding distribution multicast hrep
MFDM HREP NODE TABLE
--------------------
IP Address: 0xb1e0101
Table Id: 2
Flags: 0x0
IfIndex: 0x18010009
Internal BD 0x1001
Internal encap 0xb54
Nexthop Information: (num: 5)
Address               Ifindex                   Dvif
0x14950a02        0x1a018019        0x1eb (Selected)  <== Selected NH to reach the HREP TEP IP
0x14950602        0x1a00e00f        0x0
0x14950802        0x1a010011        0x0
0x14950902        0x1a011012        0x0
0x14950b02        0x1a01901a        0x0
Step 3

To verify HREP TEP IP address reachability, log on to the Supervisor module, and enter a command such as the following example:

Example:

swmp11-spine6# show ip route 11.30.1.1 vrf overlay-1
11.30.1.1/32, ubest/mbest: 5/0
    *via 20.149.6.2, Eth1/15.15, [110/9], 1d21h, ospf-default, intra
    *via 20.149.8.2, Eth1/17.17, [110/9], 1d21h, ospf-default, intra
    *via 20.149.9.2, Eth1/18.18, [110/9], 1d21h, ospf-default, intra
    *via 20.149.10.2, Eth1/25.25, [110/9], 1d21h, ospf-default, intra
    *via 20.149.11.2, Eth1/26.26, [110/9], 1d21h, ospf-default, intra
     via 10.0.112.95, Eth2/21.77, [115/65], 1d21h, isis-isis_infra, L1
     via 10.0.112.95, Eth1/24.35, [115/65], 1d21h, isis-isis_infra, L1
     via 10.0.112.92, Eth2/19.76, [115/65], 1d21h, isis-isis_infra, L1
     via 10.0.112.92, Eth1/21.36, [115/65], 1d21h, isis-isis_infra, L1
     via 10.0.112.90, Eth2/17.75, [115/65], 1d21h, isis-isis_infra, L1
     via 10.0.112.90, Eth1/23.33, [115/65], 1d21h, isis-isis_infra, L1
Step 4

To verify the MFIB on the spine switch line card module, log on to the module as root and use an (vsh_lc) command such as the following example:

Example:

root@module-1# show forwarding multicast hrep tep_routes

****HREP TEP ROUTES****
------------------------------------------------------------------------------------------------------------
| Tep Ip    |   Tep If    |    NH Ip     |       NH If     |     NH dmac    |    NH dvif | Vlan Id | Bd Id |
------------------------------------------------------------------------------------------------------------
|22.30.1.1    |0x1801000b   |20.149.11.2    |0x1a01901a     |00c8.8bba.54bc |490  |2901   |4098   |
|11.30.1.1    |0x18010009   |20.149.10.2  |0x1a018019   |00c8.8bba.54bc |491  |2900   |4097   |
Step 5

To verify the multicast HREP TEP details for remote sites, log on to the spine switch line card module to investigate the SDK, by entering a command such as the following example:

Example:

root@module-1# show platform internal hal objects mcast hreptep
## Get Objects for mcast hreptep for Asic 0
  OBJECT 1:
Handle                                                    : 52303
tepifindex                                                : 0x18010009
tepipaddr                                                 : 11.30.1.1/0
intbdid                                                   : 0x1001
intvlanid                                                 : 0xb54
nexthopipaddr                                             : 20.149.10.2/0
nexthopifindex                                            : 0x1a018019
nexthopmacaddr                                            : 00:c8:8b:ba:54:bc
Step 6

To verify the GIPo route having HREP tunnels for the remote sites, log on to the spine switch Supervisor module and examine IS-IS details on the spine switch with a command, such as the following example:

Example:

swmp11-spine6# show isis internal mcast routes gipo
GIPo: 225.0.6.176 [TRANSIT]
    OIF List:
      Ethernet1/21.36
      Ethernet1/23.33
      Ethernet1/24.35
      Tunnel9         <== Multicast HREP tunnel for Remote Site 1
      Tunnel1         <== Multicast HREP tunnel for Remote Site 2
      Ethernet2/17.75
      Ethernet2/19.76
      Ethernet2/21.77
Step 7

To verify the GIPo route having HREP tunnels for the remote sites, examine the MRIB on the spine switches using a command, such as the following example:

Example:

swmp11-spine6# show ip mroute 225.0.6.176 vrf overlay-1
IP Multicast Routing Table for VRF "overlay-1"
(*, 225.0.6.176/32), uptime: 1d02h, isis
  Incoming interface: Null, RPF nbr: 0.0.0.0
  Outgoing interface list: (count: 8)
    Tunnel9, uptime: 1d01h
    Tunnel11, uptime: 1d02h
    Ethernet2/21.77, uptime: 1d02h
    Ethernet2/19.76, uptime: 1d02h
    Ethernet2/17.75, uptime: 1d02h
    Ethernet1/24.35, uptime: 1d02h
    Ethernet1/23.33, uptime: 1d02h
    Ethernet1/21.36, uptime: 1d02h
Step 8

To verify the MFIB on an FC, log on to the module as root, and use a command such as the following example:

Example:

root@module-24# show forwarding multicast route group 225.0.6.176 vrf all
  (*, 225.0.6.176/32), RPF Interface: NULL, flags: Dc
    Received Packets: 0 Bytes: 0
    Number of Outgoing Interfaces: 8
    Outgoing Interface List Index: 484
      Ethernet1/21.36 Outgoing Packets:N/A Bytes:N/A
      Ethernet1/23.33 Outgoing Packets:N/A Bytes:N/A
      Ethernet1/24.35 Outgoing Packets:N/A Bytes:N/A
      Tunnel9 Outgoing Packets:0 Bytes:0
      Tunnel11 Outgoing Packets:0 Bytes:0
      Ethernet2/17.75 Outgoing Packets:N/A Bytes:N/A
      Ethernet2/19.76 Outgoing Packets:N/A Bytes:N/A
      Ethernet2/21.77 Outgoing Packets:N/A Bytes:N/A
Step 9

To verify the GIPo route having HREP tunnels for the remote sites, examine the SDL on FC, using a command such as the following example:

Example:

root@module-24# show platform internal hal objects mcast l3mcastroute groupaddr 225.0.6.176/32 extensions
## Get Extended Objects for mcast l3mcastroute for Asic 0
  OBJECT 0:
Handle                                                    : 78705
groupaddr                                                 : 225.0.6.176/32
grpprefixlen                                              : 0x20
sourceaddr                                                : 0.0.0.0/32
ispimbidir                                                : Enabled
ctrlflags                                                 : UseMetFlag,
rtflags                                                   : none, UseMetEntry,
acirtpolicy                                               : none
 - - - - - - - - 
Relation Object repllistnextobj :
  rel-repllistnextobj-mcast-mcast_mcast_repl_list-handle  : 78702
  rel-repllistnextobj-mcast-mcast_mcast_repl_list-id      : 0x600001e4
Step 10

To verify the GIPo route to the remote sites, examine the replication list identified in the last step, using a command such as the following example:

Example:

root@module-24# show platform internal hal objects mcast mcastrepllist id 0x600001e4
## Get Objects for mcast mcastrepllist for Asic 0
- - - - - - - - - - 
Repl-List Asicpd Debug :
Entry-Num 0
Repl Entry Id:      0x1e5 Hw Epg Id:    4050 Hw Bd Id:   4050
Mc Id:                484 Met Id:        485 Encap Id:     -1
Sh Grp:                 0 Next Met Id:   749
Entry-Num 1
Repl Entry Id:      0x2ed Hw Epg Id:    4098 Hw Bd Id:   4098
Mc Id:                490 Met Id:        749 Encap Id:     -1
Sh Grp:                 0 Next Met Id:  1191
Entry-Num 2
Repl Entry Id:      0x3a4 Hw Epg Id:    4097 Hw Bd Id:   4097
Mc Id:                491 Met Id:       1191 Encap Id:     -1
Sh Grp:                 0 Next Met Id:     0
Step 11

To verify the VNID and GIPo mappings on the local (TX) and remote (RX) sites, enter a command such as the following example:

Example:

root@module-2# show platform internal hal objects dci vnidmap extensions | grep -B 5 -A 5 225.1.148.0

  OBJECT 182:
Handle                                                    : 26456
isbdvnid                                                  : Enabled
localvnid                                                 : 0xe78007
localgipo                                                 : 225.1.148.0/32
remotevnid                                                : 0xe1000c
remotevrfvnid                                             : 0x208019
islocalbdctrl                                             : Enabled
siteid                                                    : 0x3

 OBJECT 1285:
Handle                                                    : 29468
isbdvnid                                                  : Enabled
localvnid                                                 : 0xe78007
localgipo                                                 : 225.1.148.0/32
remotevnid                                                : 0xee7fa8
remotevrfvnid                                             : 0x2e000e
islocalbdctrl                                             : Enabled
siteid                                                    : 0x2