Applications

Cisco Data Center Network Manager (DCNM) uses the application framework to host various plugins and microservices to support operations and related features in Cisco DCNM.

The Applications Framework provides the following features:

  • An infrastructure for hosting applications that require more system resources as the scale of the network increases.

  • An independent application development-deployment-management lifecycle for applications.

Cisco DCNM Applications Framework supports two modes namely clustered mode and unclustered mode. In clustered mode, the compute nodes are clustered together whereas in the latter only the DCNM server nodes namely the active/standby exist. Most of the applications for ex: Network Insights require clustered setup to be ready before they can be uploaded and deployed using DCNM Applications Framework.

Cisco DCNM in Unclustered Mode

From Cisco DCNM Release 11.0(1), the unclustered mode is the default deployment mode in both Standalone and Native HA environment. In this mode, the Cisco DCNM runs some of its internal services as containers, also.

  • Endpoint Locator is running as a container application, from Cisco DCNM Release 11.1(1).

  • Configuration Compliance service is a container application, from Cisco DCNM Release 11.0(1).

  • Virtual Machine Manager (VMM) is also a container application, from Cisco DCNM Release 11.0(1)

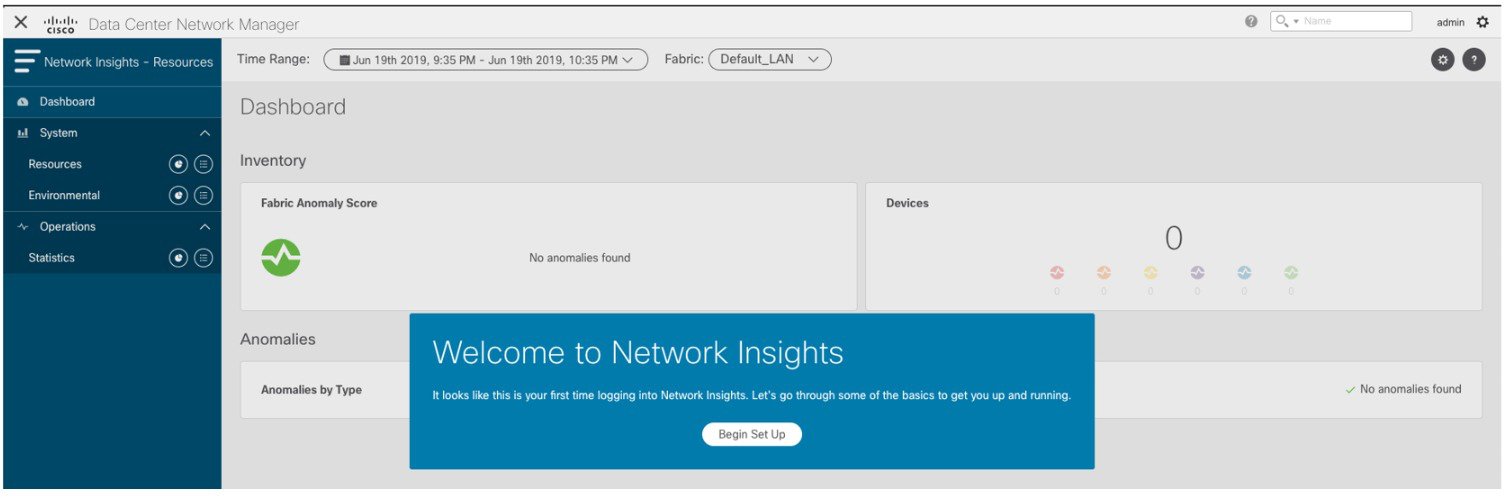
Cisco DCNM leverages resources from the Standby node for running some containers applications. The Cisco DCNM Active and Standby nodes work together to extend resources to the overall functionality and deployment of DCNM and its applications. However, it has limited resources to run some of the advanced applications and to extend the system to deploy more applications delivered through the Cisco AppCenter. For example, you cannot deploy the Network Insights applications that are downloaded from the Cisco AppCenter, for production, in unclustered mode.

To install and deploy applications, see Installing and Deploying Applications.

For best practices and recommended deployments for IP address configurations of all interfaces of the Cisco DCNM and Compute nodes, see Best Practices for Deploying Cisco DCNM and Computes in Cisco DCNM Installation Guide, for your deployment type.

Cisco DCNM in Clustered Mode

By default, the clustered mode if not enabled on the Cisco DCNM deployments. Enable the cluster mode after you deploy the Cisco DCNM Server. In a clustered mode, the Cisco DCNM Server with more compute nodes provides an architecture to expand resources, as you deploy more applications.

Compute nodes are scale out application hosting nodes that run resource-intensive services to provide services to the larger Fabric. When compute nodes are added, all services that are containers, run only on these nodes. This includes Config Compliance, Endpoint Locator, and Virtual Machine Manager. The Elasticsearch time series database for these features runs on compute nodes in clustered mode. In the clustered mode deployment, the DCNM Servers do not run containerized applications. All applications that work in unclustered mode works in the clustered mode, also.

Refer to Installing Cisco DCNM Compute Node in the Cisco DCNM Installation and Upgrade Guide for LAN Fabric Deployment.


Note

The clustered mode is not supported on Cisco DCNM for Media Controller deployment.


From Cisco DCNM Release 11.1(1), in a Native HA setup, 80 switches with Endpoint Locator, Virtual Machine Manager, config compliance are validated in the unclustered mode. For a network exceeding 80 switches, with these features in a given Cisco DCNM instance (maximum qualified scale is 256 switches), we recommend that you enable clustered mode.

In a Native HA setup, 80 switches with Endpoint Locator, Virtual Machine Manager, config compliance are validated in the unclustered mode. For a network exceeding 80 switches, with these features in a given Cisco DCNM instance (the maximum qualified scale is 350 switches starting from Cisco DCNM 11.3(1) Release), we recommend that you enable clustered mode.

While the Cisco DCNM core functionalities only run on the Native HA nodes, addition of compute nodes beyond 80 switches is to build a scale-out model for Cisco DCNM and related services.

From Release 11.2(1), you can configure IPv6 address for Network Management for compute clusters. However, DCNM does not support IPv6-address for containers, and must connect to DCNM using only IPv4 address only.

For best practices and recommended deployments for IP address configurations of all interfaces of the Cisco DCNM and Compute nodes, see Best Practices for Deploying Cisco DCNM and Computes in Cisco DCNM Installation Guide, for your deployment type.

Requirements for Cisco DCNM Clustered Mode


Note

We recommend that you install the Cisco DCNM in the Native HA mode.


Cisco DCNM LAN Fabric Deployment Without Network Insights (NI)


Note

For information about various system requirements for proper functioning of Cisco DCNM LAN Fabric deployment, see System Requirements.

Refer to Network Insights User guide for sizing information for Cisco DCNM LAN Deployment with Network Insights (NI).

To see the verified scale limits for Cisco DCNM 11.5(1) for managing LAN Fabric deployments, see Verified Scale Limits for Cisco DCNM.


Table 1. Upto 80 Switches
Node CPU Deployment Mode CPU Memory Storage Network
DCNM OVA/ISO 16 vCPUs 32G 500G HDD 3xNIC
Computes NA
Table 2. 81–350 Switches
Node CPU Deployment Mode CPU Memory Storage Network
DCNM OVA/ISO 16 vCPUs 32G 500G HDD 3xNIC
Computes OVA/ISO 16 vCPUs 64G 500G HDD 3xNIC

Subnet Requirements

In general, Eth0 of the Cisco DCNM server is used for Management, Eth1 is used to connect Cisco DCNM Out-Of-Band with switch management, and eth2 is used for In-Band front panel connectivity of Cisco DCNM. The same concept extends into compute nodes as well. Some services in clustered mode have other requirements. Some services require a switch to reach into Cisco DCNM. For example, Route Reflector to Endpoint Locator connection or switch streaming telemetry into the Telemetry receiver service of the application require a switch to reach DCNM. This IP address needs to remain sticky during all failure scenarios. For this purpose, an IP pool must be provided to Cisco DCNM at the time of cluster configuration for both out-of-band and In-Band subnets.

Telemetry NTP Requirements

For telemetry to work correctly, the Cisco Nexus 9000 switches and Cisco DCNM must be time that is synchronized. Cisco DCNM telemetry manager does the required NTP configuration as part of enablement. If there is a use-case to change the NTP server configuration manually on the switches ensure that the DCNM and the switches are time synchronized, always.

Installing a Cisco DCNM Compute


Note

With Native HA installations, ensure that the HA status is OK before DCNM is converted to cluster mode.


A Cisco DCNM Compute can be installed using an ISO or OVA of a regular Cisco DCNM image. It can be deployed directly on a bare metal using an ISO or a VM using the OVA. After you deploy Cisco DCNM, using the DCNM web installer, choose Compute as the install mode for Cisco DCNM Compute nodes. On a Compute VM, you will not find DCNM processes or postgres database; it runs a minimum set of services that are required to provision and monitor applications.

Refer to Installing Cisco DCNM Compute Node in the Cisco DCNM Installation and Upgrade Guide for LAN Fabric Deployment, Release 11.5(1).

Networking Policies for OVA Installation

For each compute OVA installation, ensure that the following networking policies are applied for the corresponding vSwitches of host:

  • Log on to the vCenter.

  • Click on the Host on which the computes OVA is running.

  • Click Configuration > Networking.

  • Right click on the port groups corresponding to the eth1 and eth2, and select Edit Settings.

    The VM Network - Edit Settings is displayed.

  • In Security settings, for Promiscuous mode, select Accepted.

  • If a DVS Port-group is attached to the compute VM, configure these settings on the vCenter > Networking > Port-Group. If a normal vSwitch port-group is used, configure these settings on Configuration > Networking > port-group on each of the Compute's hosts.

    Figure 1. Security Settings for vSwitch Port-Group
    Security settings for vSwitch Port-Group
    Figure 2. Security Settings for DVSwitch Port-Group
    Security settings for DVSwitch Port-group

Note

Ensure that you repeat this procedure on all the hosts, where a Compute OVA is running.


Enabling the Compute Cluster


Note

Ensure that you enable Compute Cluster before you install applications. The applications that are installed via the AppCenter will not work if you enable the compute cluster after installing the applications.


Note

The services are down until the configuration is complete. Ensure that the session is active while configuration is in progress.


Note

If you enable clustered mode while installing Cisco DCNM, you don't need to enable cluster. The compute nodes will be discovered on Cisco DCNM Web UI > Applications > Compute. Go to Compute to form a cluster.


If you did not enable clustered mode while installation, use the following command to enable the compute cluster.

appmgr afw config-cluster [--ewpool <InterApp-Subnet>] --oobpool <OutOfBand-Subnet> --ibpool <Inband-Subnet> --computeip <compute-IP>

Where:

  • ewpool: specifies the east-west pool subnet; for inter-service connectivity.

    This field is optional, if the inter-application subnet is specified during Cisco DCNM installation for your deployment type. These addresses are not used directly between the computes, or to communicate with another node. These are used by containers to communicate with each other. This subnet must be minimum of /24 (256 addresses) and a maximum of a /20 (4096 addresses).

    This field is optional if the Inter-app subnet is specified during Cisco DCNM deployment installation.

  • oobpool: specifies the out-of-band pool; a smaller prefix of available IP addresses from the eth1 subnet. For example: Use 10.1.1.240/28 if the eth1 subnet was configured as 10.1.1.0/24 during installation.

    This subnet must be a minimum of /28 (16 addresses) and maximum of /24 (256 addresses). It should also be longer than the east-west pool. This subnet is assigned to containers, to communicate with the switches.

  • ibpool: specifies the in-band pool; a smaller prefix of available IP addresses eth2 subnet. For example: Use 11.1.1.240/28 if the eth2 subnet was configured as 11.1.1.0/24 during installation.

    This subnet must be a minimum of /28 (16 addresses) and maximum of /24 (256 addresses). It should also be longer than the east-west pool. This subnet is assigned to containers, to communicate with the switches.

  • computeip: specifies the dcnm-mgmt network (eth0) interface IP address of the first compute node added to the cluster. This compute is added into the cluster as part of this command process and is used to migrate application data from DCNM servers to computes.

DCNM Management interfaces

The other two computes are Discovered automatically, and is displayed on the Cisco DCNM Web UI > Applications > Compute.

The In-Band or out-of-band pools are used by services to connect with switches as required. The IP addresses from these pools must be available for configuration.


Note

To add computes to the cluster mode, see Adding Computes into the Cluster Mode.


Managing Application Network Pools

When you alter the eth1 or eth2 interface subnets, the corresponding oob pool and inband pool must be modified to match the new configuration. Network Insights and Endpoint Locator applications use the IP addresses from the Out-of-Band and In-Band pools.

To modify the IP addresses that are assigned to services running in the compute cluster, use the following command:


Note

The inband or out-of-band pools are used by applications to connect with Cisco Nexus Switches. Hence, the IP addresses from these pools must be available and free.

appmgr afw config-pool [--ewpool <InterApp-Subnet>] --oobpool <OutOfBand-Subnet> --ibpool <Inband-Subnet> --computeip <compute-IP>

Where:

  • ewpool: specifies the east west pool subnet; for inter-service connectivity.

    The network mask ranges from 20 to 24 These addresses aren’t used directly between the computes, or to communicate with another node. These are used by containers to communicate with each other.

  • oobpool: specifies the out-of-band pool; a smaller prefix of available IP Addresses from eth1 subnet.

    The network mask ranges from 24 to 28.

  • ibpool: specifies the inband pool; a smaller prefix of available IP addresses from eth2 subnet.

    The network mask ranges from 24 to 28.

  • ipv6oobpool: specifies the out-of-band IPv6 pool; a smaller prefix of available IPv6 addresses from eth1 subnet.

    If IPv6 is enabled, these addresses are required on both inband and out-of-band subnet.

    The network mask ranges from 112 to 124.

  • ipv6ibpool: specifies the inband IPv6 pool; a smaller prefix of available IPv6 addresses from eth2 subnet.

    If IPv6 is enabled, these addresses are required on both inband and out-of-band subnet.

    The network mask ranges from 112 to 124.

Adding Computes into the Cluster Mode

To add computes into the cluster mode from Cisco DCNM Web UI, perform the following steps:

Procedure


Step 1

Choose Applications > Compute.

The Compute tab displays the computes enabled on the Cisco DCNM.

Step 2

Select a Compute node which is in Discovered status. Click the Add Compute (+) icon.

Add compute.

  • While using Compute, ensure that Cisco DCNM GUI shows nodes as Joined.

  • Offline indicates some connectivity issues, therefore no applications are running on Offline Computes.

  • Failed indicates that the compute node could not join the cluster.

  • Health indicates the amount of free memory and disk on the Compute node. The Health Monitor application provides more detailed statistics.

  • Cisco DCNM 3 node cluster is resilient to single node failure only.

  • If the Performance Manager was stopped during or after the inline upgrade and after all the computes have changed to Joined, you must restart the Performance Manager.

The Compute window allows you to monitor the health of computes. The health essentially indicates the amount of memory that is left in the compute, this is based on applications that are enabled. If a Compute is not properly communicating with the DCNM Server, the status of the Compute appears as Offline, and no applications are running on Offline Computes.

Step 3

In the Add Compute dialog box, view the Compute IP Address, In-Band Interface, and the Out-Band Interface values.

Note 

The interface value for each compute node is configured by using the appmgr afw config-cluster command.

Add compute.

Step 4

Click OK.

The Status for that Compute IP changes to Joining.

compute joining

Wait until the Compute IP status shows Joined.

Compute joined.

Step 5

Repeat the above steps to add the remaining compute node.

All the Computes appear as Joined.

Note 

When you install compute as a virtual machine on the VMware platform, vSwitch or DV switch port groups associated eth1 and eth2 must allow for packets that are associated with Mac address other than eth1 and eth2 to be forwarded.


Transitioning Compute Nodes

Transitioning Compute nodes from VM to Service Engine

To transition Cisco DCNM Compute Nodes from VMs to Applications Services Engine using the Cisco DCNM Web Client, perform the following steps:

Before you begin

  • Ensure that Cisco DCNM Web Client is functioning.

  • On the Cisco DCNM Web Client > Applications > Compute, all the Compute nodes must be in Joined state.

Procedure


Step 1

Choose Applications > Compute.

For example, let us indicate the three Compute nodes as compute1 , compute2 , and compute3 .

Step 2

Open the vCenter Server application and connect to the vCenter Server with your vCenter user credentials.

Step 3

Navigate to Home > Inventory > Hosts and Clusters and identify the VM on which the DCNM Compute nodes are deployed.

Step 4

For compute1, make a note of the configurations and setup details provided during installation.

Step 5

Turn off compute1. Right click on the VM, select Power off.

On the Web UI > Applications > Compute, the status of compute1 shows Offline.

Step 6

Using the configuration details of the compute node VM, install the compute node on Cisco Applications Services Engine.

For instructions, refer to Installing DCNM Compute Node on Cisco ASE.

Step 7

Launch the Web UI, and choose Applications > Compute.

The newly added compute automatically joins the cluster. The status of compute1 changes from Offline → Joining → Joined.

Step 8

Repeat Steps Step 4 to Step 7 on compute2 and compute3 compute nodes.

After completion, all the Compute nodes on Web UI > Applications > Compute are in the Joined state.

All are Compute nodes are successfully hosted on the Cisco Applications Services Engine.


Transitioning Compute nodes from Service Engine to VM

To transition Cisco DCNM Compute Nodes from Applications Services Engine to VMs using the Cisco DCNM Web Client, perform the following steps:

Before you begin

  • Ensure that Cisco DCNM Web Client is functioning.

  • On the Cisco DCNM Web Client > Applications > Compute, all the Compute nodes must be in Joined state.

Procedure


Step 1

Choose Applications > Compute.

For example, let us indicate the three Compute nodes as compute1 , compute2 , and compute3 .

Step 2

On the Cisco Applications Server console, for compute1, make a note of the configurations and setup details provided during installation.

Step 3

Power off the Applications Service Engine to turn off compute1.

On the Cisco DCNM Web UI > Applications > Compute, the status of compute1 shows Offline.

Step 4

Using the configuration details of the compute node on Applications Service Engine, install the compute node on the VM.

For instructions, refer to Installing DCNM on ISO Virtual Appliance.

Step 5

Launch the Web UI, and choose Applications > Compute.

The newly added compute automatically joins the cluster. The status of compute1 changes from Offline → Joining → Joined.

Step 6

Repeat Steps 3 to 5 on compute2 and compute3 compute nodes.

After completion, all the Compute nodes on Web UI > Applications > Compute are in the Joined state.

All are Compute nodes are successfully hosted on the VMs.


Preferences

This tab is relevant to the cluster mode of deployment, where the application instances are placed. This tab enables you to compute cluster connectivity and configure the Cluster Connectivity preferences.

Preferences Tab

Compute Cluster Connectivity

The fields show the IP address that is used to configure the connectivity interfaces for the cluster node. The IP addresses for in-band fabric, out-of-band fabric, and Inter-Application are displayed.

Object Archival Configuration

The NIA application collects tech support logs for all switches in Fabric, and determines the advisory, based on the data. The logs are saved on the Cisco DCNM server for further analysis or troubleshooting. If you need to download these logs before their life span ends or to create some space on the DCNM server, you can move the logs to a remote server.

In the URI field, enter the relative path to the archive folder, in the format host[:port]/[path to archive]. Enter the username and password to access the URI, in the username and Password field. Click Submit to configure the remote server.

Telemetry Network and NTP Requirements

For the Network Insights Resource (NIR) application, a UTR micro-services running inside the NIR receives the telemetry traffic from the switches either through Out-Of-Band (Eth1) or In-Band (Eth2) interface. By default, the telemetry is configured, and is streaming via the Out-Of-Band interface. You can choose to change it to In-Band interface as well.

For the Cisco Network Insights for Resources (NIR) Release 2.1 and later, and flow telemetry, feature lldp command is one of the required configuration.

Cisco DCNM pushes feature lldp on the switches only for the Easy Fabric deployments, that is, for the eBGP routed fabric or VXLAN EVPN fabric. Therefore, NIR users need to enable feature lldp on all the switches in the following scenarios:

  • External fabric in Monitored or Managed Mode

  • LAN Classic fabric in Monitored or Managed Mode (Applicable for DCNM 11.4(1) or later)

Telemetry Using Out-of-band (OOB) Network

By default, the telemetry data is streamed through the management interface of the switches to the Cisco DCNM OOB network eth1 interface. This is a global configuration for all fabrics in Cisco DCNM LAN Fabric Deployment, or switch-groups in Cisco DCNM Classic LAN Deployment. After the telemetry is enabled via NIR application, the telemetry manager in Cisco DCNM will push the necessary NTP server configurations to the switches by using the DCNM OOB IP address as the NTP server IP address. The following example is sample output for show run ntp command.

switch# show run ntp

!Command: show running-config ntp
!Running configuration last done at: Thu Jun 27 18:03:07 2019
!Time: Thu Jun 27 20:32:18 2019

version 7.0(3)I7(6) Bios:version 07.65 
ntp server 192.168.126.117 prefer use-vrf management

Installing and Deploying Applications

The following sections describes how to download, add, start, stop, and delete applications from the Cisco DCNM Web UI.

Download App from the App Store

To download new applications from the Cisco DCNM Web UI, perform the following steps:

  1. Choose Applications.

    By default, the Catalog tab displays.

  2. Click Browse App Center on the top-right corner on the window.

    On the Cisco ACI App Center, locate the required application and click the download icon.

  3. Save the application executable file on your local directory.

Add a New Application to DCNM

To add new applications from the Cisco DCNM Web UI, perform the following steps:

  1. Choose Applications.

    By default, the Catalog tab displays.

  2. Click Add Application (+) icon.

    Add App.

    On the Application Upload window, from the Type drop-down field, choose one of the following to upload the application.

    Application Upload

    From the Type drop-down list, select one of the following:

    • If the file is located in a local directory, select Local-file.

      In the Upload field, click Select files…. Navigate to the directory where you have stored the application file.

      Select the application file and click Open.

      Click Upload.

    • If the application is located on a remote server, select Secure copy.


      Note

      Ensure that the remote server must be capable of serving Secure-copy (SCP).


      In the URI field, provide the path to the application file. The path must be in {host-ip}:{filepath} format.

      In the Username field, enter the username to access the URI.

      In the Password field, enter the appropriate password for accessing the URI.

      Click Upload.

After the application successfully uploaded, it is displayed in the Catalog window.

The green icon on the left-top corner indicates that the application is launched successfully and is operational. If there is no green icon on the application, it indicates that the application is not running. Click the application to Launch it.


Note

Ensure that the Compute Cluster is enabled before you install applications. A few applications may not work is the compute cluster is configured after installing the applications.


Click the gear icon on the left-bottom on the application icon to view the Application Specifications. The Info tab displays the running container information. The Specs tab displays the configuration.

Starting Application

After the application is installed on the Cisco DCNM server, you must deploy the application. Click on the Application to begin deployment. Cisco DCNM starts all the services in the backend that are required for the application.

The green icon on the left-top corner indicates that the application is launched successfully and is operational.

The applications utilizing the Kafka infrastructure services require three actively joined compute nodes, when you begin the application. For example, NIR and NIA applications. If the application has a user interface, after the application is successfully started the UI redirects to the index page served by the application.

If the application has a user interface, after the application is successfully started the UI redirects to the index page served by the application.

NIR app added

To check the services that are running go back to Applications > Catalog. Click the gear icon on the left-bottom on the application icon to view the Application Specifications. The Info tab displays the running container information and the Specs tab displays the configuration as shown in the figures below.

For information on how to remove computes from the cluster, stopping or deleting the applications, see Application Framework User Interface.

Stop and Delete Applications

To delete the applications from the Catalog on the Cisco DCNM Web UI, perform the following steps:

  1. Choose Applications.

    By default, the Catalog tab displays, showing all the installed applications.

  2. Click the red icon on the right-bottom corner to stop the application.

  3. Check the Wipe Volumes check box to erase all the data that is related to the application.

  4. Click Stop to stop the application from streaming data from Cisco DCNM.

    The Green icon disappears after the application is successfully stopped.

  5. After you stop the application, click the Waste Basket icon to remove the application from the Catalog.

Application Framework User Interface

To use the Applications Framework feature, in the Cisco DCNM home page's left pane, click Applications.

The Applications window displays the following tabs:

  • Catalog—This tab lists the applications that are used by Cisco DCNM. These applications for performing various functions within Cisco DCNM. For more information, see Catalog.

  • Compute—This tab displays the existing compute nodes. The tab shows nodes that are part of the hosting infrastructure. The uptime indicates how long they have been part of the infrastructure. In a High Availability (HA) setup, both the active and the standby nodes appear as joined. For more information, see Compute.


    Note

    In the cluster mode, the Cisco DCNM servers will not appear under the Compute tab.


  • Preferences—This tab is relevant to the cluster mode of deployment, where the application instances are placed. This tab enables you to compute the cluster connectivity and configure the Cluster Connectivity preferences. For more information, see Preferences.

Cisco DCNM uses the following applications:

  • Compliance: This application helps in building fabrics for the Easy Fabric installation. The Compliance application runs as one instance per fabric. It is enabled when fabric is created. Similarly, it is disabled when fabric is deleted.

  • Kibana: This is an open-source data-visualization plug-in for Elasticsearch, which provides visualization capabilities. Cisco DCNM uses the Kibana application for the Media Controller, and Endpoint Locator.

  • vmmplugin: The Virtual Machine Manager (VMM) plug-in stores all the computes and the virtual machine information that connects to the fabric or the switch groups that are loaded into Cisco DCNM. VMM gathers compute repository information and displays the VMs, VSwitches/DVS, hosts in the topology view.

  • Endpoint Locator: The Endpoint Locator (EPL) feature allows real-time tracking of endpoints within a data center. The tracking includes tracing the network life history of an endpoint and getting insights into the trends that are associated with endpoint additions, removals, moves, and so on. An endpoint is anything with an IP and MAC address. In that sense, an endpoint can be a virtual machine (VM), container, bare-metal server, service appliance and so on.

Catalog

The Catalog allows you to view all the applications that you have installed or enabled on the Cisco DCNM. Few applications are installed and are operational by default, when you install the Cisco DCNM.

The following applications appears based on the Cisco DCNM Deployments:

  • Health Monitor (2.1)

  • PTP Monitoring (1.1)

  • Kibana (2.0)

  • Programmable report (1.1.0)

  • Elastic Service (1.1)

  • Compliance (4.0.0)

  • Debug Tools (2.1)

  • IPAM Integrator (1.0)

  • Endpoint Locator (2.1)

  • Kubernetes Visualizer (1.1)

  • vmmplugin (4.1)


Note

The applications started by default, or also installed on the DCNM utilizes infrastructure services are operational, by default.


You can install more applications from the App Center, via the Web UI.

For instructions about downloading, adding, starting, stopping, and deleting applications from the Cisco DCNM Web UI, see Installing and Deploying Applications.

Health Monitor

The Health Monitor helps you to monitor the infrastructure health and status. You can monitor the Alerts, Service Utilization, and Compute Utilization using the Health Monitor application. When you install or upgrade to 11.2(1), the Health Monitor application is installed and operational, by default.

To launch the Health Monitor app, on the Cisco DCNM Web UI, choose Applications. On the Catalog tab, click on Health Monitor to launch the application.


Note

Health Monitor application is installed by default in Cisco DCNM cluster mode.


Health Monitor app broadly monitors and alerts on the following metrics for Services, Computes and DCNM server:

  • CPU utilization

  • Memory utilization

  • Network I/O (eth0)

  • Disk I/O

You can monitor the following using the Health Monitor application:

Alerts

The Alerts window provides information about the number of alerts that have occurred, from the specified date and time. You can view the alerts, based on the following categories, in the graphical view and the list view.

In the graphical view, the categories are:

  • Severity displays the alerts, based on the severity: Critical/Major/Minor/Info.

  • Type displays the alerts, based on the cluster type.

  • Compute displays the alerts, for each compute node.

  • Service displays the alerts, for all the services running on Cisco DCNM.

Click on the Refresh icon to refresh the alerts. Click on the list view icon to view the alerts in list format.

In the List View, alerts are displayed in tabular format with the following categories:

  • Timestamp displays the time when the alert triggers. Format is MM/DD HH:MM AM/PM.

  • Alert Severity displays the severity of alert.

  • Alert Type displays the cluster alert type.

  • Node Name displays the node name where the alert triggers.

  • Alert Description displays the summary of the alert.

Click on the right or left navigation arrows to move to the next or the previous page.

You can also choose to set the number of items to view on page. Select a suitable number from the Objects Per Page drop-down list.

Click on the Graphical representation icon to go to the graphical view. Click on Download Data icon to download alerts information for troubleshooting purposes.

Health Monitor generates alerts for the following metrics:

  • CPU utilization >= 65 %

  • Memory utilization >= 65 %

  • Disk utilization >= 65 %

  • Elasticsearch cluster status: Red/yellow

  • Elasticsearch unassigned shards > 0

  • Elasticsearch JVM heap used >= 65 %

  • Kafka partitions without leader: Controller offline partitions count > 0

  • Kafka controllers count: Controller active controller count != 1

  • Kafka partition leader: Controller unclear leader elections count > 0

Service Utilization

You can monitor all the services running on the Cisco DCNM on this window. Based on the time range and the service, the graphical view shows the CPU and Memory utilization for service. Click on the Service Utilization icon on the top-right corner to launch the CPU utilization graphical view.

From the Time Range drop-down list, choose the time range for which you want to view the utilization. You can select a specific time interval to view the metrics during that time interval. Click the fields showing the date and time to select the required date and time interval. You can also click the date on the calendar to set range. Click Apply to confirm the time range.

From the Services drop-down list, choose the service to view its Service utilization. This list comprises of all the services that are currently running on the Cisco DCNM.

Select the Time Range to view the Service, the Cpu Utilization, and Memory Utilization graphs. You can hover over specific points on the respective graphs for more information on CPU and Memory utilization at specific time.

The memory utilization graphical view depicts the actual memory consumption (RAM) in Gigabytes (GB).

Click [X] icon on the top-right corner to close the Service Utilization window and revert to the Alerts window.

Guidelines and Limitations for Health Monitor in Service Utilization
  • The CPU utilization for applications without a CPU limit, like Kafka, ElasticSearch, FMserver, and so on, may show 100% utilization in the graphs. 100% utilization is because this application uses one or more cores.

  • The following alerts are triggered for the CPU utilization of applications:

    • Minor alert: 200-400 %

      Major alert: 400-600%

      Critical: > 600%

  • The transient message for Kafka controller counts appears as a severe alert sometimes. You can ignore the alert if it clears within two minutes after refresh.

  • The Disk I/O and Memory Utilization metrics are not available for Kafka and Elastic Service.

  • The Network I/O metric is not available for DCNM: FMServer and DCNM: Postgres.

  • The metrics does not auto-refresh. Navigate between different windows using the options in the drop-down list to refresh the metrics. Additionally, you can change the time range to refresh the metrics for a selected period.

  • There might be duplicate alerts for the same feature.

The following additional metrics are collected for Elastic Cluster:

  • Get latency: Latency for getting a single record by id

  • Cluster heap used: Heap memory used by the cluster

  • Unassigned shards: Count of unassigned shards

  • Node heap used percentage: Percentage heap memory used by the node

  • Search latency: Latency for getting a collection of records

The following additional metrics are collected for Kafka broker:

  • CPU: CPU utilization of broker

  • Memory: Memory utilization of broker

  • Heap memory: Heap memory utilized by broker

  • Total time: Network produce, network fetch follower, network fetch consumer time

  • Purgatory size: Server fetch purgatory size, server produce purgatory size of broker

  • Data in: Bytes in for the broker

  • Data out: Bytes out for the broker

  • Messages in: Messages received by the broker

  • Fetch request: Total fetch requests for the broker

  • ISR: In-sync-replicas expands and shrinks for the broker

The following additional metrics are collected for top 5 Kafka topics:

  • Data in: Bytes in for the topic

  • Data out: Bytes out for the topic

  • Messages in: Message in count for topic

  • Messages out: Message out count for topic

  • Lag: Lag per topic

Compute Utilization

You can monitor all the computes installed with the Cisco DCNM. Based on the time range and the service, the graphical view shows the CPU and Memory utilization for service. Click on the Compute Utilization icon on the top-right corner to launch the CPU utilization graphical view.

From the Time Range drop-down list, choose the time range for which you want to view the utilization. You can select a specific time interval to view the metrics during that time interval. Click the fields showing the date and time to select the required date and time interval. You can also click the date on the calendar to set range. Click Apply to confirm the time range.

Select the Time Range to view the Service, the Cpu Utilization, and Memory Utilization graphs. You can hover over specific points on the respective graphs for more information on CPU and Memory utilization at specific time.

The memory utilization graphical view depicts the actual memory consumption (RAM) in Gigabytes (GB).

Click [X] icon on the top-right corner to close the Service Utilization window and revert to the Alerts window.

PTP Monitoring

This section explains the preview functionality of the Precision Time Protocol (PTP) monitoring. PTP is a time synchronization protocol for nodes that are distributed across a network. On a local area network, it achieves clock accuracy in the sub-nanosecond range, making it suitable for measurement and control systems.

In DCNM, PTP Monitoring can be installed as an application. From the DCNM Web UI, navigate to Applications and click PTP Monitoring. This application works in the IPFM mode only.

In the PTP Management window, you can view PTP related information based on the switch selected from the Select a switch drop-down list. You can click the Telemetry Switch Sync Status link to check whether the switches are in sync. The Sync Status column displays the status of the switches.

The following tabs are displayed in this window:

  • Correction & Mean Path Delay

  • Clock & Port Status


Note

The PTP related info is displayed for the switch group that you select from the SCOPE drop-down list.


Correction and Mean Path Delay

The Correction & Mean Path Delay tab displays a graph showing the PTP operational statistics: mean path delay, correction, and correction beyond threshold. You can click and drag in the plot area to zoom in and hold the shift key to pan. Click the Reset zoom button to reset zoom.

By default, the graph is displayed for the threshold value of 500 nanoseconds (ns). You can also display data based on a specific threshold value. In the Threshold (ns) field, enter the required value in nanoseconds and click Apply. Note that the threshold value is persistent in the DCNM settings, and it is used to generate PTP correction threshold AMQP notifications.

From the Date drop-down list, you can select the appropriate date to view the data. The PTP data is stored up to the last seven (7) days. The default value for the stored data is 7 days. To change this value, navigate to Administration > DCNM Server > Server Properties and set the updated value for the pmn.elasticsearch.history.days property.

From the Past drop-down list, you can also select a timeframe over which the data has to be displayed. The values in the Past drop-down list are 1, 6, 12, and 24 hours.

Note that you can click the legends in the graph to hide or display statistics.

If there are any corrections, you can view them in a tabular format by clicking the Corrections Beyond Threshold link.

Clock and Port Status

The Clock & Port Status tab displays status for Parent Clock, Grandmaster Clock, and ports.

The Port Status table displays the status of the ports and the peer ports. Click the Search icon, and enter the port status, and click Search to filter the port status.

IPAM Integrator

From Cisco DCNM Release 11.4(1), you can use the IPAM Integrator application to view the IP allocation in IPAM server and relevant networks defined in DCNM. In DCNM 11.4(1), IPAM integration is with Infoblox.

The IPAM Integrator application in DCNM 11.4(1) allows read-only access to the IPAM and DCNM servers. Currently, IPv4 overlay DHCP is supported. In read-only access mode, IPAM records are retrieved and mapped to DCNM networks in Easy Fabric and eBGP VXLAN fabric. You can also choose to sync up records on-demand between DCNM and IPAM server. A Infoblox user who has the API permission and at least IPv4 network read permission of IPAM will be able to view the retrieved Infoblox records.

In addition to the matched subnets that exist on both IPAM server and DCNM, the IPAM Integrator application lists the subnets with conflicting netmask for review.

You can also watch the video that demonstrates how to use the IPAM Integrator application to view the IP allocation in IPAM server and the relevant networks defined in DCNM. See Video: Using IPAM Integrator in Cisco DCNM.

Accessing IPAM Integrator

This procedure shows how to access IPAM integrator application.
Procedure

Step 1

Navigate to Applications > Catalog.

Step 2

Click the IPAM Integrator application icon to access the application. If application is not yet started, this action starts the application before accessing the GUI.

Step 3

Provide the required access details in the Access Authentication window.

Note 

You can provide the access details of an Infoblox server or an Infoblox grid manager.

  • IPAM User Name – Specifies the user name for the IPAM server. The Infoblox user has to be granted API permission for the application to retrieve data from Infoblox server via API.

  • Password – Specifies the password for the IPAM server with respect to the username.

  • IPAM Server IP Address – Specifies the IP address of the IPAM server.

  • Poll Interval (minutes) – Specifies the time in minutes that determines how often you want the data to be retrieved from Cisco DCNM and IPAM server. The default value is 15 minutes. The range of the polling value is 2–60 minutes.

Step 4

Click Create.

Step 5

After you access IPAM, you can remove or modify the access details using the Settings icon. You can also edit the poll interval using Edit.

Note 

Only the DCNM users with the admin role can add, update, and delete the access setting. Also, only Infoblox user who has been granted with API permission and at least IPv4 network read access of IPAM permission is able to view the retrieved Infoblox network records.


Viewing Network IP Scope

Network IP Scope is the landing page after you access the IPAM Integrator application.

The following table describes the fields retrieved from the IPAM server.

Field Description

Network View

Specifies the network view, which is a single routing domain with its own networks and shared networks on the Infoblox server.

IP Subnet

Specifies the IP subnet defined in the IPAM server. A subnet, or subnetwork, is a segmented piece of a larger network. More specifically, subnets are a logical partition of an IP network into multiple, smaller network segments.

Stats

Click the icon under the Stats column to view the statistics for the utilization of the IP subnet. For more information, see Viewing Statistics for the Subnet Utilization.

DHCP Utilization

Specifies the utilization percentage of a network in terms of the IP addresses that are leased out.

Hover over the percentage value to view the number of allocated IPs and their details.

In the Infoblox server, it takes time to calculate the DHCP utilization. The IPAM utilization is calculated approximately every 15 minutes on the Infoblox server, and the latest value will be reflected on the IPAM Integrator app after that.

IP Range

Specifies the IP range for the network. Hover over a range to view the enabled DHCP range, the reserved DHCP range, and the fixed addresses for a network.

The following table describes the fields retrieved from DCNM.

Field Description

Fabric Name

Specifies the name of the fabric.

Fabric Type

Specifies the type of the fabric. It can be multi-site deployment (MSD), or a standalone easy fabric or an eBGP VXLAN fabric.

Network Name

Specifies the name of the network.

VRF Name

Specifies the name of the VRF.

Network ID

Specifies the network ID.

VLAN ID

Specifies the VLAN ID.

Last Updated (by Infoblox)

Specifies the date and time when the data was last updated by Infoblox.

Note 

The date and time of the last poll are displayed under the Network IP Scope title.

Click Export to export the data in a .csv file.

For each field, you can sort the values by clicking the arrow icons, and search by clicking the search icon and entering a value.

Click the Settings icon above the fields to remove or add the fields to be displayed.

The polling of data is based on the following criteria:

  • Poll interval value that the user configured initially in the Access Authentication window. It specifies how often you want the data to be retrieved from Cisco DCNM and IPAM.

  • User can click the Refresh icon to receive instantaneous data from DCNM and IPAM server.

  • DCNM Web UI automatically refreshes every 2 minutes and displays data retrieved from DCNM and Infoblox server.

    For example, if the poll interval is 15 minutes and user doesn’t refresh (on-demand) the data during this 15-minute duration, the DCNM Web UI displays the same polling data after every 2-minute refresh until 15 minutes. After 15 minutes, new data is polled from DCNM and IPAM, and saved in the database. This new data is fetched by DCNM after a total of 16 minutes.

Viewing Statistics for the Subnet Utilization

Click the icon under the Stats column to view the statistics for the utilization of the IP subnet over a time.

From the Time Range drop-down list, select the time for which you want to view the statistics. These stats include utilization of subnet such as DHCP utilization, total allocations, dynamic allocations, and static allocations.

Viewing IP Allocation for Hosts

Click the IP range value under the IP Range column to view the IP allocation for each host.

The following fields are displayed for each host in the IP Allocation window. The data for these fields is retrieved from the IPAM server.

  • IP Address

  • Host Name

  • State of the host, that is, active or free

  • Range start time and end time

  • Subnet

  • VRF Name

  • Protocol version

  • MAC address

  • DHCP server info such as IP address and server name

  • Last requested by the host

For each field, you can sort the values by clicking the arrow icons, and search by clicking the search icon and entering a value.

By default, information about only active hosts are displayed. Click the All value to view information about all hosts retrieved from the IPAM server. Click Export to export the data in a .csv file.

Hosts that were recently freed show as "FREE" in the All tab. The all the originally free hosts won’t be shown as FREE. Only the hosts that were recently freed appear in this tab.

Click the Settings (gear) icon on the right-side to remove or add the fields to be displayed.

Viewing Conflicting Networks

IPAM Integrator detects conflicting networks defined in IPAM server and DCNM. You can view this info by clicking Conflicting in the Network IP Scope window.

For example, if one network is a subset of another, the conflicting IP addresses of the network are displayed under Conflicting.

The data is displayed similar to how the Matched data is displayed. You can click the IP range value under the IP Range column to view the IP allocation for each host.

Note that this table also lists the DCNM Gateway for the conflicting IP scopes in addition to the subnet information from the IPAM server.

For each field, you can sort the values by clicking the arrow icons, and search by clicking the search icon and entering a value.

Programmable Report

The Programmable Report application enables the generation of reports using Python 2.7 scripts. Report jobs are run to generate reports. Each report job can generate multiple reports. You can schedule the report to run for a specific device or fabric. These reports are analyzed to obtain detailed information about the devices.

The REPORT template type is used to support the Programmable Report feature. This template has two template subtypes- UPGRADE and GENERIC. For more information on the REPORT template, refer Report Template. A python SDK is provided to simplify report generation. This SDK is bundled with DCNM and provides APIs to generate reports. For more information on APIs, refer Report APIs.

RBAC support

  • An admin or a network operator can create a report..

  • A network operator can view reports created by other admins and operators.

  • A network operator cannot delete/edit/rerun any reports created by an admin and other network operators.

  • An admin can view and delete any report irrespective of the user creating them.

  • An admin cannot edit any report created by other user, including network operator, due to fabric and device association.


Note

A Jython template supports a maximum file size of 100k bytes. In case any report template exceeds this size, Jython execution may fail.


To launch the Programmable Report app, on the Cisco DCNM Web UI, choose Applications. On the Catalog tab, click Programmable report to launch the application. The Report window is displayed. This window has two tabs, User Defined and Internal. The User Defined tab displays the report jobs which are created by a user. For information on creating a report job, refer Creating a Report Job. On any window, click the Home icon at the top left of the screen to return to this Report window. All operations such as creating, deleting, editing, re-running, displaying history, and downloading of report job information, are supported for the jobs displayed in this tab.

Field

Description

Title

Specifies the title of the report job.

User

Specifies the user who has initiated the report generation.

Recurrence

Specifies the frequency at which the reports are generated.

Scope

Specifies the scope of the report. The report can be generated for a device or a fabric.

Template

Specifies the name of the template.

Status

Specifies the status of the report. The status messages are as follows-

*Success - Report is generated successfully.

*Scheduled - A report generating schedule is set.

*Running - A report job is running.

*Failed - Report execution failed for one or more selected switches/fabrics or an issue occurred during running of the report job.

*Unknown - Job state could not be identified.

Created At

Specifies the time at which the report was created.

Last Executed

Specifies the time at which the report was last generated.

Start Date

Specifies the date at which the report generation is scheduled to start from.

End Date

Specifies the date at which the report generation is scheduled to end at.

The Internal tab displays the report jobs that have been created by DCNM. For example, Pre and Post-ISSU report jobs that are created by the ISSU wizard are considered as internal jobs. However, you can only view report job information and history for the report jobs in this tab. You cannot delete a report job displayed under this tab as any deletion may affect the working of a DCNM feature that depends on this report.

You can also watch the video that demonstrates how to use the Programmable Report application in Cisco DCNM. See Programmable Report.

Creating a Report Job

To create a report job, perform the following steps:

Procedure

Step 1

Click Create Report icon.

The Create Report window is displayed.

Step 2

Enter a name for the report job in the Name field.

Step 3

Specify the frequency at which the report job should be run by selecting the required button next to Recurrence. For this use-case, select Now.

The Recurrence options are as given below:

*Now - The report is generated now.

*Once - The report is generated once at the specified time.

*Daily - The report is generated daily at a specified time between the Start Date and End Date.

*Weekly - The report is generated once a week at a specified time between the Start Date and End Date.

*Monthly - The report is generated once a month at a specified time between the Start Date and End Date.

*Periodic - The report is generated periodically in a time period between the specified Start Date and End Date. The interval of time between the reports can be specified in minutes or hour(s).

Note 

When you are creating a Periodic NVE VNI Counters report, the report generation frequency has to be set to 60 minutes or more. If the frequency is less than 60 minutes, an error message is displayed.

*Ondemand - The report is generated on demand. This report can only be generated by clicking the Rerun icon in the Report window.

Note 

The Start Date and Time and End Date and Time are displayed in a 24-hour format.

Step 4

Specify the devices or fabrics on which the report job should be run to generate the report.

Step 5

Click Next. Select a template from the Template drop-down list in the Create Report window. Each report template has a device or fabric tag associated with it.

The following pre-defined templates are available:

Device scope-

*switch_inventory

Fabric scope-

*fabric_nve_vni_counter

*fabric_resources

*sfp_report

In addition to the templates listed above, any other templates that have been created by you will also be listed here. For more information on default templates and creating customized templates, refer Template Library.

Templates are listed based on the associated tags. If you select the Device scope, the templates with the device tag are listed in the drop-down list. If you select the Fabric scope, the templates with the fabric tag are listed in the drop-down list.

Step 6

Click Create Job. A pop-up comes up stating that the Job report has been created successfully. Click the Refresh icon in case the newly created job report is not displayed in the list. When you hover over the Status column for the new report, the status is Running which indicates that a report is currently being generated. The status will change to a green tick indicating Success after the report has been successfully generated.


Viewing a Report Job

Click a report title from the list of displayed report jobs to view the required information.

The Report window is displayed. The number of errors, warnings, info, and success messages that are color coded and displayed in this window depends on the report details. Errors are displayed in red, Warnings in yellow, Info in blue and Success in green. The summary is not considered for the generation of these numbers.

Reports can be generated for multiple devices. You can also see a timeline on the left of the window indicating the time at which a report was generated. You can click an item in this timeline to display the report that was generated at that moment. You can also display the reports that are generated in a specific time-frame by selecting a Start date and End date.

Click View Details to display detailed information.

The Details tab displays a report summary along with other relevant information based on the type of report template.

The report detail is logically grouped into sections. Each section is displayed separately with a collapsible widget. The number of errors, warnings, info, and success messages generated in the report is color-coded and is displayed on the top right part of the window.

Click the Commands tab to display the commands that have been executed to generate the report. The commands are displayed based on the templates and the API that is used to run the commands on the device. For example, in the switch_inventory template, the show version, show inventory and show license usage commands are run to retrieve information. Note that the commands are displayed only if the show_and_store API is used to run the commands on the device.

Downloading Report Information

To download report information, click the Export Report icon in the Details tab. To download the commands along with the outputs, click the Export Report icon in the Commands tab.

Detailed information about the report is then displayed in a separate window.

Deleting a Report

To delete a report, select a report on the report timeline that has to be deleted and click the Delete icon.

A pop-up window is displayed asking for confirmation to delete the report. Click Yes to delete the report.

Comparing Reports

You can compare any two reports that have been generated from the same report job.

To compare reports, perform the following steps:

Procedure

Step 1

Select the Add to compare checkboxes in a Report window. The number of reports that have been selected for comparison is indicated by the red colored number icon next to the X at the top right of the window.

Step 2

Click Compare Reports icon at the top right of the window.

Step 3

The Compare Reports window is displayed with a side-by-side comparison.


Deleting a Report Job

To delete a report job, select the checkbox next to the report job that has to be deleted and click the Delete Report icon.

Deleting a report job also deletes all the reports that have been generated by that report job.

Editing a Report Job

To edit a report job, perform the following steps:

Procedure

Step 1

Select the checkbox next to the report that has to be edited and click the Edit Report icon. Note that only one job can be edited at a time.

Step 2

The Create Report window is displayed. You can edit the Start Date & Time, End Date & Time, Period, and Device or Fabric selected. After editing the required parameters, click Next.

Step 3

Click Update Job.

A pop-up window is displayed indicating that the report job has been updated successfully.


Rerunning a Report Job

On the Report window, select the checkbox next to the report that has to be generated again and click the Rerun Report icon to run a report job again. A pop-up window is displayed indicating that the report job has been run again successfully.

You can use the re-run option to generate a report before the scheduled execution time. In case of an Ondemand job, you need to click the Rerun Report icon to generate the report.

Displaying Report Job History

To display report job history, select the checkbox next to the report job for which the history has to be displayed, and click the History icon. The Job History window is displayed. You can view the last 100 entries per report job.

Downloading Report Job Information

To download report job information as a CSV file, click the Download icon, select the location to which the CSV file should be downloaded to, and click OK. A CSV file with information about the report job is downloaded.

Report Purging

Purging reports leads to creation of space for new reports. A separate report index is created for each report job as each report job can have a different recurrence interval. So, the number of reports that are generated in a given period of time may be different for different report jobs. Separate report indexes help in purging the reports easily. Each report index has a maximum size limit of 100MB and a maximum report count of 500. If the limits are exceeded, the older reports are deleted to make space for new reports.

At any instant, only 70% of the maximum threshold value is retained. For example, consider a scenario in which the maximum report index size is 100MB. On purging, only reports that take up to 70MB space on an average are retained. This provides space for new reports that are generated. The maximum report count of 500 also has a threshold value of 70%.

  • To modify the limits and the threshold percentage values, use the following REST API:

    URL: appcenter/Cisco/preport/integrated/admin/reportconfig

    METHOD: POST

    You can configure one or more threshold attributes and values.

    {
    <threshold attributes>: <value>
    }

    The <threshold attributes> are given below-

    MAX_REPORT_SIZE: Maximum size of the report index in KB

    MAX_USAGE_PERCENTAGE: Maximum percentage of “MAX_REPORT_SIZE” to retain

    MAX_NUMBER_OF_REPORTS: Maximum number of reports

    MAX_NUMBER_OF_REPORTS_PERCENTAGE: Maximum percentage of

    “MAX_NUMBER_OF_REPORTS” to retain

    MAX_HISTORY_SIZE: Maximum size of history in KB

    MAX_HISTORY_PERCENTAGE: Maximum Percentage of “MAX_HISTORY_SIZE” to retain

    MAX_NUMBER_OF_HISTORY: Maximum number of historical reports to retain

    MAX_NUMBER_OF_HISTORY_PERCENTAGE: Maximum percentage of

    “MAX_NUMBER_OF_HISTORY” to retain

    Enter integers for the <value> attribute.

  • *To retrieve the currently configured limits, use the following API:

    URL: appcenter/Cisco/preport/integrated/admin/reportconfig

    METHOD: GET

  • To retrieve current utilization statistics, use the following API:

    URL: appcenter/Cisco/preport/integrated /admin/index/stats

    METHOD: GET

  • Reports are purged once a day at 12 AM. You can also initiate a purge. To initiate a purge, use the following-

    REST API:

    URL: appcenter/Cisco/preport/integrated/admin/purge/report

    METHOD: POST

  • Report execution history is stored in a single index for all the jobs and purged at even hours. The maximum index limit for report execution history is 1000 and the maximum size allowed is 500MB. To change these limits, use the following REST API:

    URL: appcenter/Cisco/preport/integrated/admin/reportconfig

    METHOD: POST

  • To initiate a purge of the report execution history, use the following REST API:

    URL: appcenter/Cisco/preport/integrated/admin/purge/history

    METHOD: POST

  • To initiate a purge of both reports and report execution history, use the following REST API:

    URL: appcenter/Cisco/preport/integrated/admin/purge

    METHOD: POST

Compute

This tab displays the existing compute nodes. The tab shows nodes that are part of the hosting infrastructure. The uptime indicates how long they have been part of the infrastructure. In a High Availability (HA) setup, both the active and the standby nodes appear as joined. In clustered mode, the compute nodes status indicate if the nodes are joined or discovered.

Compute tab.


Note

If the NTP server for compute nodes is not synchronized with the NTP server for DCNM Servers (Active and Standby) and Computes, you cannot configure a cluster.

The certificates are generated with a timestamp. If you configure the Compute nodes using a different NTP server, the mismatch in timestamp will not allow to validate the certificates. Therefore, if the compute cluster is configured despite of a mismatch of NTP server, the applications will not function properly.


Note

In clustered mode, the Cisco DCNM servers will not appear under the Compute tab.


The following table describes the fields that appear on Applications > Compute.

Table 3. Field and Description on Compute Tab

Field

Description

Compute IP Address

Specifies the IP Address of the Compute node.

In-Band Interface

Specifies the in-band management interface.

Out-Band Interface

Specifies the out-band management interface.

Status

Specifies the status of the Compute node.

  • Joined

  • Discovered

  • Failed

  • Offline

Memory

Specifies the memory that is consumed by the node.

Disk

Specifies the disk space that is consumed on the compute node.

Uptime

Specifies the duration of the uptime for a compute node.

When you install a compute node with correct parameters, it appears as Joined in the Status column. However, the other two computes appears as Discovered. To add computes to the cluster mode from Cisco DCNM Web UI, see Adding Computes into the Cluster Mode.

To configure or modify the Cluster Connectivity preferences, see Preferences.

Preferences

This tab is relevant to the cluster mode of deployment, where the application instances are placed. This tab enables you to compute cluster connectivity and configure the Cluster Connectivity preferences.

Preferences Tab

Compute Cluster Connectivity

The fields show the IP address that is used to configure the connectivity interfaces for the cluster node. The IP addresses for in-band fabric, out-of-band fabric, and Inter-Application are displayed.

Object Archival Configuration

The NIA application collects tech support logs for all switches in Fabric, and determines the advisory, based on the data. The logs are saved on the Cisco DCNM server for further analysis or troubleshooting. If you need to download these logs before their life span ends or to create some space on the DCNM server, you can move the logs to a remote server.

In the URI field, enter the relative path to the archive folder, in the format host[:port]/[path to archive]. Enter the username and password to access the URI, in the username and Password field. Click Submit to configure the remote server.

Failure Scenario

Recommendation for minimum redundancy configuration with a DCNM OVA install is as follows:

  • DCNM Active Node(Active) and compute node 1 in server1.

  • DCNM Standby Node and compute node 2 in server2.

  • Compute node 3 in server3.

When DCNM Active node is down, the Standby node takes full responsibility of running the core functionality.

When a compute node is down, the applications may continue to function with limited functionality. If this situation persists for a longer duration, it affects the performance and reliability of the applications. When more than one node is down, it affects the applications functionality and most of the applications fail to function.

You must maintain 3 compute nodes at any time. If a compute node goes down, rectify the issue as soon as possible, for the services to function as expected.

Compute Node Disaster Recovery

When a compute node is lost due to a disaster and is irrecoverable, you must install another compute node with the same parameters. This will essentially appear as a reboot of the compute with lost data and it tries to join the cluster automatically. After it joins the cluster, all the data will synchronize from the other two compute nodes.