Reports

About Reports

You can utilize data from the Reports feature to derive insights into your network and its operation. By reporting this data in several formats and providing flexible scheduling and configuration options, both data and reports are easily customized to meet your operational needs.

The Reports feature supports the following use cases:

  • Capacity planning: Understanding how devices within your network are being utilized.

  • Change of pattern: Tracking how usage pattern trends change on the network. Usage pattern trends may include clients, devices, bands, or applications.

  • Operational reporting: Reviewing reports about network operations, such as upgrade completions or provisioning failures.

  • Network health: Determining the overall health of your network through reports.


Note


New use cases for Reports will be added in future releases. Review future Cisco DNA Center platform release notes for information.


Run Your First Report

Perform this procedure to begin running specialized data reports about your network. You can configure data reports using the Reports window in the Cisco DNA Center GUI.

Figure 1. Reports Window

Before you begin

Run a successful Discovery job in Cisco DNA Center. You can check whether a Discovery job is successful in Device Inventory. From the Menu icon (), click Provision > Inventory to view the results.

Procedure


Step 1

Click the menu icon () and choose Reports.
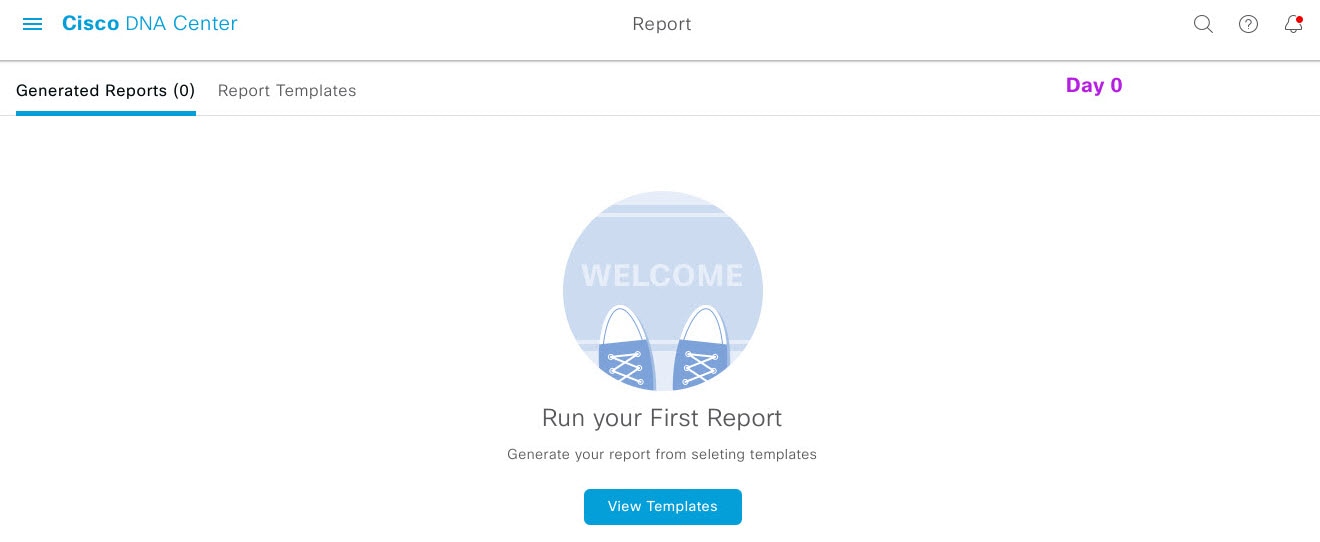
A Run Your First Report window appears.

Figure 2. Run Your First Report Window

Step 2

Click Start.

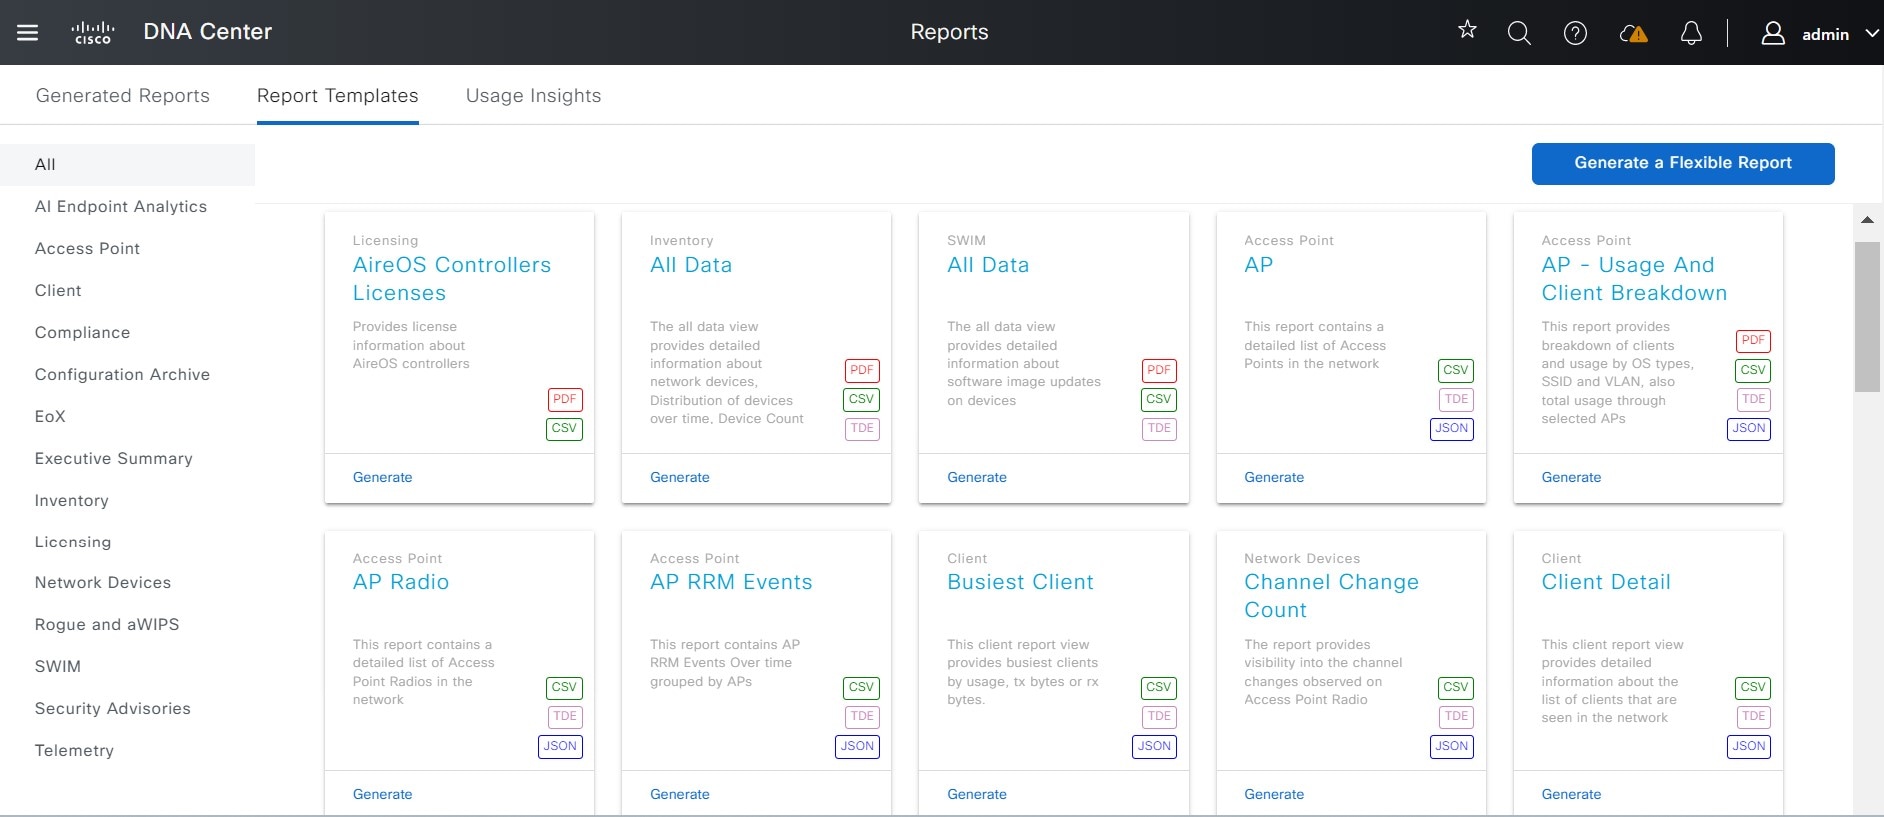
The Report Templates window opens and displays the supported reporting categories in a slide-in pane. A link represents each category. Click a link to view only the supported reports for that category.

For this release, reporting is supported for the following categories:

Note


The Access Point, Client, and Executive Summary reports support up to 90 days of data retention.

For this procedure and as an example, Clients is selected. Available options for the reports and displayed in the GUI are dependent upon the type of report selected.

Step 3

After clicking a link, review the Report Templates window for that selected category.

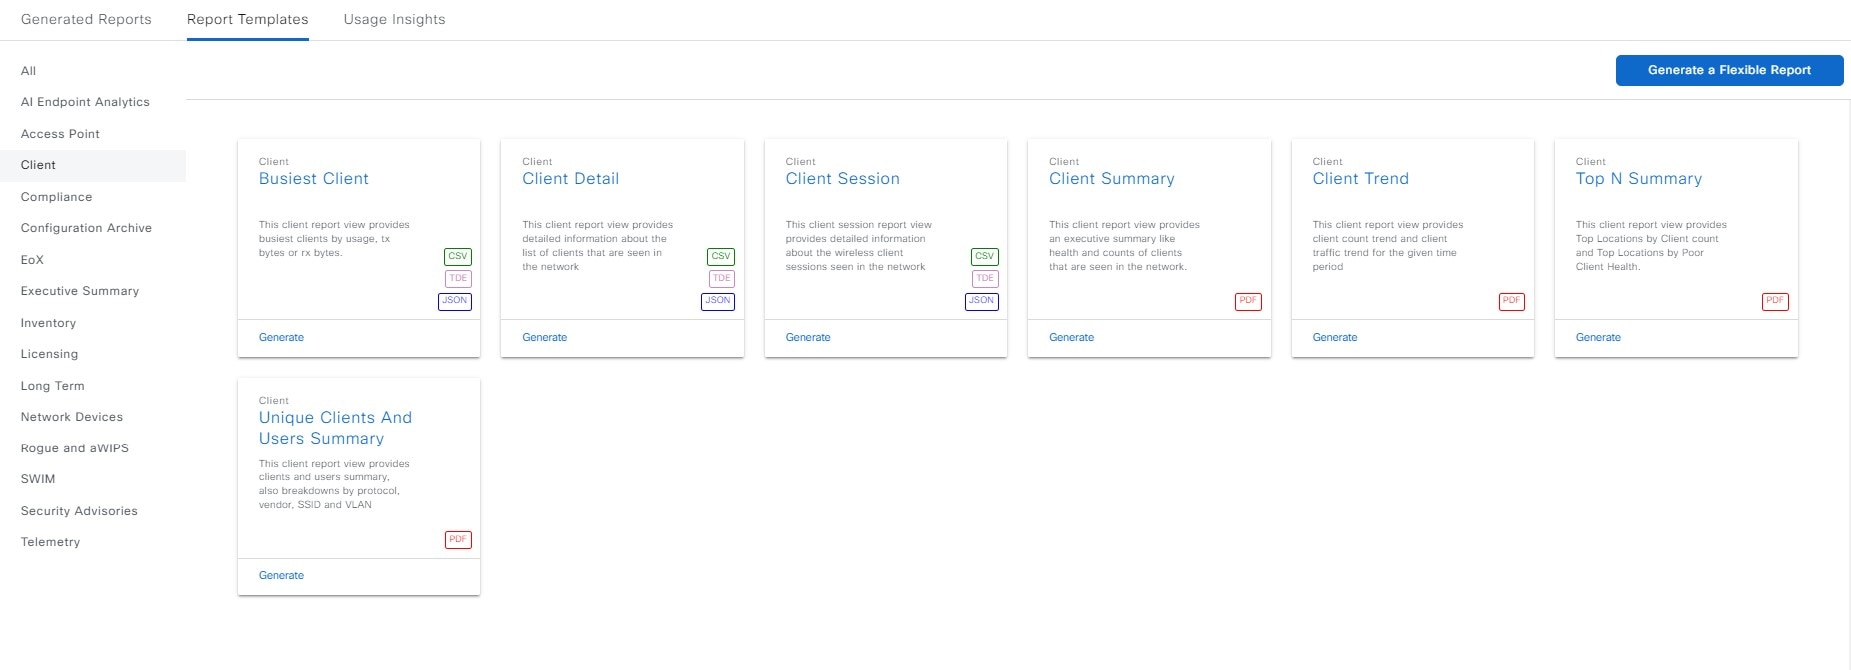
Figure 3. Reports Templates Window

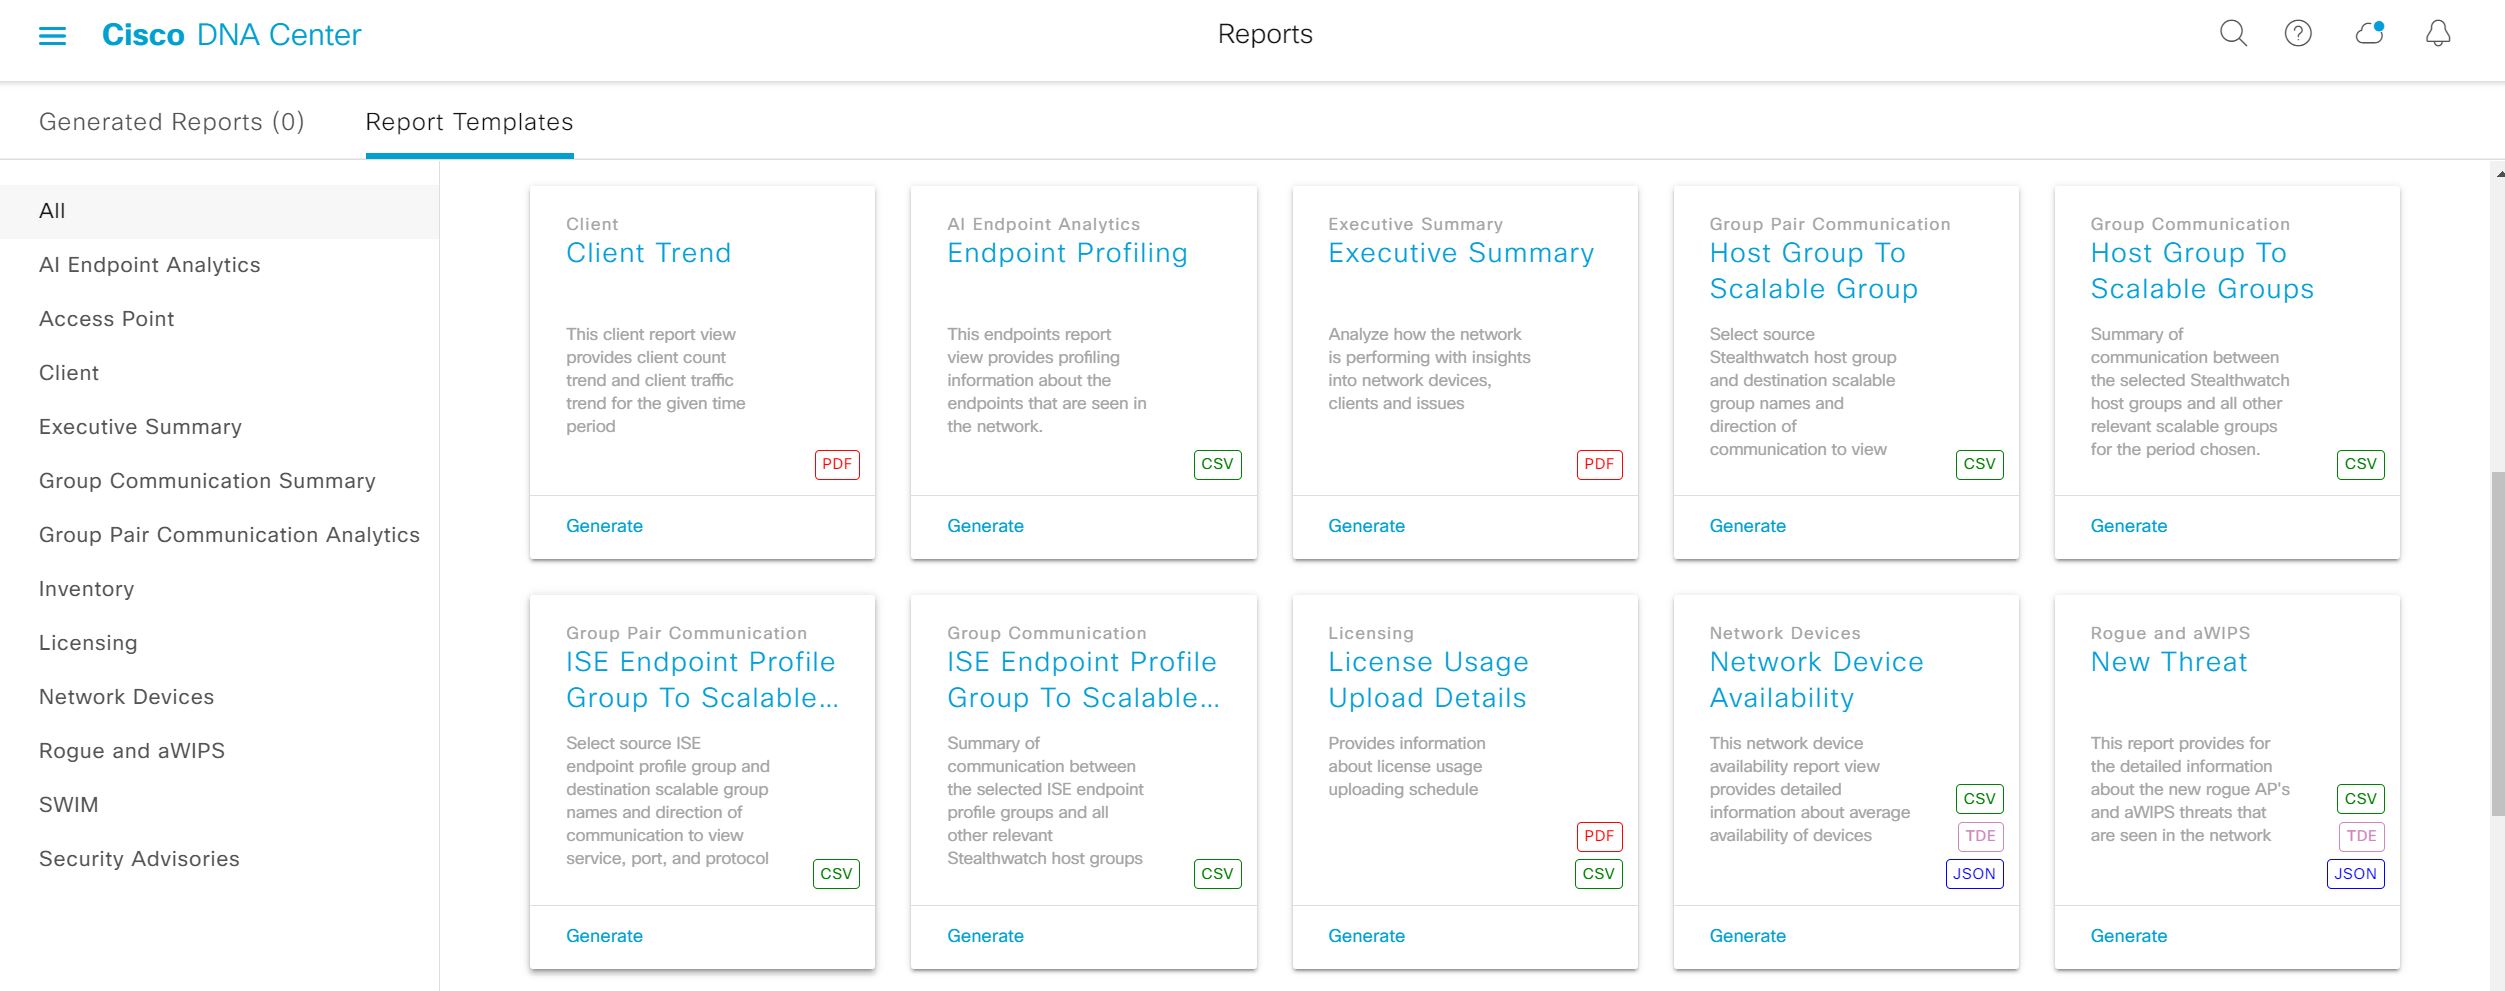
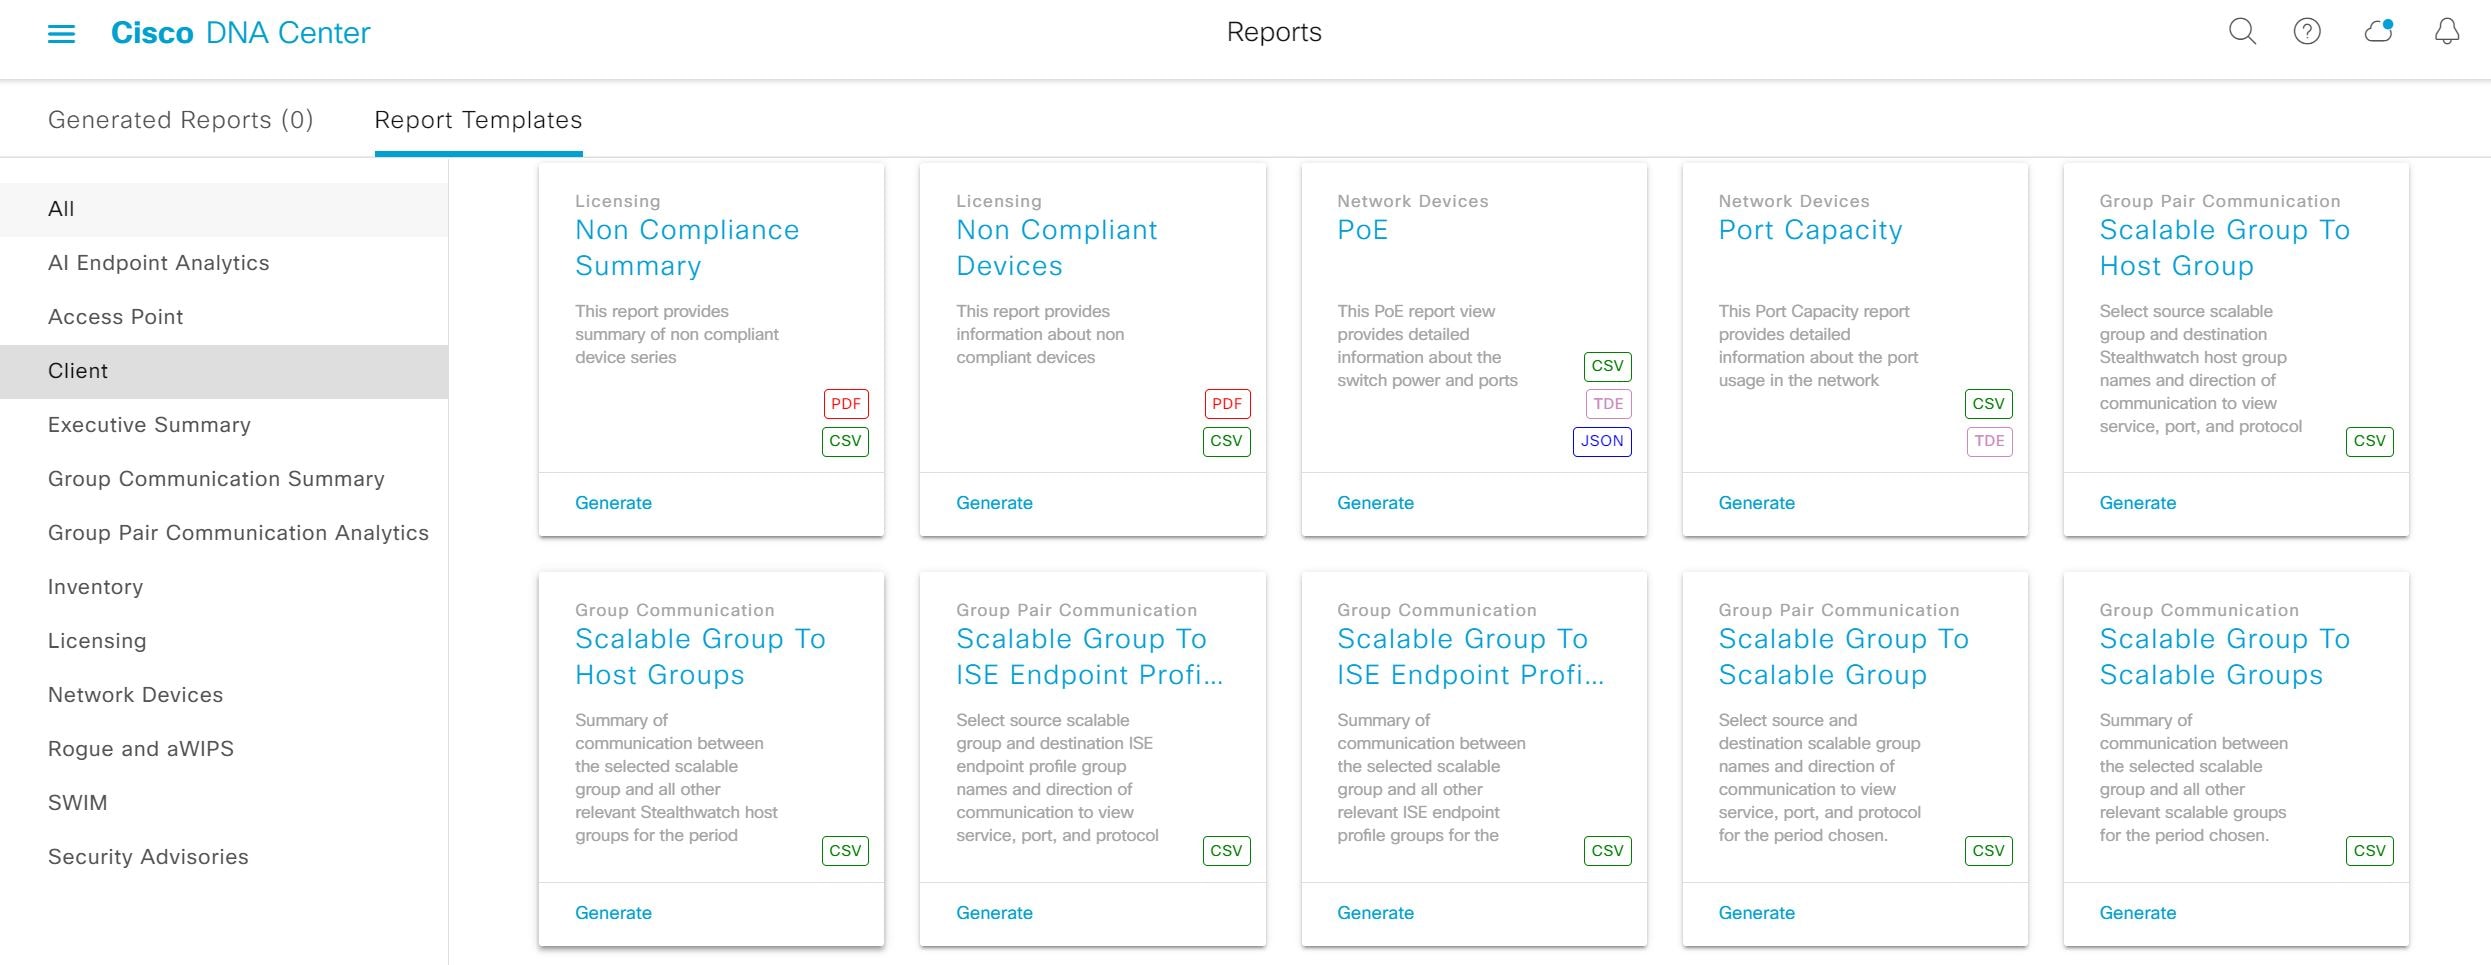
The Report Templates window displays supported report templates. Each template is represented by a tile and contains information about the report and links to configure (generate) a report. Determine which template you wish to use to generate a report. For example, for a Client report you can create a Client Summary, Client Detail , Top N Summary, Client Trend, or Client Session report. Within each tile are also icons that represent the supported file types for the reports (PDF, CSV, TDE, or JSON).

Step 4

In the tile, click the header to view a sample report.

A Preview window appears for the sample report. Use the side bar in the window to scroll down and review the entire sample report. The following data is presented:

  • Applied filters (data filters that were used to build the report).

  • Data metrics and summaries

  • Graphical representation of the data (including line, bar, and pie graphs).

  • Tables that assist you in analyzing the data.

Note


You can use the sample report to plan how you want your report to look.

Step 5

Click X to close the preview.

Step 6

In the tile, click the Generate link to configure parameters to build a report.

The Generate window opens where you can select a format type for the report, apply data filters for your reports, as well as set up schedules for the actual report generation.

Step 7

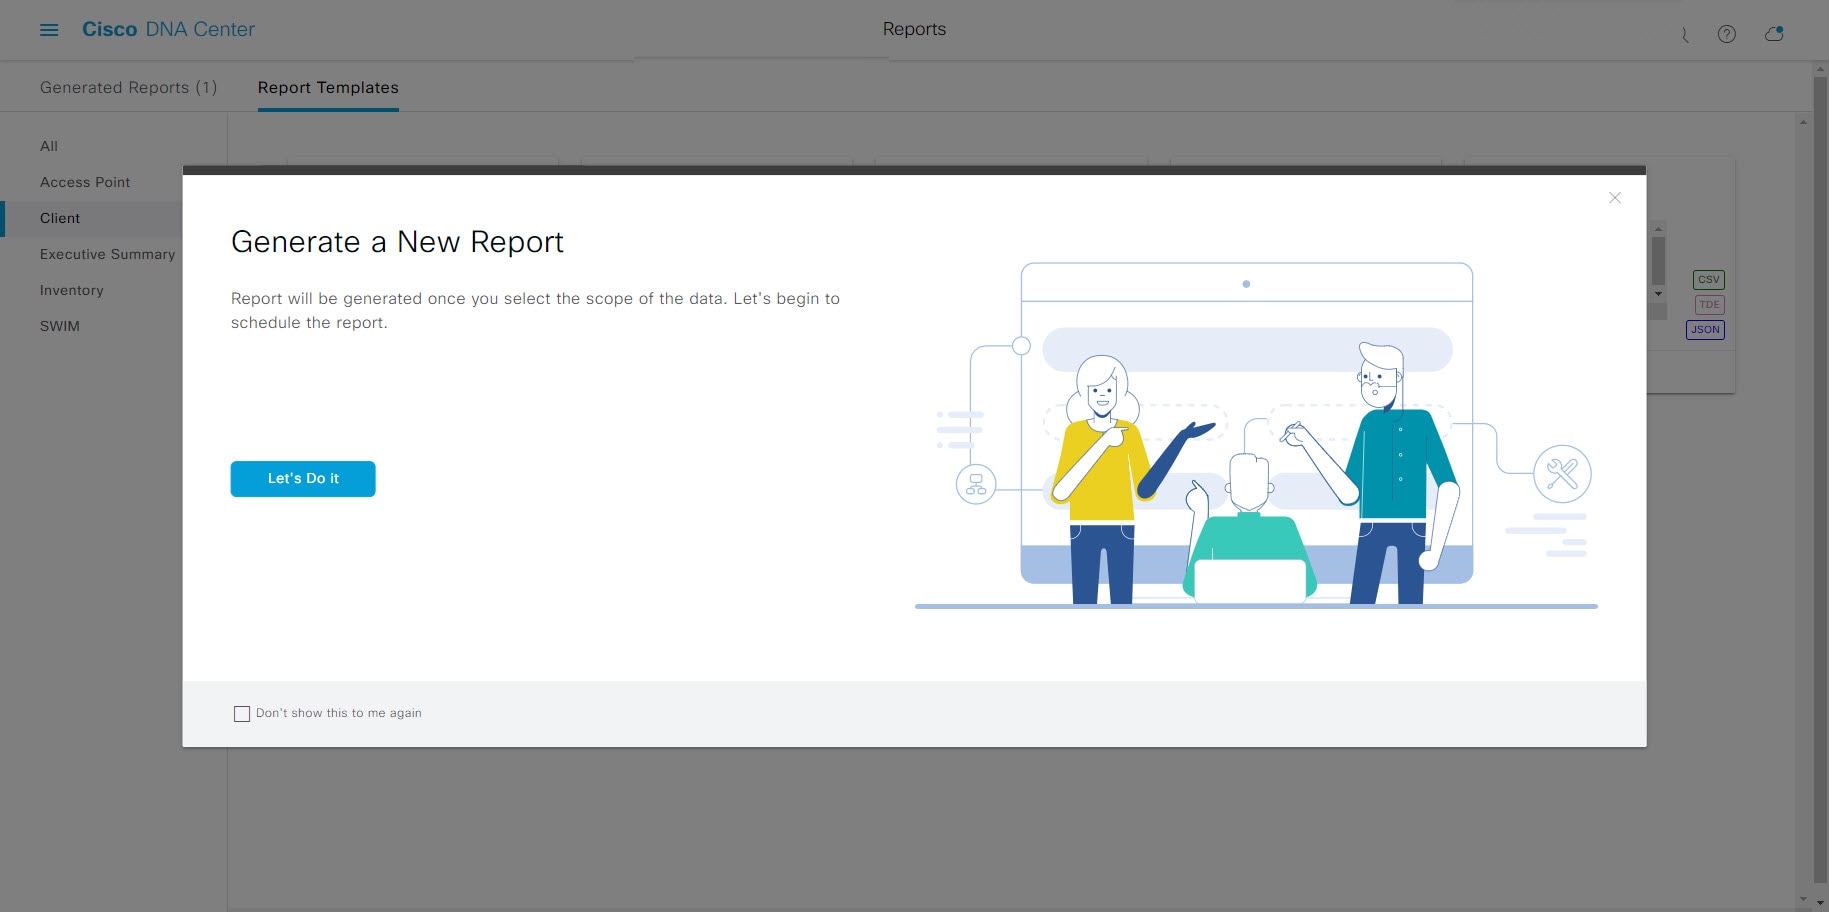
In the Generate a New Report window, click Let's Do It to get started.

Figure 4. Generate a New Report

The Select Report Template window opens.

Step 8

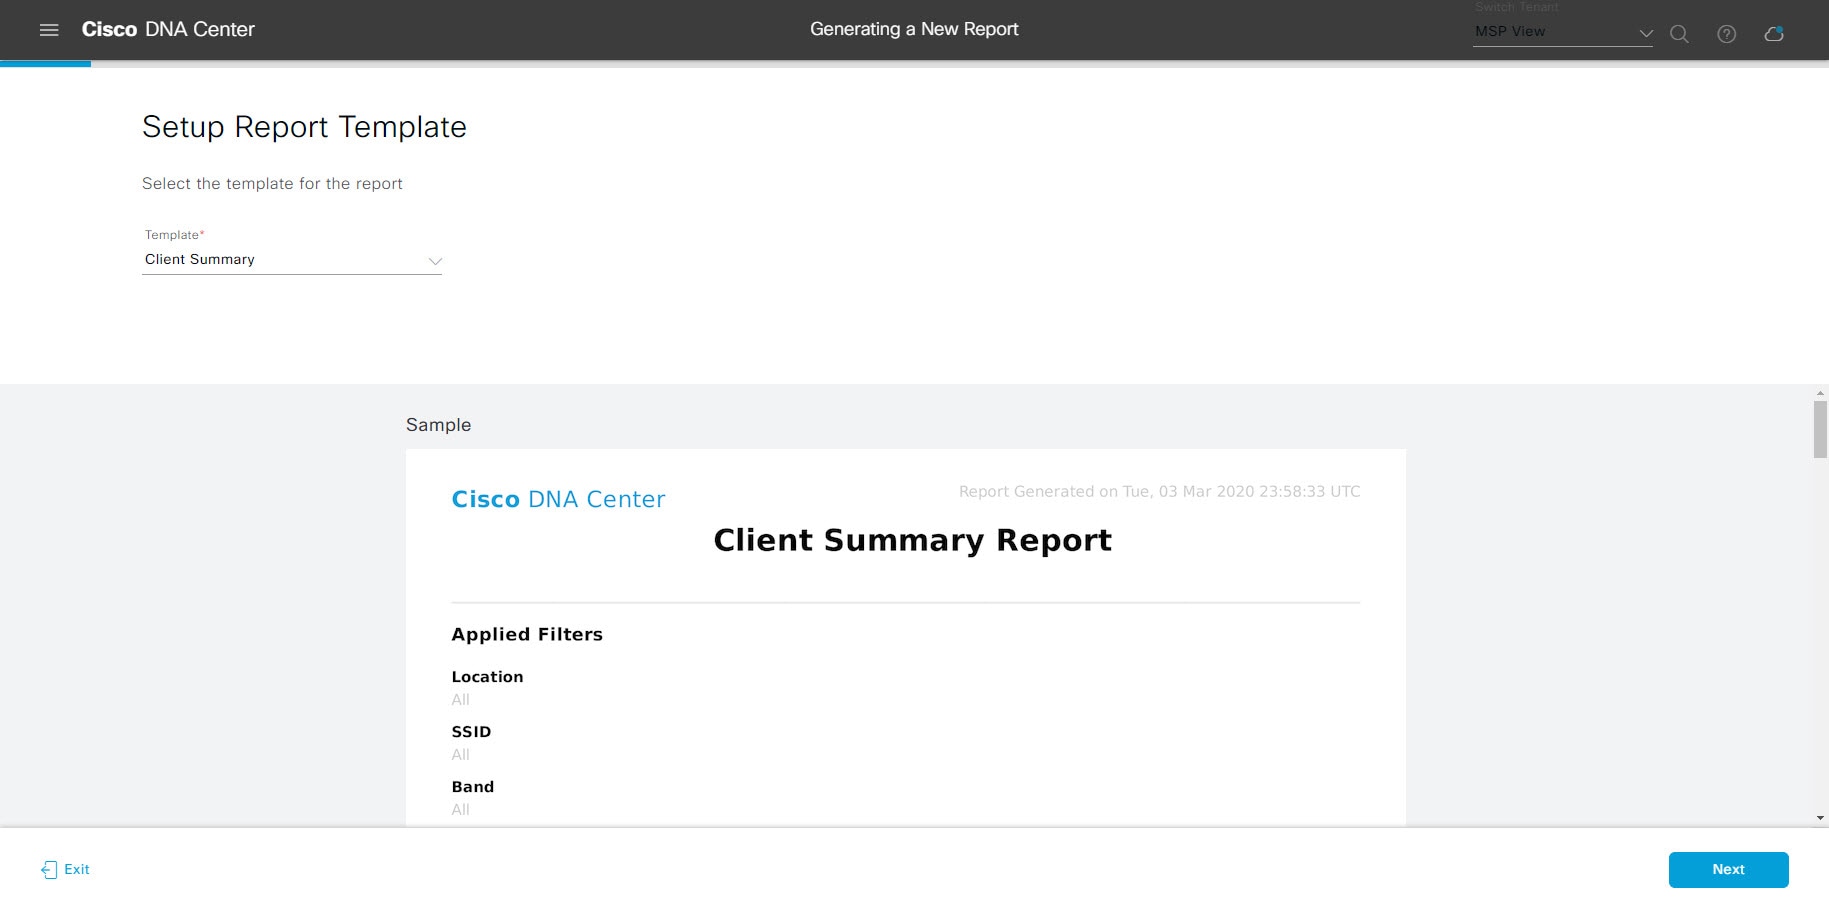
In the Select Report Template window, select the template for the report.

The Template consists of the individual report types within the categories for the release.

You can review an autogenerated sample in the same window.

Figure 5. Setup Report Template

Click Next. The Setup Report Scope window opens.

Step 9

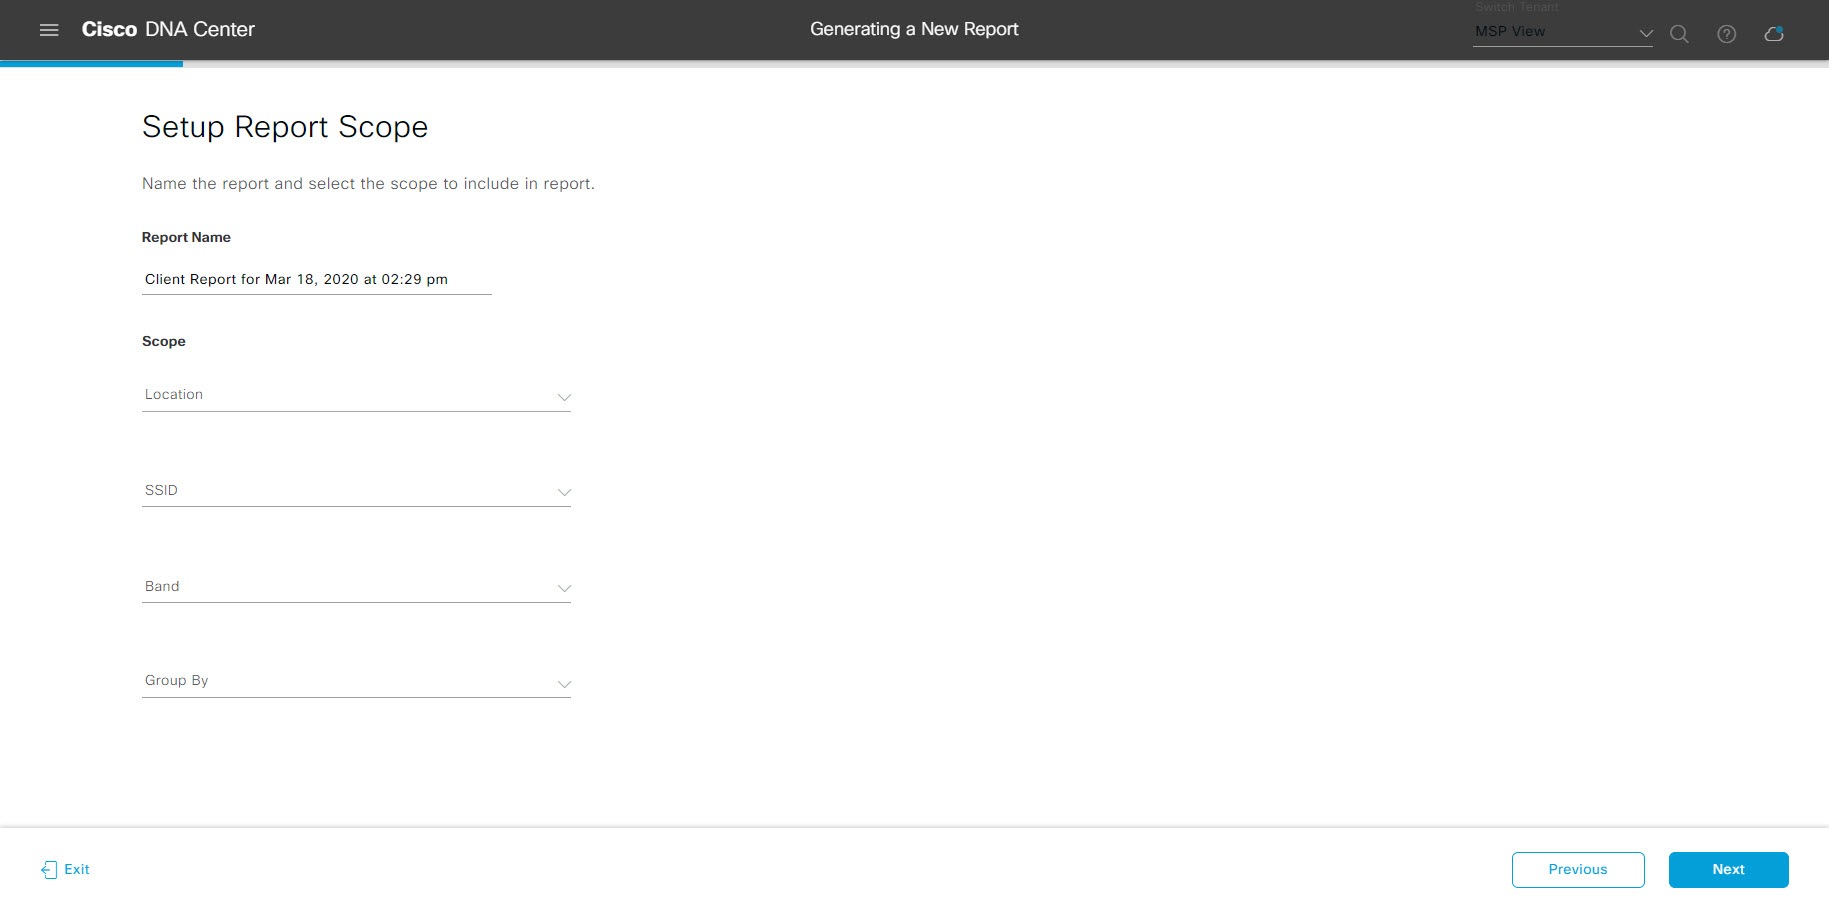
In the Setup Report Scope window, enter a name for the report and select the scope.

Enter a report name in the Report Name field and click in the Scope field to display the available filter. Click the filter options that you want for the report.

Note


The Setup Report Scope options change depending upon the selected Template Group.

Figure 6. Setup Report Scope

Click Next. The Select File Type window opens.

Step 10

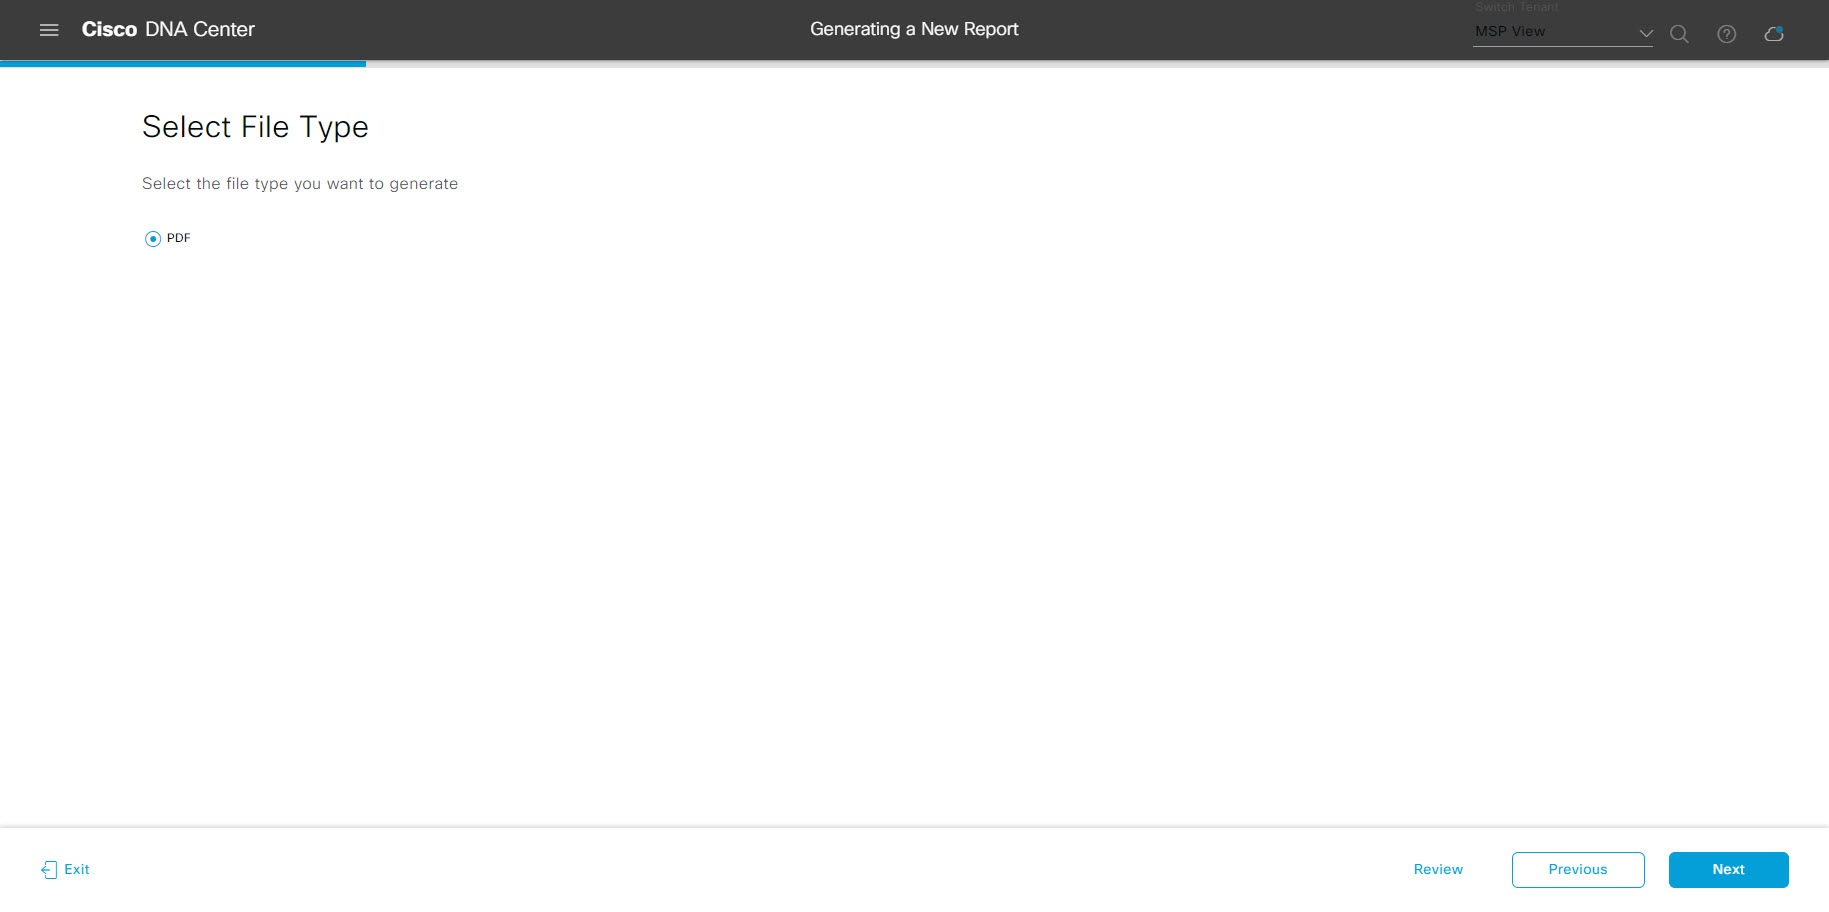
In the Select File Type window, select the file type for the report.

Depending upon the report that you are creating, the following File Type options may be available:

  • PDF

  • CSV

  • Tableau Data Extract

  • JSON

For the CSV, JSON, and Tableau Data Extract file types, a Fields option displays that permits you to select attributes (additional fields) for the CSV, JSON, and Tableau Data Extract results.

Figure 7. Select File Type

Click Next. The Schedule Report window opens.

Step 11

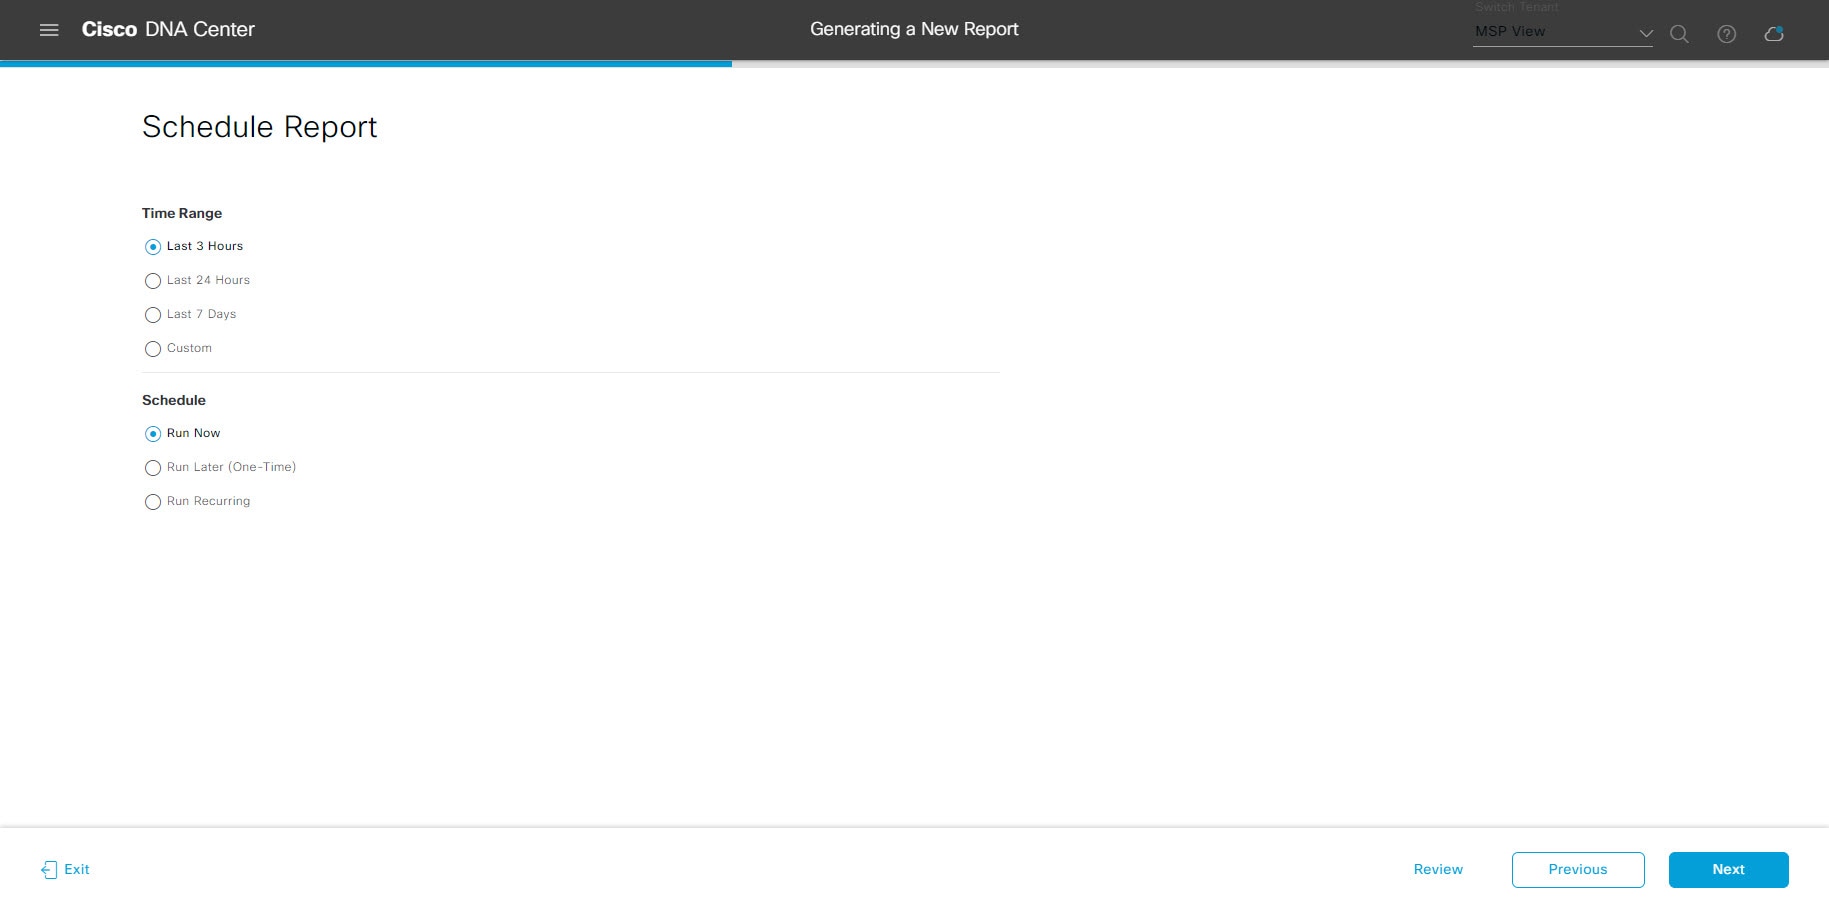
In the Schedule Report window, select the time range and schedule for the report.

The following Time Range options are available:

  • Last 3 hours

  • Last 24 hours

  • Last 7 days

  • Custom

    Note


    Clicking Custom opens up fields where you can choose the date and time interval per the specific report type, as well as the time zone (GMT) for the time range.

The following Schedule options are available:

  • Run Now

  • Run Later

  • Run Recurring

You can also select a time zone for the report when configuring with the following Schedule options:

  • Custom

  • Run Later (One Time)

  • Run Recurring

Figure 8. Schedule Report

Click Next. The Delivery and Notification window opens.

Step 12

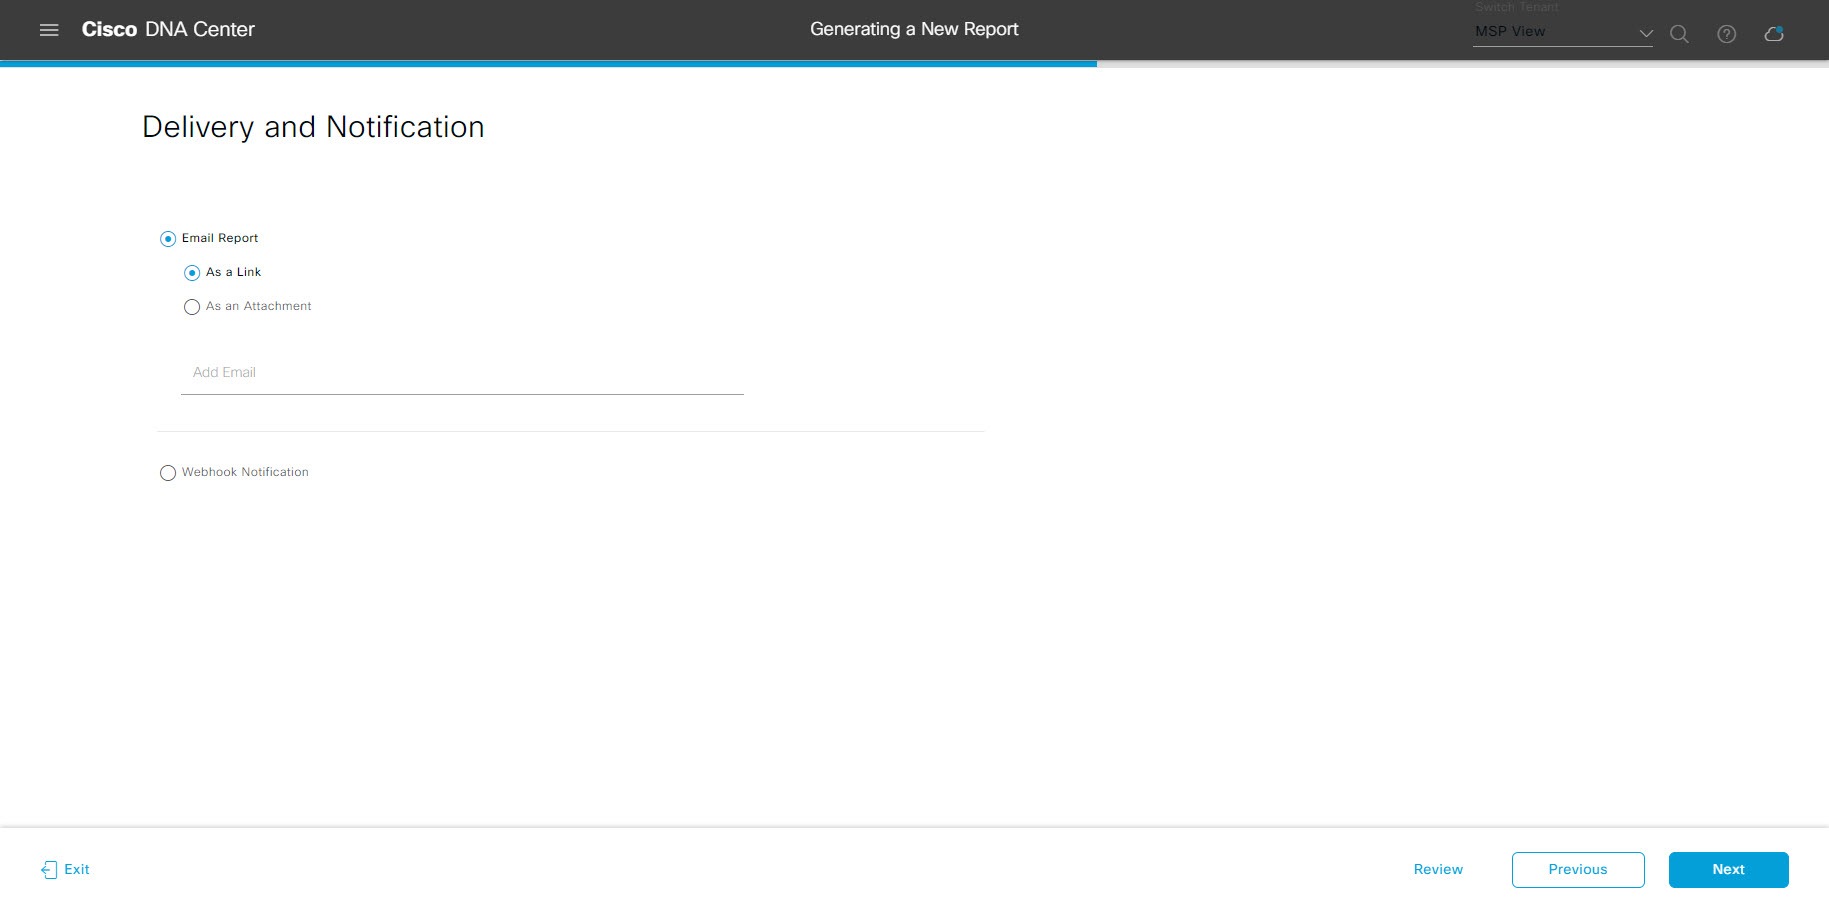
In the Delivery and Notification window, select the Delivery mechanism for the report.

The options include:

  • No delivery/notification: No email or webhook notifications sent.

  • Email Report: Email report is sent as a link or attachment.

    Note


    If you have not yet configured an SMTP server for the emails, you will be prompted to configure one. Follow the prompts to the Email tab in the GUI to configure a SMTP server. Click System > Settings > External Services > Destinations > Email tab.

    • Link: The email notification of a successfully compiled report has a link back to itself and the Generated Reports page under Reports. You can view and download the report from this link and location.

      Note


      Email notifications with embedded links to reports support up to 20 email addresses. To add multiple email addresses, you need to add each email address separately and press Enter (on your keyboard) after each addition. Cisco DNA Center platform validates the email addresses and notifies you if the syntax is incorrect.

    • Attachment: Report is attached to the email notification.

      Note


      PDF reports support email notification attachments of up to 20-MB in size and up to 10 email addresses. To add multiple email addresses, you need to add each email address separately and press Enter (on your keyboard) after each addition. Cisco DNA Center platform validates the email addresses and notifies you if the syntax is incorrect.

    Cisco DNA Center sends out the following email notifications for the report:

    • Report is in the queue waiting to be processed.

    • Report processing is in progress.

    • Report has successfully been compiled and is completed.

  • Webhook Notification: Notification is sent as a webhook to the configured webhook URL address (callback URL). Select a webhook from the drop-down list (Subscription Profile field).

    Note


    If you have not yet created a webhook, you will be prompted to create one. Follow the prompts to the Webhook tab in the GUI to configure a webhook. In general, to configure a webhook, click System > Settings > External Services > Destinations > Webhook tab.

    You will receive status webhook notifications for the report. For example, you will receive "In Queue", "In Progress", and "Success" webhook notifications. You will also be able to view these notifications in the GUI.

Figure 9. Delivery and Notification

Click Next. The Summary window opens.

Step 13

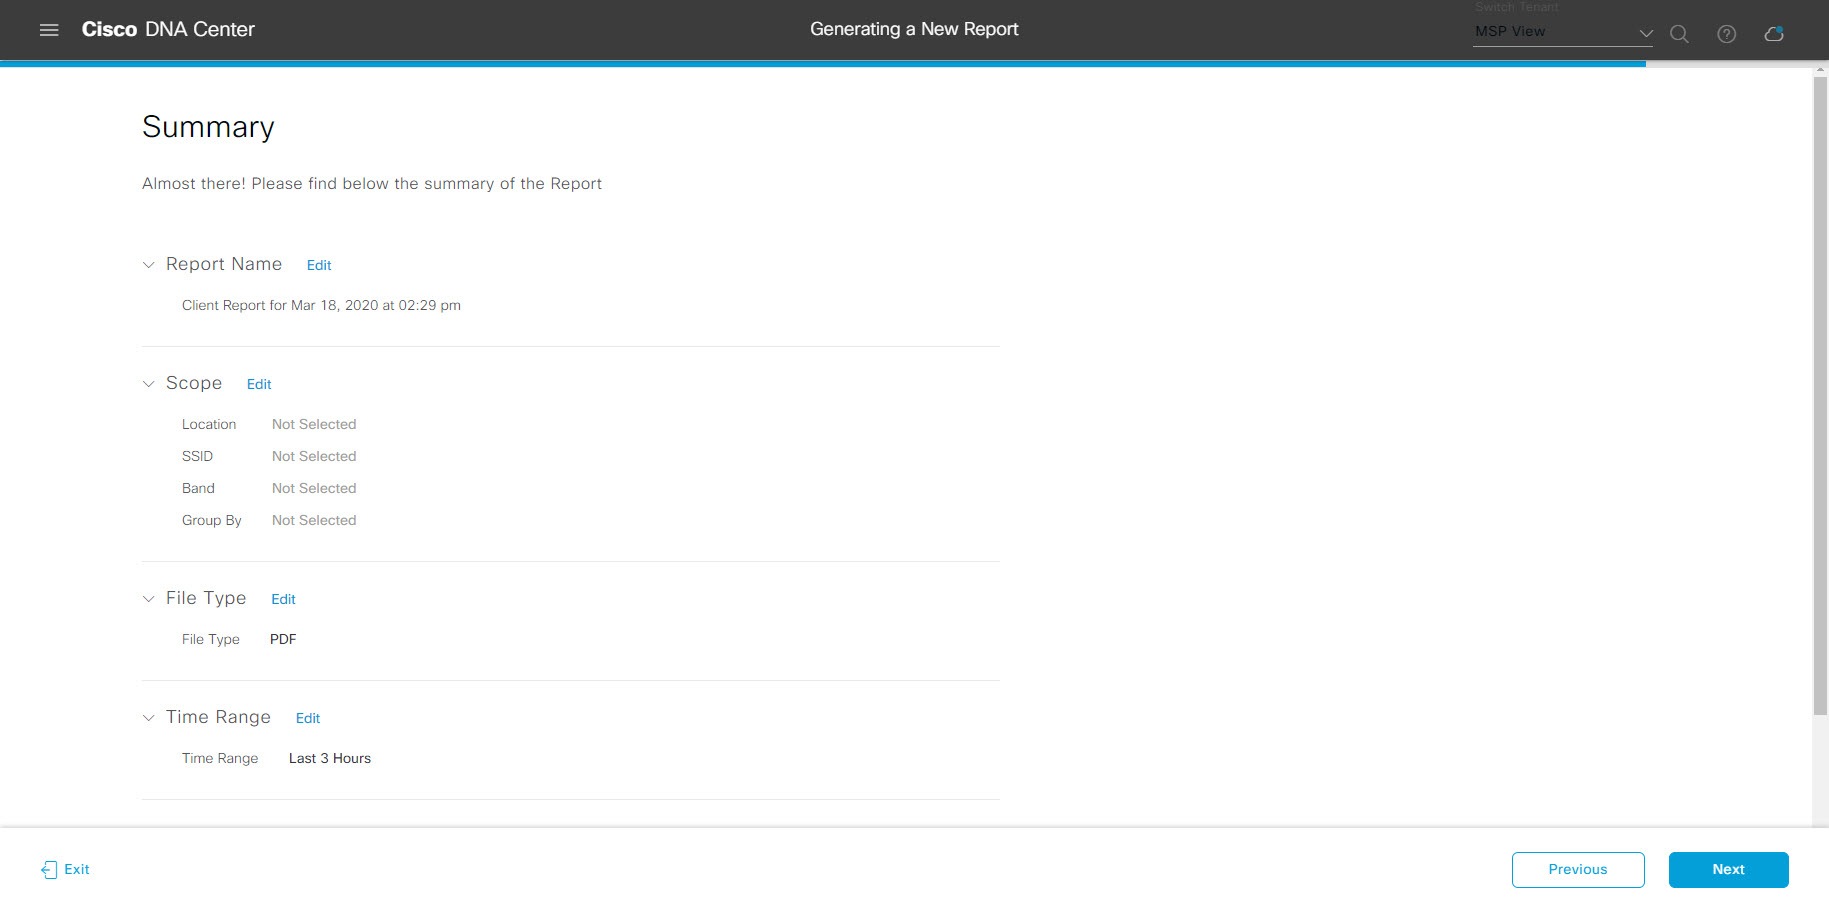
In the Summary window, review the configuration and if necessary edit any of the files.

Figure 10. Summary

Click the Next button.

After the report is generated, a success window appears.

Step 14

Click the View the Generated Reports link.

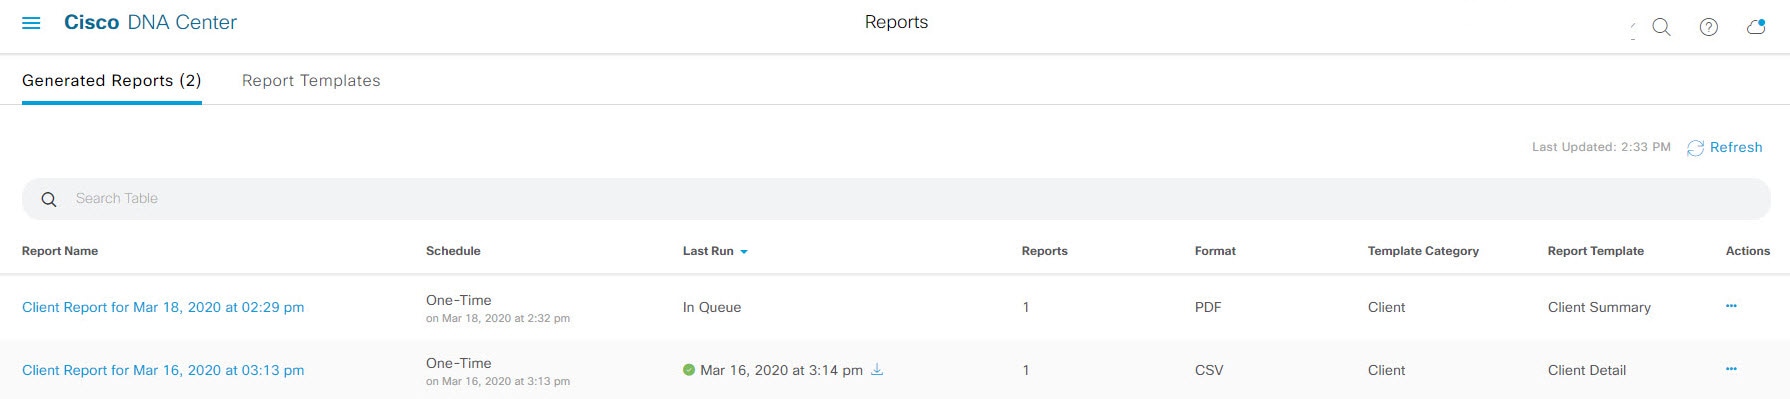
The Generated Reports window opens with instance details of the report that was scheduled.

Figure 11. Generated Reports

What to do next

Review your report instance in Generated Reports window.


Note


You can download, review, edit, duplicate, or delete the report in the Generated Reports window. For additional information, see View Generated Reports.


Run an Access Point Report

Perform this procedure to configure Access Point reports for your network. You can configure Access Point reports using the Reports window in the Cisco DNA Center GUI.

Figure 12. Access Point Reports

Before you begin

Run a successful Discovery job in Cisco DNA Center. You can check whether a Discovery job is successful in Device Inventory. From the Menu icon (), choose Provision > Inventory to view the results.

Procedure


Step 1

Click the menu icon () and choose Reports > Report Templates.
The Report Templates window opens and displays the supported reporting categories. A link represents each category. Click a link to view only the supported reports for that category.

For this release, reporting is supported for the following categories:

  • Access Point: Reports that provide data about Access Points and Access Point Radios.

  • Client: Reports that help with analyzing how the clients are performing in the network.

  • Executive Summary: Report that helps with analyzing how devices, applications, and clients are performing in the network.

  • Inventory: Report listing devices discovered by Cisco DNA Center.

  • Licensing: Reports that lists devices that noncompliant devices and the reasons for noncompliance.

  • Network Devices: Reports that provide data about the devices within your network.

  • Rogue and aWIPS: Reports that provide data about threats within your network.

  • SWIM: Report listing all the devices in network with software and versioning.

  • Security Advisories: Report that provides Cisco security advisory information on the network devices.

Note


The Access Point, Client, and Executive Summary reports support up to 90 days of data retention.

Step 2

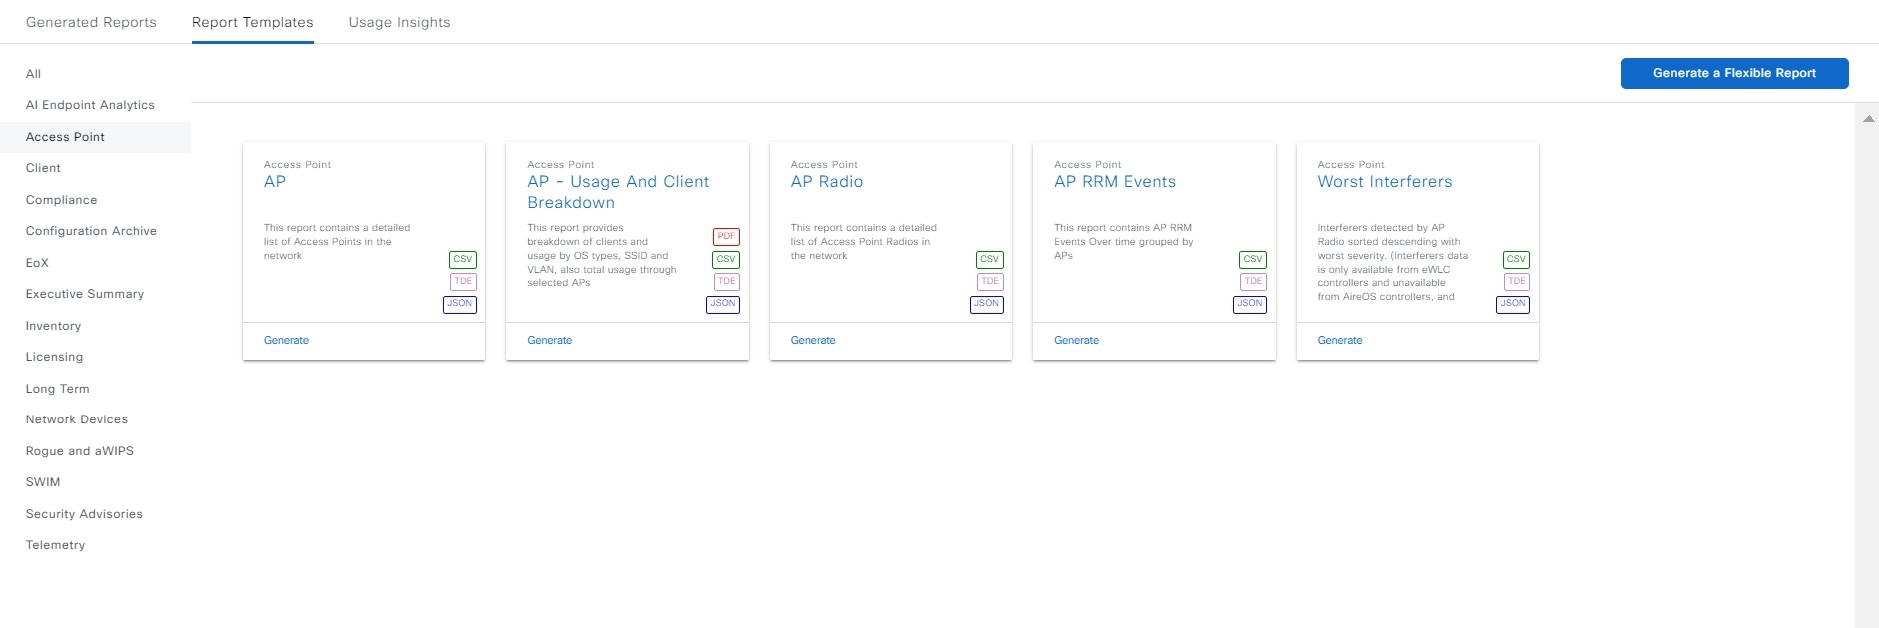
After clicking a link, review the Report Templates window for that selected category.

Figure 13. Report Templates Window

In the Report Templates window, each template is represented by a tile and contains information about the report and links to configure (generate) a report. Determine which template you want to use to generate a report. For an Access Point report, you can create an AP, AP Radio, or AP Performance report. For the Access Point report, supported file types are CSV, TDE, and JSON.

Step 3

In the tile, click the header to view a sample report.

A window appears for the sample report. Use the side bar in the window to scroll down and review the entire sample report.

Note


You can use the sample report to plan how you want your report to look.

Step 4

Click X to close the preview.

Step 5

In the tile, click the Generate link to configure parameters to build a report.

The Generate window opens where you can select a format type for the report, apply data filters for your reports, as well as set up schedules for the actual report generation.

Step 6

In the Generate a New Report window, click Let's Do It to get started.

To skip this screen in the future, check the Don't show this to me again check box.

Figure 14. Generate a New Report

Step 7

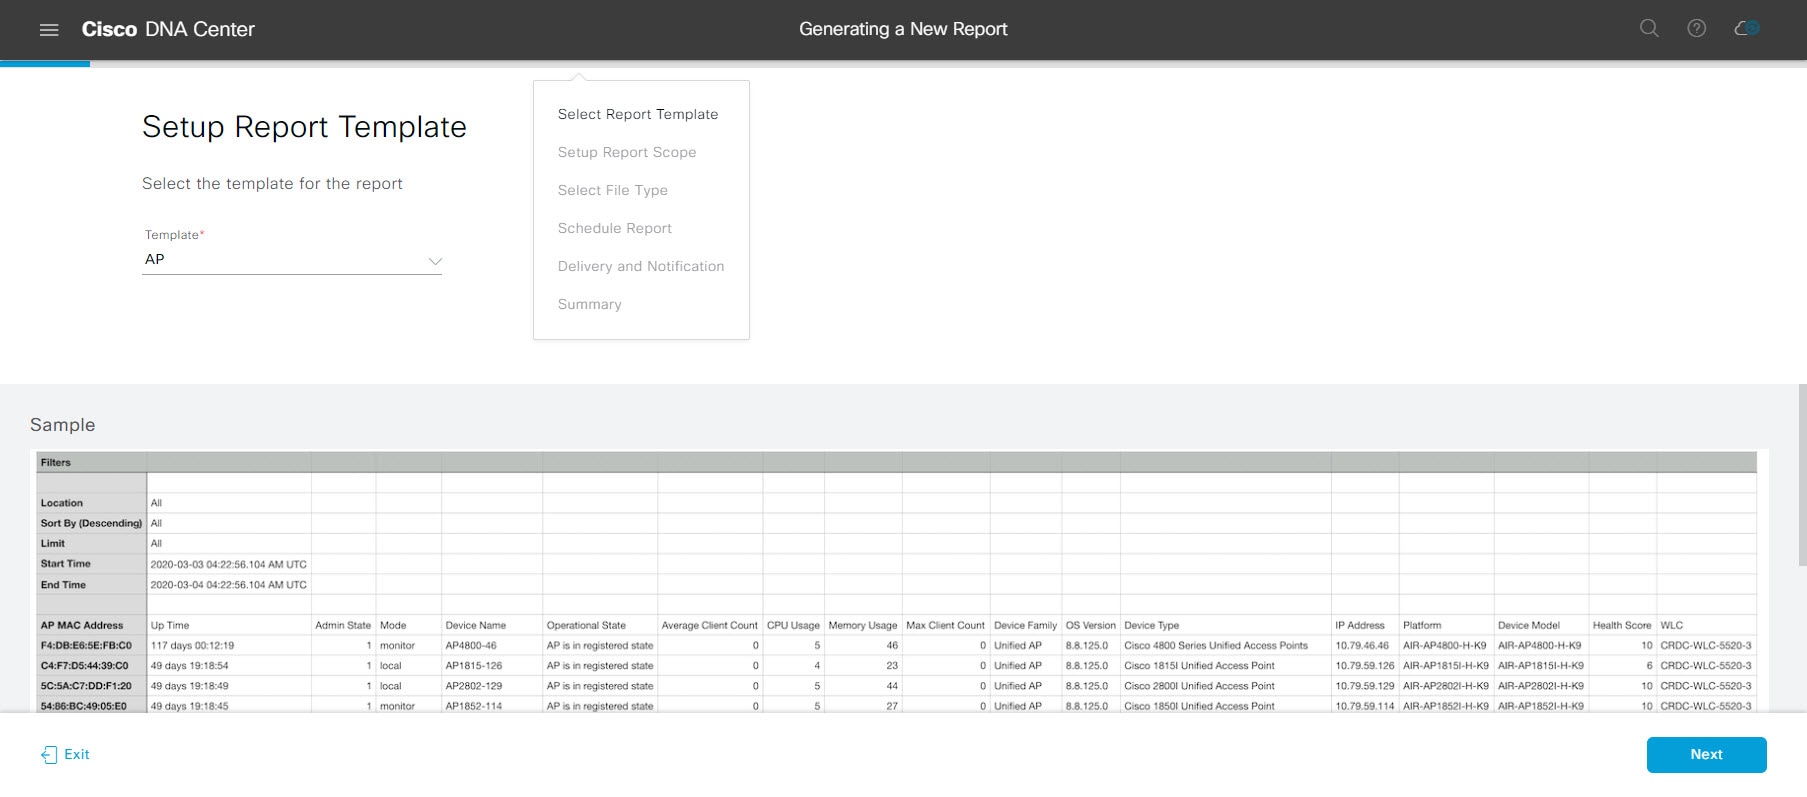
In the Select Report Template window, choose the template from Template drop-down list.

Note


The Template consists of the individual report types within the categories for the release.

You can review an auto generated sample in the same window.

Figure 15. Setup Report Template

Step 8

Click Next.

The Setup Report Scope window appears.

Step 9

In the Setup Report Scope window, name the report and select the scope.

Enter a report name in the Report Name field and click in the Scope field to display the available filter. Click the filter options that you want for the report.

Note


The Setup Report Scope options change depending upon the selected Template.

Figure 16. Setup Report Scope

Step 10

Click Next.

Step 11

In the Select File Type window, select the file type for the report.

Depending upon the report that you are creating, the following File Type options may be available:

  • PDF

  • CSV

  • Tableau Data Extract

  • JSON

For the CSV, JSON, and Tableau Data Extract file types, a Fields option displays that permits you to select attributes (additional fields) for the CSV, JSON, and Tableau Data Extract results.

Figure 17. Select File Type

Step 12

Click Next.

Step 13

In the Schedule Report window, select the time range and schedule for the report.

The following Time Range options are available:

  • Last 3 hours

  • Last 24 hours

  • Last 7 days

  • Custom

    Note


    Clicking Custom opens up fields where you can choose the date and time interval per the specific report type, as well as the time zone (GMT) for the time range.

The following Schedule options are available to schedule the report:

  • Run Now

  • Run Later (One-Time)

  • Run Recurring

Cisco DNA Center also allows you to choose a time zone for the report when configuring with the following Schedule options:

  • Custom

  • Run Later (One Time)

  • Run Recurring

Figure 18. Schedule Report

Step 14

Click Next.

Step 15

In the Delivery and Notification window, select the delivery mechanism for the report.

The options include:

  • Email Report: Email report is sent as a link or attachment.

    Note


    If you have not yet configured an SMTP server for the emails, you will be prompted to configure one. Follow the prompts to the Email tab in the GUI to configure a SMTP server. Click System > Settings > External Services > Destinations > Email tab.

    • As a Link: The email notification of a successfully compiled report has a link back to itself and the Generated Reports page under Reports. You can view and download the report from this link and location.

      Note


      Email notifications with embedded links to reports support up to 20 email addresses. To add multiple email addresses, you need to add each email address separately and press Enter (on your keyboard) after each addition. Cisco DNA Center platform validates the email addresses and notifies you if the syntax is incorrect.

    • As an Attachment: Report is attached to the email notification.

      Note


      PDF reports support email notification attachments of up to 20-MB in size and up to 10 email addresses. To add multiple email addresses, you need to add each email address separately and press Enter (on your keyboard) after each addition. Cisco DNA Center platform validates the email addresses and notifies you if the syntax is incorrect.

    Cisco DNA Center sends out the following email notifications for the report:

    • Report is in the queue waiting to be processed.

    • Report processing is in progress.

    • Report has successfully been compiled and is completed.

  • Webhook Notification: Notification is sent as a webhook to the configured webhook URL address (callback URL). Select a webhook from the drop-down list (Subscription Profile field).

    Note


    If you have not yet created a webhook, you will be prompted to create one. Follow the prompts to the Webhook tab in the GUI to configure a webhook. In general, to configure a webhook, click System > Settings > External Services > Destinations > Webhook tab.

    Cisco DNA Center sends you the following status webhook notifications for the report:

    • In Queue

    • In Progress

    • Success

Figure 19. Delivery and Notification

Step 16

Click Next.

Step 17

In the Summary window, review the configuration and if necessary edit any of the files.

Figure 20. Summary

Click Next.

After the report is generated, a success window appears.

Step 18

Click the View the Generated Reports link.

The Generated Reports window opens with instance details of the report that was scheduled.

Figure 21. Generated Reports

What to do next

Review your report instance in Generated Reports window.


Note


You can download, review, edit, duplicate, or delete the report in the Generated Reports window. For additional information, see View Generated Reports.


Run a Client Report

Perform this procedure to configure specialized Client reports for your network. You can configure Client reports using the Reports window in the Cisco DNA Center GUI.

Figure 22. Client Reports

Before you begin

Run a successful Discovery job in Cisco DNA Center. You can check whether a Discovery job is successful in Device Inventory. Click the menu icon () and choose Provision > Inventory to view the results.

Procedure


Step 1

Click the menu icon () and choose Reports > Report Templates.

The Report Templates window opens and displays the supported reporting categories. A link represents each category. Click a link to view only the supported reports for that category.

For this release, reporting is supported for the following categories:

  • Access Point: Reports that provide data about Access Points and Access Point Radios.

  • Client: Reports that help with analyzing how the clients are performing in the network.

  • Executive Summary: Report that helps with analyzing how devices, applications, and clients are performing in the network.

  • Inventory: Report listing devices discovered by Cisco DNA Center.

  • Licensing: Reports that lists devices that noncompliant devices and the reasons for noncompliance.

  • Network Devices: Reports that provide data about the devices within your network.

  • Rogue and aWIPS: Reports that provide data about threats within your network.

  • SWIM: Report listing all the devices in network with software and versioning.

  • Security Advisories: Report that provides Cisco security advisory information on the network devices.

Note


The Access Point, Client, and Executive Summary reports support up to 90 days of data retention.

Step 2

After clicking a link, review the Report Templates window for that selected category.

Figure 23. Reports Templates Window

The Report Templates window displays supported report templates. Each template is represented by a tile and contains information about the report and links to configure (generate) a report. Determine which template you wish to use to generate a report. For example, for a Client report you can create a Busiest Client, Client Summary, Client Detail , Top N Summary, Client Trend - Count and Traffic, or Client Session report. Within each tile are also icons that represent the supported file types for the reports (PDF, CSV, TDE, or JSON).

Step 3

In the tile, click the header to view a sample report.

A window appears for the sample report. Use the side bar in the window to scroll down and review the entire sample report. For some of the client reports, the following data is presented:

  • Applied filters (data filters that were used to build the report).

  • Data metrics and summaries

  • Graphical representation of the data (including line, bar, and pie graphs).

  • Tables that assist you in analyzing the data.

Note


You can use the sample report to plan how you want your report to look.

Step 4

Click X to close the preview.

Step 5

In the tile, click the Generate link to configure parameters to build a report.

The Generate window opens where you can select a format type for the report, apply data filters for your reports, as well as set up schedules for the actual report generation.

Step 6

In the Generate a New Report window, click Let's Do It to get started.

Figure 24. Generate a New Report

The Select Report Template window opens.

Step 7

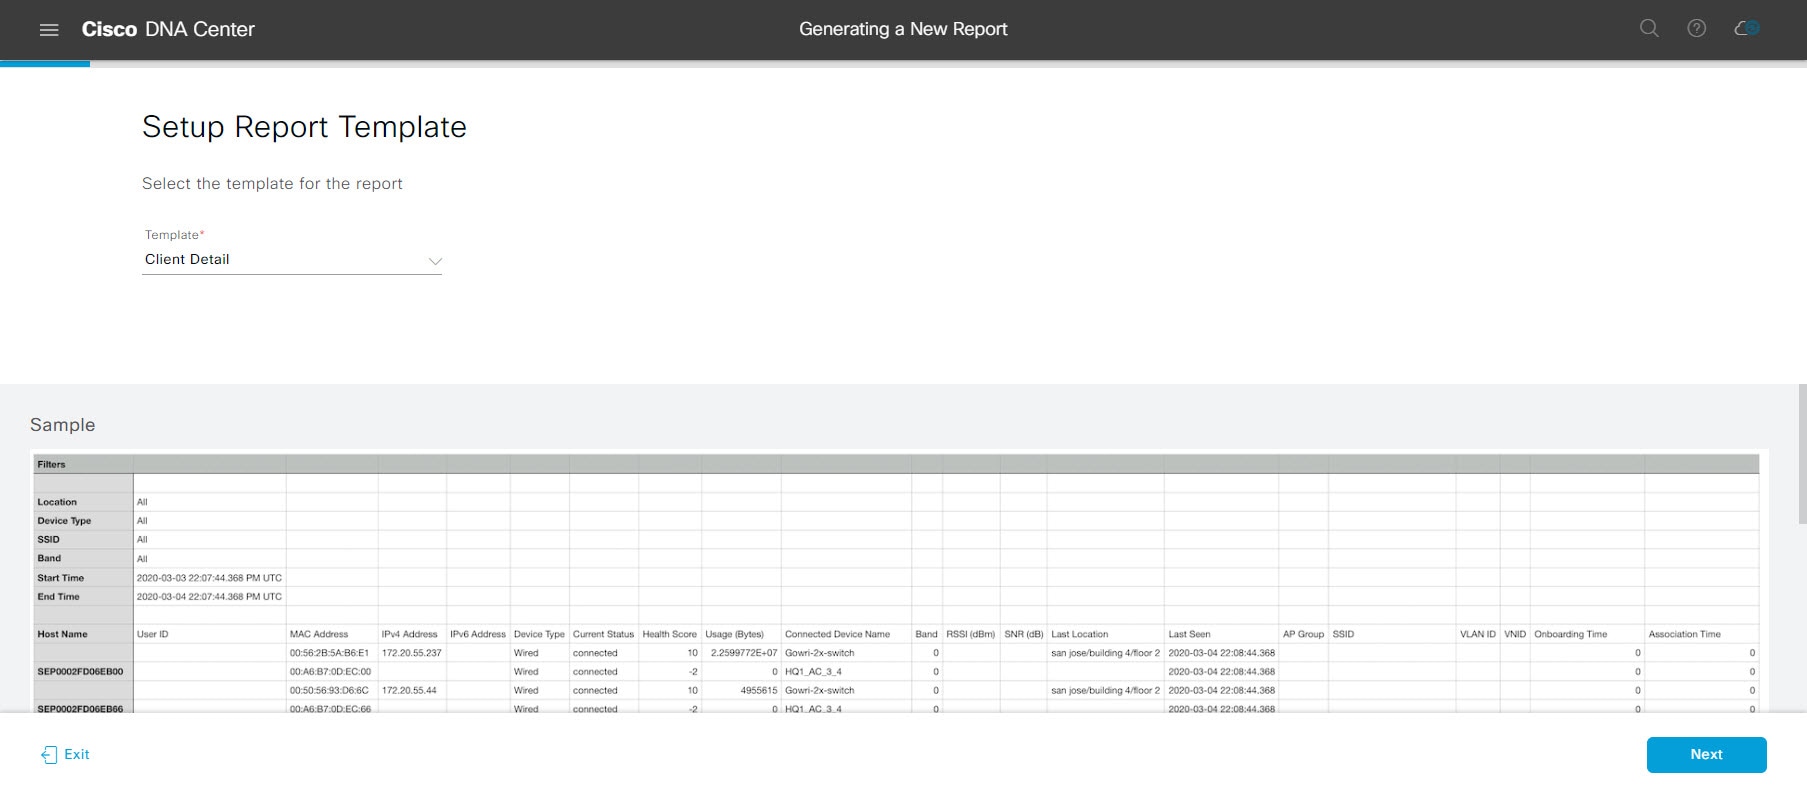
In the Select Report Template window, select the template for the report.

Choose the Template from the drop-down lists.

Note


The Template consists of the individual report types within the categories for the release.

You can review an autogenerated sample in the same window.

Figure 25. Setup Report Template

Click Next. The Setup Report Scope window opens.

Step 8

In the Setup Report Scope window, name the report and select the scope.

Enter a report name in the Report Name field and click in the Scope field to display the available filter. Click the filter options that you want for the report.

Note


The Setup Report Scope options change depending upon the selected Template.

Figure 26. Setup Report Scope

Click Next. The Select File Type window opens.

Step 9

In the Select File Type window, select the file type for the report.

Depending upon the report that you are creating, the following File Type options may be available:

  • PDF

  • CSV

  • Tableau Data Extract

  • JSON

For the CSV, JSON, and Tableau Data Extract file types, a Fields option displays that permits you to select attributes (additional fields) for the CSV, JSON, and Tableau Data Extract results.

Figure 27. Select File Type

Click Next. The Schedule Report window opens.

Step 10

In the Schedule Report window, select the time range and schedule for the report.

The following Time Range options are available:

  • Last 3 hours

  • Last 24 hours

  • Last 7 days

  • Custom

    Note


    Clicking Custom opens up fields where you can choose the date and time interval per the specific report type, as well as the time zone (GMT) for the time range.

The following Schedule options are available:

  • Run Now

  • Run Later

  • Run Recurring

You can also select a time zone for the report when configuring with the following Schedule options:

  • Custom

  • Run Later (One Time)

  • Run Recurring

Figure 28. Schedule Report

Click Next. The Delivery and Notification window opens.

Step 11

In the Delivery and Notification window, select the Delivery mechanism for the report.

The options include:

  • Email Report: Email report is sent as a link or attachment.

    Note


    If you have not yet configured an SMTP server for the emails, you will be prompted to configure one. Follow the prompts to the Email tab in the GUI to configure a SMTP server. Click System > Settings > External Services > Destinations > Email tab.

    • Link: The email notification of a successfully compiled report has a link back to itself and the Generated Reports page under Reports. You can view and download the report from this link and location.

      Note


      Email notifications with embedded links to reports support up to 20 email addresses. To add multiple email addresses, you need to add each email address separately and press Enter (on your keyboard) after each addition. Cisco DNA Center platform validates the email addresses and notifies you if the syntax is incorrect.

    • Attachment: Report is attached to the email notification.

      Note


      PDF reports support email notification attachments of up to 20-MB in size and up to 10 email addresses. To add multiple email addresses, you need to add each email address separately and press Enter (on your keyboard) after each addition. Cisco DNA Center platform validates the email addresses and notifies you if the syntax is incorrect.

    Cisco DNA Center sends the following email notifications for the report:

    • Report is in the queue waiting to be processed.

    • Report processing is in progress.

    • Report has successfully been compiled and is completed.

  • Webhook Notification: Notification is sent as a webhook to the configured webhook URL address (callback URL). Select a webhook from the drop-down list (Subscription Profile field).

    Note


    If you have not yet created a webhook, you will be prompted to create one. Follow the prompts to the Webhook tab in the GUI to configure a webhook. In general, to configure a webhook, click System > Settings > External Services > Destinations > Webhook tab.

    You will receive status webhook notifications for the report. For example, you will receive "In Queue," "In Progress," and "Success" webhook notifications. You will also be able to view these notifications in the GUI.

Figure 29. Delivery and Notification

Click Next. The Summary window opens.

Step 12

In the Summary window, review the configuration and if necessary edit any of the files.

Figure 30. Summary

Click Next.

After the report is generated, a success window appears.

Step 13

Click the View the Generated Reports link.

The Generated Reports window opens with instance details of the report that was scheduled.

Figure 31. Generated Reports

What to do next

Review your report instance in Generated Reports window.


Note


You can download, review, edit, duplicate, or delete the report in the Generated Reports window. For additional information, see View Generated Reports.


Run an Executive Summary Report

Perform this procedure to configure Executive Summary reports for your network. You can configure Executive Summary reports using the Reports window in the Cisco DNA Center GUI.

Figure 32. Executive Summary Reports

Before you begin

Run a successful Discovery job in Cisco DNA Center. You can check whether a Discovery job is successful in Device Inventory. Click the menu icon () and choose Provision > Inventory to view the results.

Procedure


Step 1

Click the menu icon () and choose Reports > Report Templates.

The Report Templates window opens and displays the supported reporting categories. A link represents each category. Click a link to view only the supported reports for that category.

For this release, reporting is supported for the following categories:

  • Access Point: Reports that provide data about Access Points and Access Point Radios.

  • Client: Reports that help with analyzing how the clients are performing in the network.

  • Executive Summary: Report that helps with analyzing how devices, applications, and clients are performing in the network.

  • Inventory: Report listing devices discovered by Cisco DNA Center.

    If the individual counts for devices (wireless or wired clients, routers, switches, APs, and so on) exceed 200,000, the count is an estimated count.

  • Licensing: Reports that lists devices that noncompliant devices and the reasons for noncompliance.

  • Network Devices: Reports that provide data about the devices within your network.

  • Rogue and aWIPS: Reports that provide data about threats within your network.

  • SWIM: Report listing all the devices in network with software and versioning.

  • Security Advisories: Report that provides Cisco security advisory information on the network devices.

Note


The Access Point, Client, and Executive Summary reports support up to 90 days of data retention.

Step 2

After clicking a link, review the Report Templates window for that selected category.

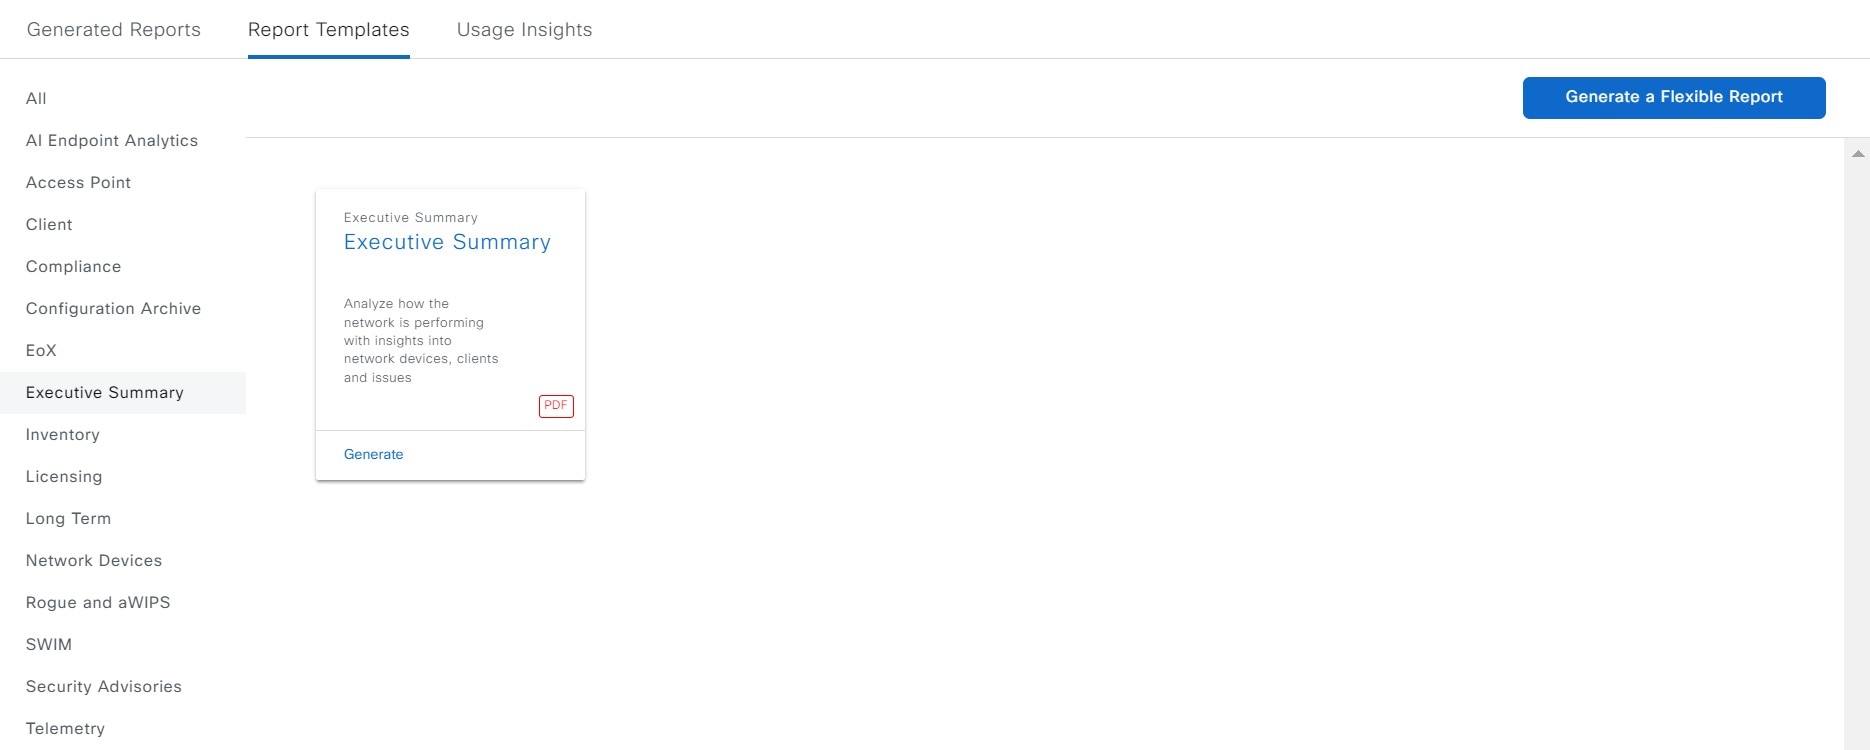
Figure 33. Report Templates Window

The Report Templates window displays supported report templates. Each template is represented by a tile and contains information about the report and links to configure (generate) a report. Determine which template you wish to use to generate a report. For example, for an Executive Summary report you can create an Executive Summary report. Within the tile are also icons that represent the supported file types for the reports (PDF).

Step 3

In the tile, click the header to view a sample report.

A window appears for the sample report. Use the side bar in the window to scroll down and review the entire sample report. The following data is presented:

  • Data metrics and summaries

  • Graphical representation of the data (including line, bar, and pie graphs).

  • Tables that assist you in analyzing the data.

Note


You can use the sample report to plan how you want your report to look.

Step 4

Click X to close the preview.

Step 5

In the tile, click the Generate link to configure parameters to build a report.

The Generate window opens where you can select a format type for the report, apply data filters for your reports, as well as set up schedules for the actual report generation.

Step 6

In the Generate a New Report window, click Let's Do It to get started.

Figure 34. Generate a New Report

The Select Report Template window opens.

Step 7

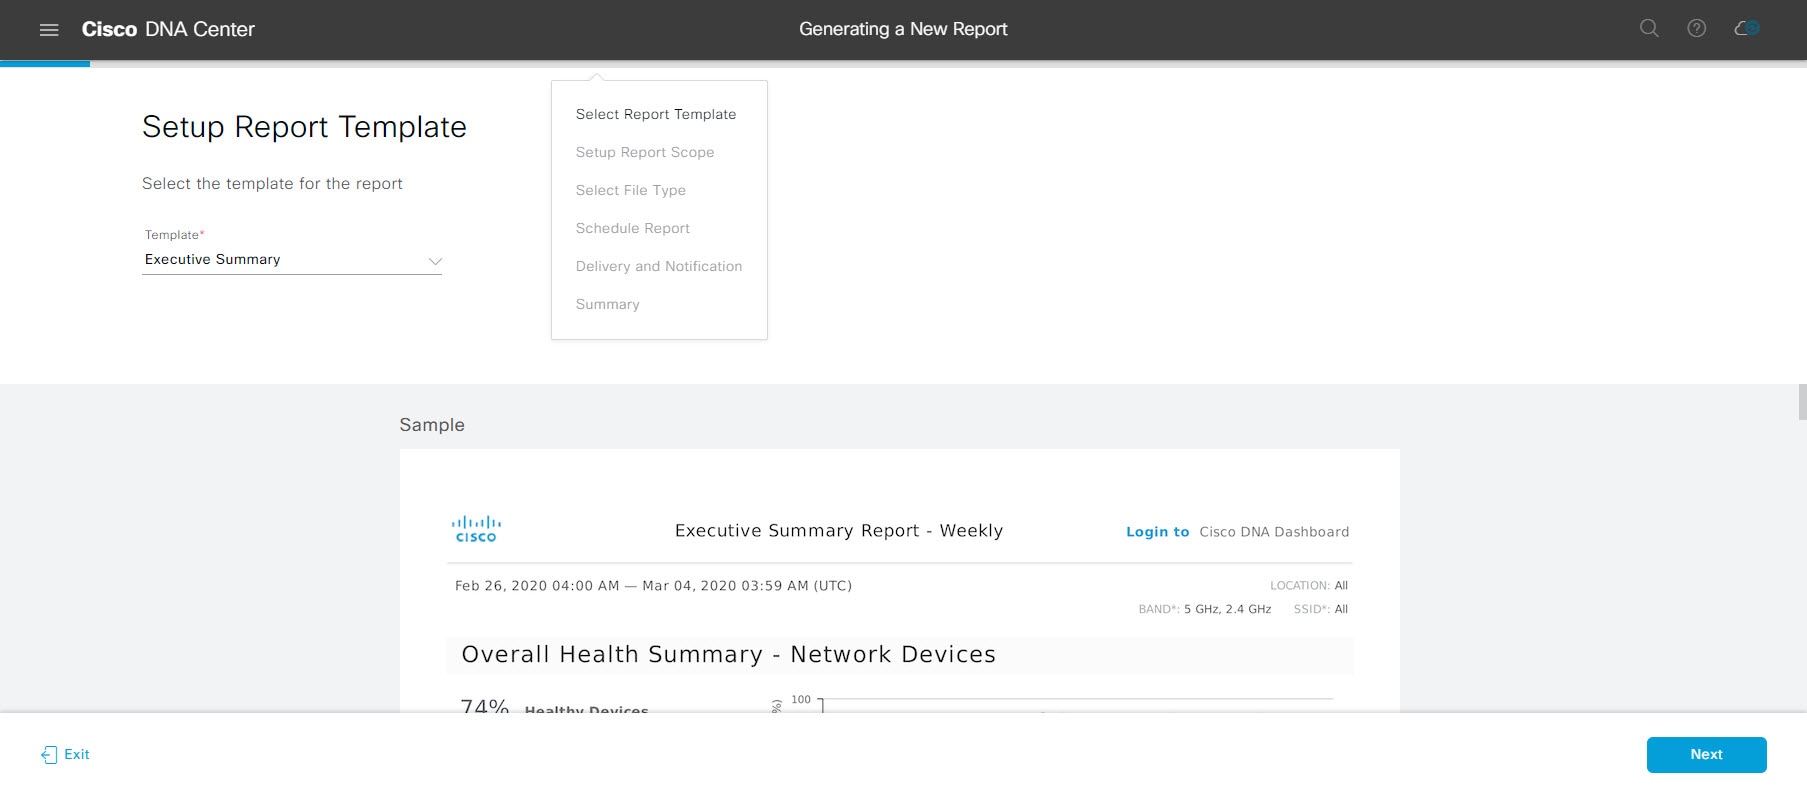
In the Select Report Template window, select the template for the report.

Choose the Template from the drop-down lists.

Note


The Template consists of the individual report types within the categories for the release.

You can review an autogenerated sample in the same window.

Figure 35. Setup Report Template

Click Next. The Setup Report Scope window opens.

Step 8

In the Setup Report Scope window, name the report and select the scope.

Enter a report name in the Report Name field and click in the Scope field to display the available filter. Click the filter options that you want for the report.

Note


The Setup Report Scope options change depending upon the selected Template.

Figure 36. Setup Report Scope

Click Next. The Select File Type window opens.

Step 9

In the Select File Type window, select the file type for the report.

Depending on the report that you are creating, the following File Type options may be available:

  • PDF

  • CSV

  • Tableau Data Extract

  • JSON

For the CSV, JSON, and Tableau Data Extract file types, a Fields option displays that permits you to select attributes (additional fields) for the CSV, JSON, and Tableau Data Extract results.

Figure 37. Select File Type

Click Next. The Schedule Report window opens.

Step 10

In the Schedule Report window, select the time range and schedule for the report.

The following Time Range options are available:

  • Last 3 hours

  • Last 24 hours

  • Last 7 days

  • Custom

    Note


    Clicking Custom opens up fields where you can choose the date and time interval per the specific report type, as well as the time zone (GMT) for the time range.

The following Schedule options are available:

  • Run Now

  • Run Later

  • Run Recurring

You can also select a time zone for the report when configuring with the following Schedule options:

  • Custom

  • Run Later (One Time)

  • Run Recurring

Figure 38. Schedule Report

Click Next. The Delivery and Notification window opens.

Step 11

In the Delivery and Notification window, select the Delivery mechanism for the report.

The options include:

  • Email Report: Email report is sent as a link or attachment.

    Note


    If you have not yet configured an SMTP server for the emails, you will be prompted to configure one. Follow the prompts to the Email tab in the GUI to configure a SMTP server. Click System > Settings > External Services > Destinations > Email.

    • Link: The email notification of a successfully compiled report has a link back to itself and the Generated Reports page under Reports. You can view and download the report from this link and location.

      Note


      Email notifications with embedded links to reports support up to 20 email addresses. To add multiple email addresses, you need to add each email address separately and press Enter (on your keyboard) after each addition. Cisco DNA Center platform validates the email addresses and notifies you if the syntax is incorrect.

    • Attachment: Report is attached to the email notification.

      Note


      PDF reports support email notification attachments of up to 20-MB in size and up to 10 email addresses. To add multiple email addresses, you need to add each email address separately and press Enter (on your keyboard) after each addition. Cisco DNA Center platform validates the email addresses and notifies you if the syntax is incorrect.

    Cisco DNA Center sends the following email notifications for the report:

    • Report is in the queue waiting to be processed.

    • Report processing is in progress.

    • Report has successfully been compiled and is completed.

  • Webhook Notification: Notification is sent as a webhook to the configured webhook URL address (callback URL). Select a webhook from the drop-down list (Subscription Profile field).

    Note


    If you have not yet created a webhook, you will be prompted to create one. Follow the prompts to the Webhook tab in the GUI to configure a webhook. In general, to configure a webhook, click System > Settings > External Services > Destinations > Webhook tab.

    You will receive status webhook notifications for the report. For example, you will receive "In Queue," "In Progress," and "Success" webhook notifications. You will also be able to view these notifications in the GUI.

Figure 39. Delivery and Notification

Click Next. The Summary window opens.

Step 12

In the Summary window, review the configuration and if necessary edit any of the files.

Figure 40. Summary

Click Next.

After the report is generated, a success window appears.

Step 13

Click the View the Generated Reports link.

The Generated Reports window opens with instance details of the report that was scheduled.

Figure 41. Generated Reports

What to do next

Review your report instance in Generated Reports window.


Note


You can download, review, edit, duplicate, or delete the report in the Generated Reports window. For additional information, see View Generated Reports.


Run an Inventory Report

Perform this procedure to configure Inventory reports for your network. You can configure Inventory reports using the Reports window in the Cisco DNA Center GUI.

Figure 42. Inventory Reports

Before you begin

Run a successful Discovery job in Cisco DNA Center. You can check whether a Discovery job is successful in Device Inventory. Click the menu icon () and choose Provision > Inventory to view the results.

Procedure


Step 1

Click the menu icon () and choose Reports > Report Templates.

The Report Templates window opens and displays the supported reporting categories. A link represents each category. Click a link to view only the supported reports for that category.

For this release, reporting is supported for the following categories:

  • Access Point: Reports that provide data about Access Points and Access Point Radios.

  • Client: Reports that help with analyzing how the clients are performing in the network.

  • Executive Summary: Report that helps with analyzing how devices, applications, and clients are performing in the network.

  • Inventory: Report listing devices discovered by Cisco DNA Center.

  • Licensing: Reports that lists devices that noncompliant devices and the reasons for noncompliance.

  • Network Devices: Reports that provide data about the devices within your network.

  • Rogue and aWIPS: Reports that provide data about threats within your network.

  • SWIM: Report listing all the devices in network with software and versioning.

  • Security Advisories: Report that provides Cisco security advisory information on the network devices.

Note


The Access Point, Client, and Executive Summary reports support up to 90 days of data retention.

Step 2

After clicking a link, review the Report Templates window for that selected category.

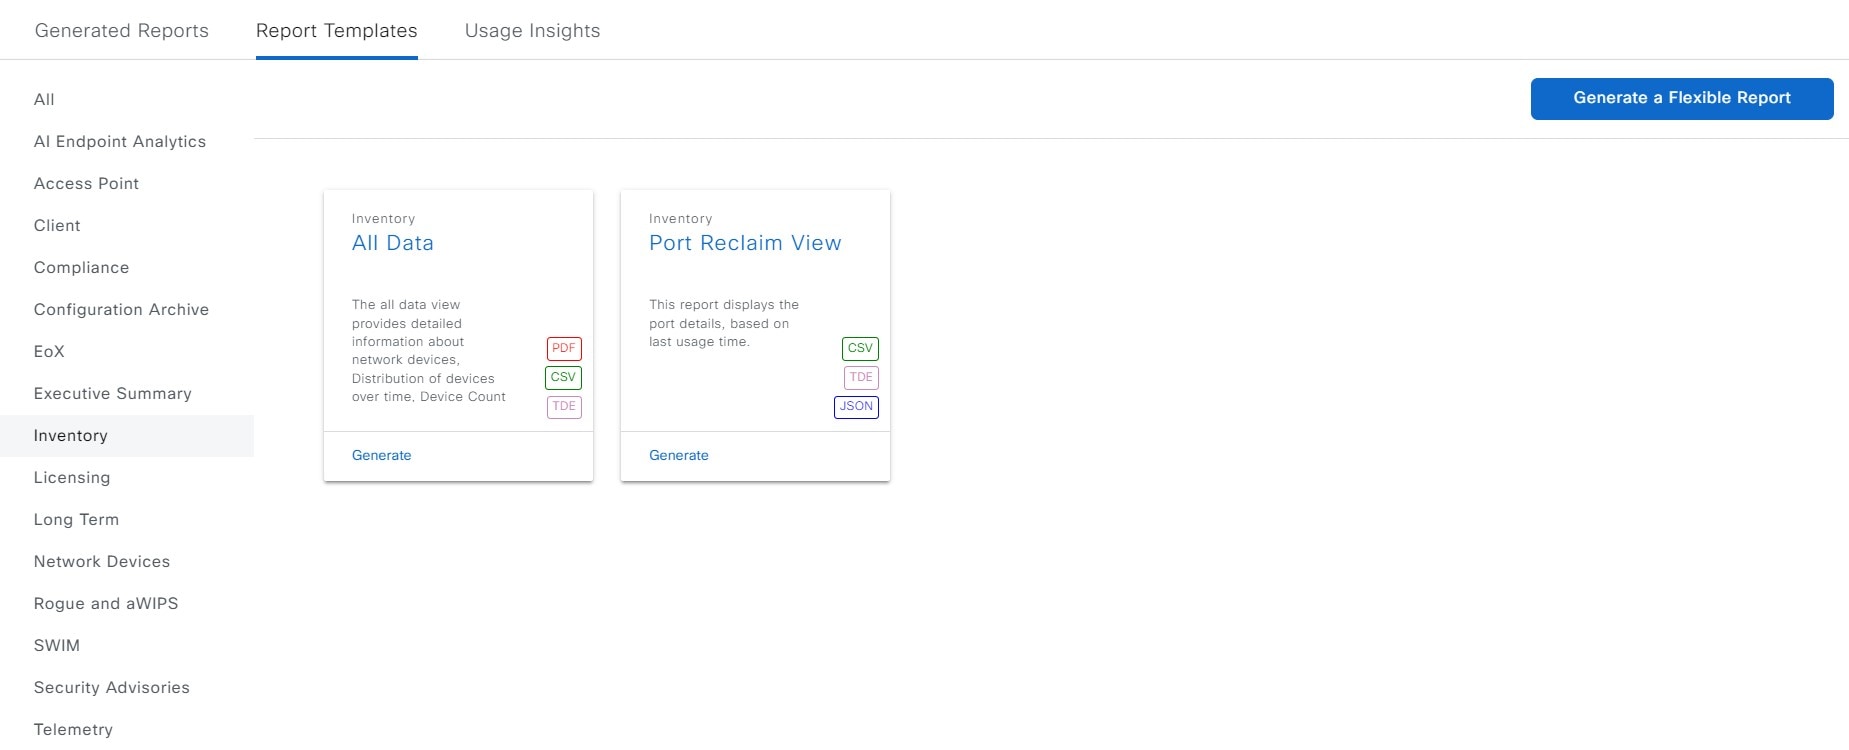
Figure 43. Report Templates Window

The Report Templates window displays supported report templates. Each template is represented by a tile and contains information about the report and links to configure (generate) a report. Determine which template you wish to use to generate a report. For example, for an Inventory report you can create an All Data report. Within the tile are also icons that represent the supported file types for the reports (PDF, CSV, or TDE).

Step 3

In the tile, click the header to view a sample report.

A window appears for the sample report. Use the side bar in the window to scroll down and review the entire sample report. The following data is presented:

  • Applied filters (data filters that were used to build the report).

  • Data metrics and summaries

  • Graphical representation of the data (including line, bar, and pie graphs).

  • Tables that assist you in analyzing the data.

Note


You can use the sample report to plan how you want your report to look.

Step 4

Click X to close the preview.

Step 5

In the tile, click the Generate link to configure parameters to build a report.

The Generate window opens where you can select a format type for the report, apply data filters for your reports, as well as set up schedules for the actual report generation.

Step 6

In the Generate a New Report window, click Let's Do It to get started.

Figure 44. Generate a New Report

The Select Report Template window opens.

Step 7

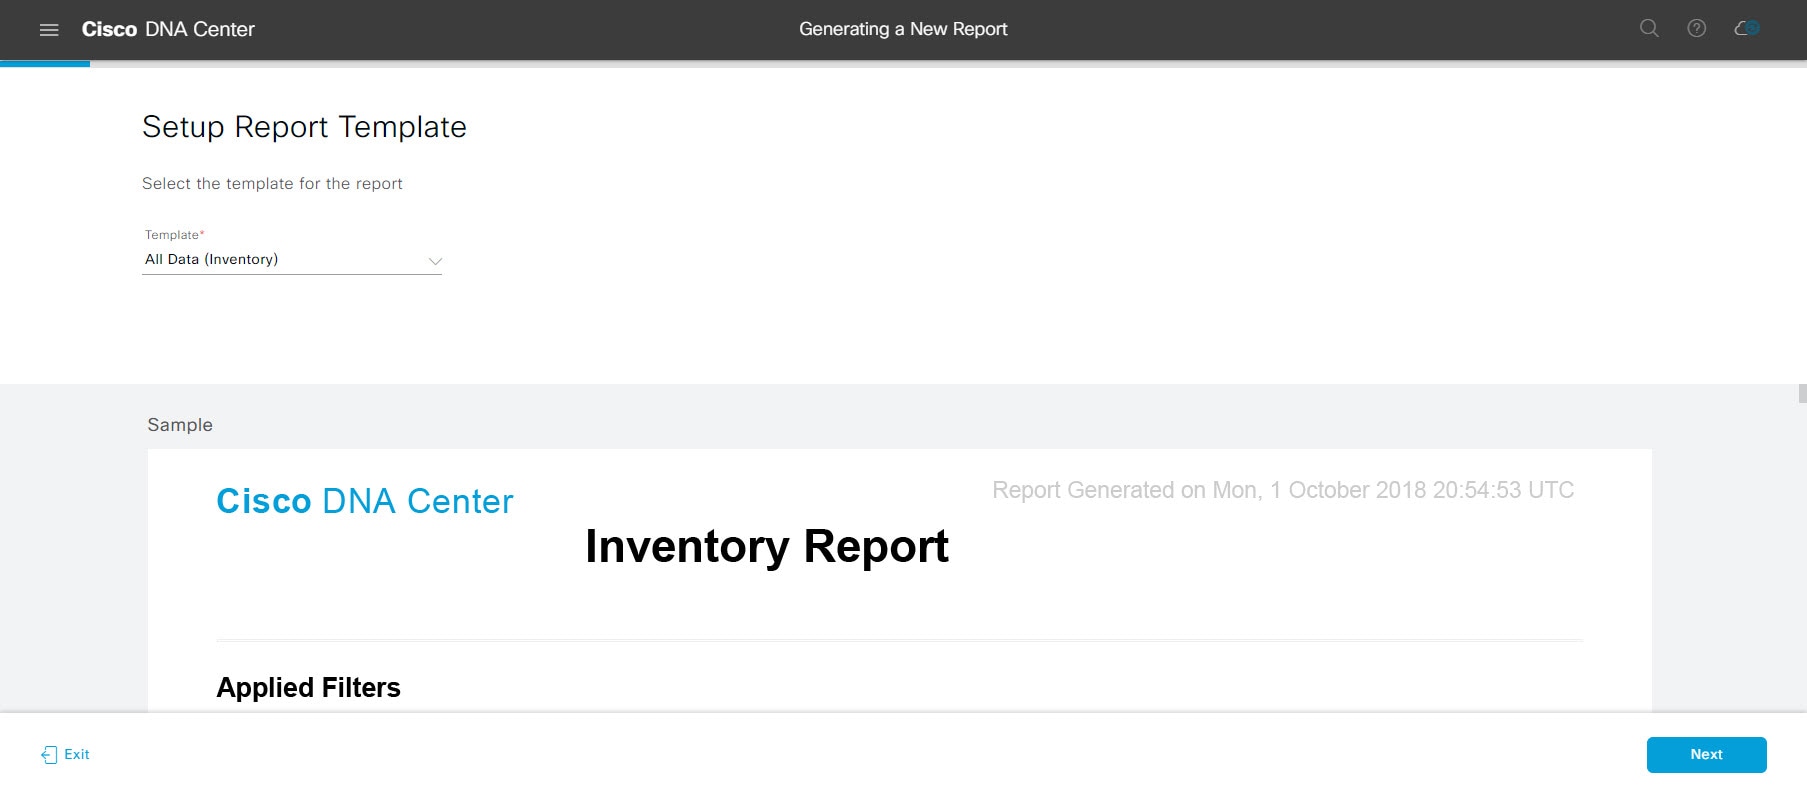
In the Select Report Template window, select the template for the report.

Choose the Template from the drop-down lists.

Note


The Template consists of the individual report types within the categories for the release.

You can review an autogenerated sample in the same window.

Figure 45. Setup Report Template

Click Next. The Setup Report Scope window opens.

Step 8

In the Setup Report Scope window, name the report and select the scope.

Enter a report name in the Report Name field and click in the Scope field to display the available filter. Click the filter options that you want for the report.

Note


The Setup Report Scope options change depending upon the selected Template.

Figure 46. Setup Report Scope

Click Next. The Select File Type window opens.

Step 9

In the Select File Type window, select the file type for the report.

Depending on the report that you are creating, the following File Type options may be available:

  • PDF

  • CSV

  • Tableau Data Extract

  • JSON

For the CSV, JSON, and Tableau Data Extract file types, a Fields option displays that permits you to select attributes (additional fields) for the CSV, JSON, and Tableau Data Extract results.

Figure 47. Select File Type

Click Next. The Schedule Report window opens.

Step 10

In the Schedule Report window, select the time range and schedule for the report.

The following Time Range options are available:

  • Last 3 hours

  • Last 24 hours

  • Last 7 days

  • Custom

    Note


    Clicking Custom opens up fields where you can choose the date and time interval per the specific report type, as well as the time zone (GMT) for the time range.

The following Schedule options are available:

  • Run Now

  • Run Later

  • Run Recurring

You can also select a time zone for the report when configuring with the following Schedule options:

  • Custom

  • Run Later (One Time)

  • Run Recurring

Figure 48. Schedule Report

Click Next. The Delivery and Notification window opens.

Step 11

In the Delivery and Notification window, select the Delivery mechanism for the report.

The options include:

  • Email Report: Email report is sent as a link or attachment.

    Note


    If you have not yet configured an SMTP server for the emails, you will be prompted to configure one. Follow the prompts to the Email tab in the GUI to configure a SMTP server. Click System > Settings > External Services > Destinations > Email.

    • Link: The email notification of a successfully compiled report has a link back to itself and the Generated Reports page under Reports. You can view and download the report from this link and location.

      Note


      Email notifications with embedded links to reports support up to 20 email addresses. To add multiple email addresses, you need to add each email address separately and press Enter (on your keyboard) after each addition. Cisco DNA Center platform validates the email addresses and notifies you if the syntax is incorrect.

    • Attachment: Report is attached to the email notification.

      Note


      PDF reports support email notification attachments of up to 20-MB in size and up to 10 email addresses. To add multiple email addresses, you need to add each email address separately and press Enter (on your keyboard) after each addition. Cisco DNA Center platform validates the email addresses and notifies you if the syntax is incorrect.

    Cisco DNA Center sends the following email notifications for the report:

    • Report is in the queue waiting to be processed.

    • Report processing is in progress.

    • Report has successfully been compiled and is completed.

  • Webhook Notification: Notification is sent as a webhook to the configured webhook URL address (callback URL). Select a webhook from the drop-down list (Subscription Profile field).

    Note


    If you have not yet created a webhook, you will be prompted to create one. Follow the prompts to the Webhook tab in the GUI to configure a webhook. In general, to configure a webhook, click System > Settings > External Services > Destinations > Webhook tab.

    You will receive status webhook notifications for the report. For example, you will receive "In Queue," "In Progress," and "Success" webhook notifications. You will also be able to view these notifications in the GUI.

Figure 49. Delivery and Notification

Click Next. The Summary window opens.

Step 12

In the Summary window, review the configuration and if necessary edit any of the files.

Figure 50. Summary

Click Next.

After the report is generated, a success window appears.

Step 13

Click the View the Generated Reports link.

The Generated Reports window opens with instance details of the report that was scheduled.

Figure 51. Generated Reports

What to do next

Review your report instance in Generated Reports window.


Note


You can download, review, edit, duplicate, or delete the report in the Generated Reports window. For additional information, see View Generated Reports.


Run a Licensing Report

Perform this procedure to configure Licensing reports about your network. You can configure Licensing reports using the Reports window in the Cisco DNA Center GUI.

Figure 52. Licensing Reports

Before you begin

Run a successful Discovery job in Cisco DNA Center. You can check whether a Discovery job is successful in Device Inventory. Click the menu icon () and choose Provision > Inventory to view the results.

Procedure


Step 1

Click the menu icon () and choose Reports > Report Templates.

The Report Templates window opens and displays the supported reporting categories. A link represents each category. Click a link to view only the supported reports for that category.

For this release, reporting is supported for the following categories:

  • Access Point: Reports that provide data about Access Points and Access Point Radios.

  • Client: Reports that help with analyzing how the clients are performing in the network.

  • Executive Summary: Report that helps with analyzing how devices, applications, and clients are performing in the network.

  • Inventory: Report listing devices discovered by Cisco DNA Center.

  • Licensing: Reports that lists devices that noncompliant devices and the reasons for noncompliance.

  • Network Devices: Reports that provide data about the devices within your network.

  • Rogue and aWIPS: Reports that provide data about threats within your network.

  • SWIM: Report listing all the devices in the network, along with their software and versioning.

  • Security Advisories: Report that provides Cisco security advisory information on the network devices.

Note


The Access Point, Client, and Executive Summary reports support up to 90 days of data retention.

Step 2

After clicking a link, review the Report Templates window for that selected category.

Figure 53. Report Templates Window

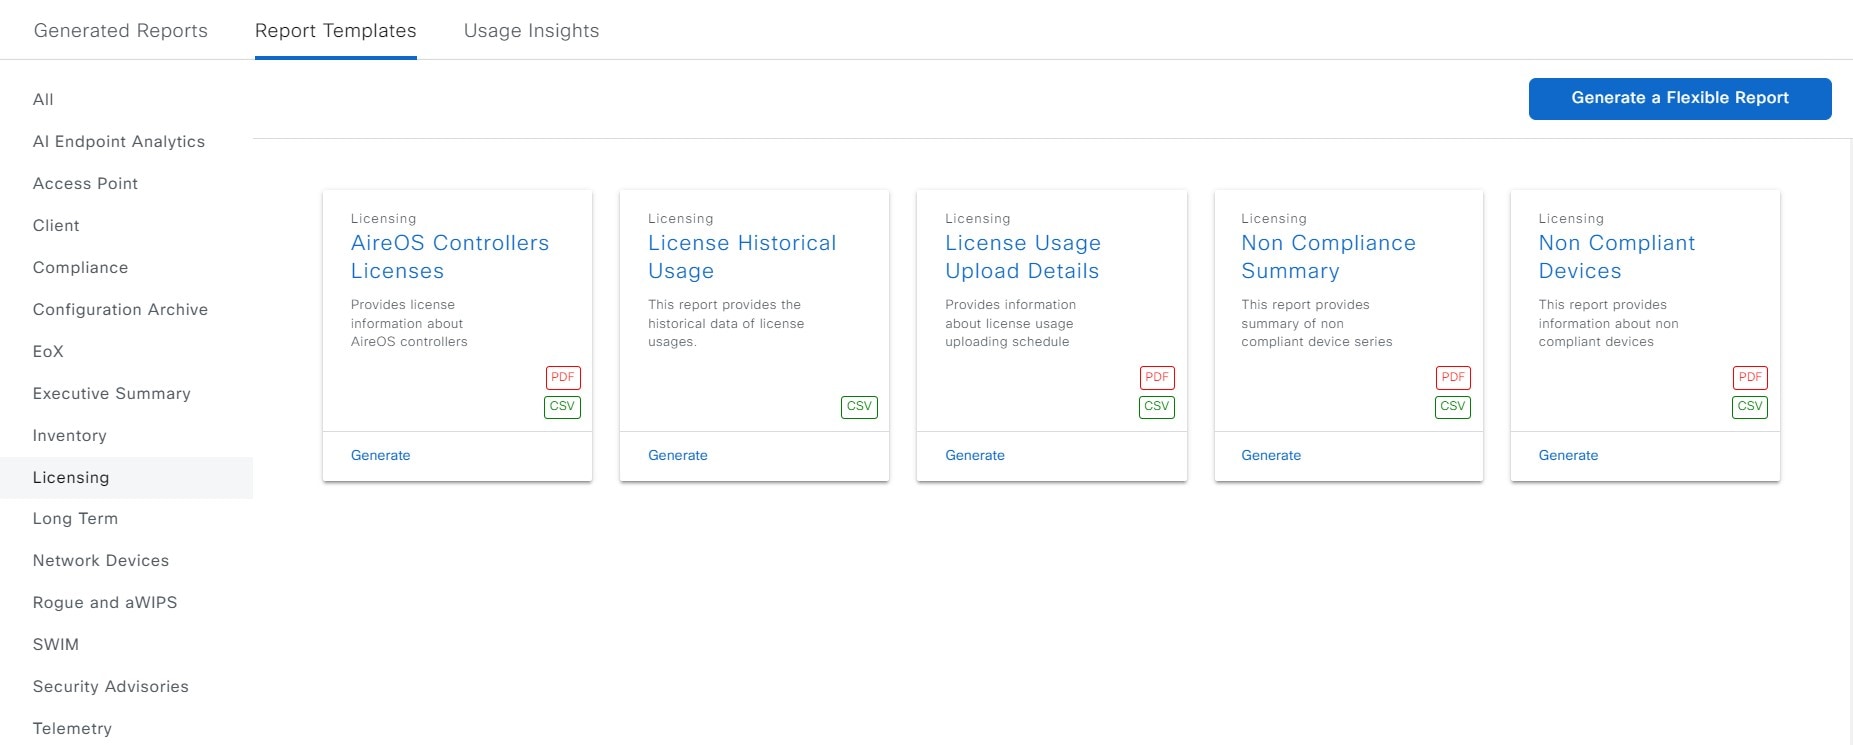
The Report Templates window displays supported report templates. Each template is represented by a tile and contains information about the report and links to configure (generate) a report. Determine which template you wish to use to generate a report. For example, for a Licensing report you can create an AireOS Controllers Licenses report. Within the tile are also icons that represent the supported file types for the reports (PDF or CSV).

Step 3

In the tile, click the header to view a sample report.

A window appears for the sample report. Use the side bar in the window to scroll down and review the entire sample report. The following data is presented:

  • Applied filters (data filters that were used to build the report).

  • Data metrics and summaries

  • Tables that assist you in analyzing the data.

Note


You can use the sample report to plan how you want your report to look.

Step 4

Click X to close the preview.

Step 5

In the tile, click the Generate link to configure parameters to build a report.

The Generate window opens where you can select a format type for the report, apply data filters for your reports, as well as set up schedules for the actual report generation.

Step 6

In the Generate a New Report window, click Let's Do It to get started.

Figure 54. Generate a New Report

The Select Report Template window opens.

Step 7

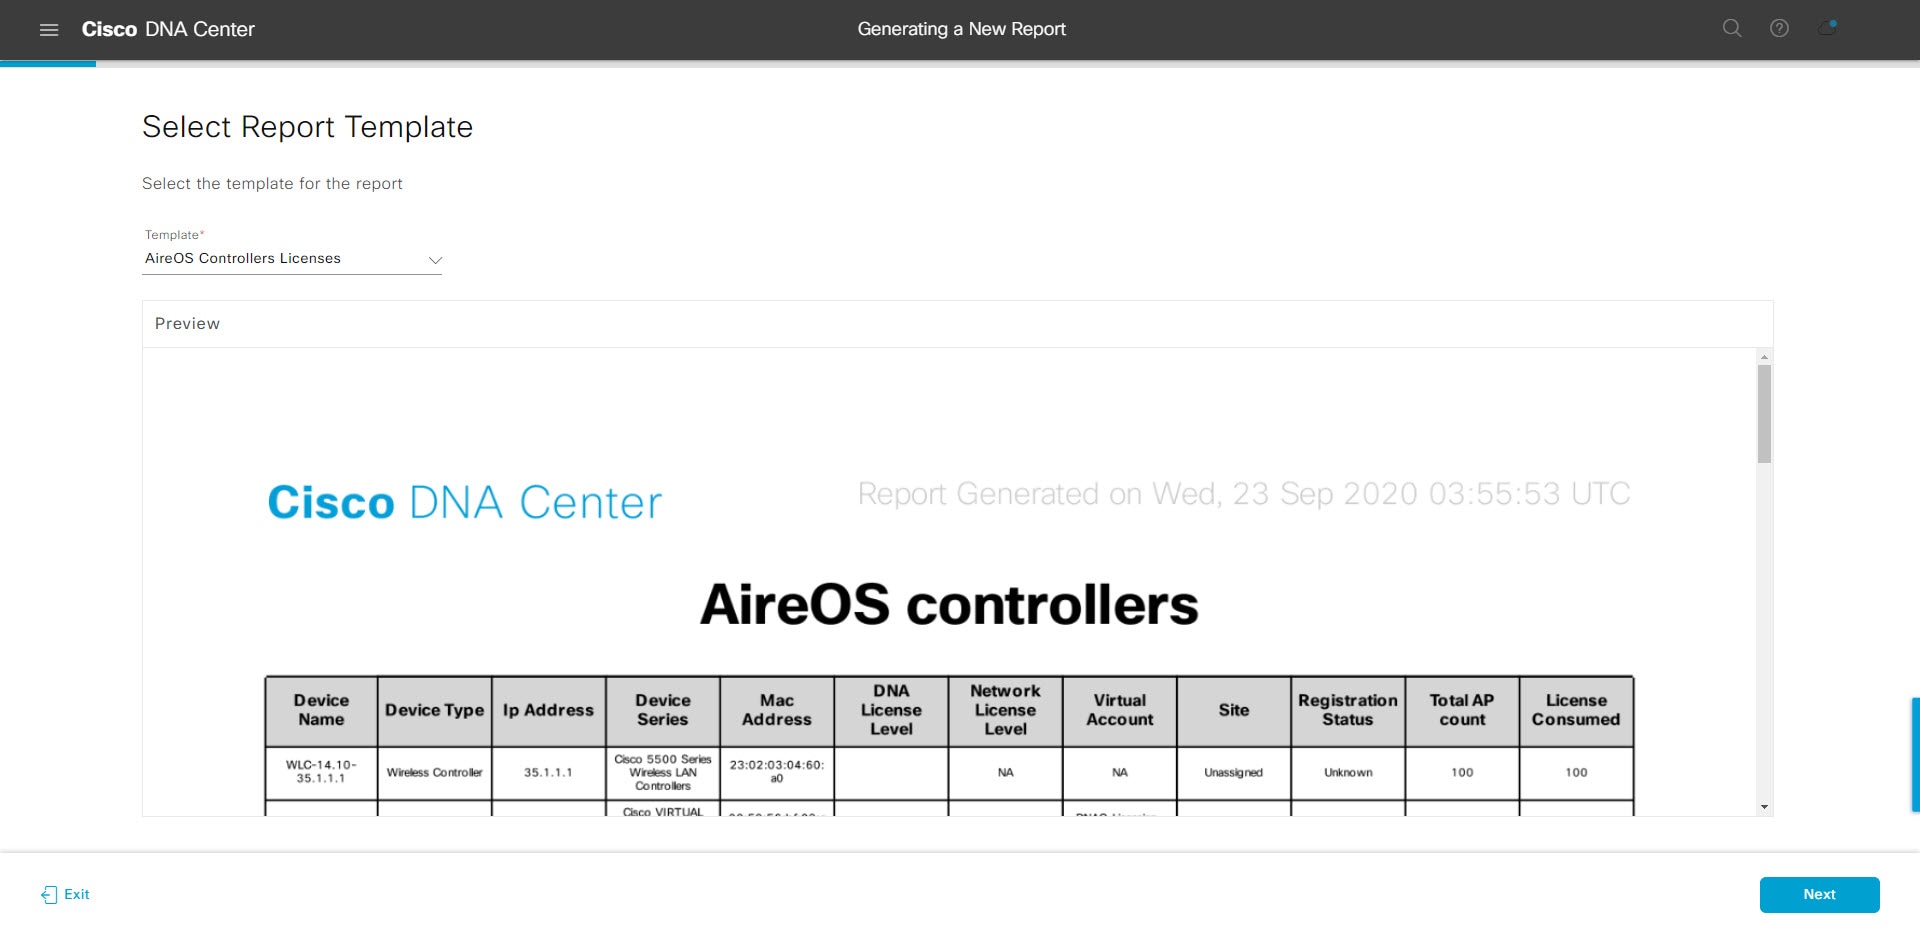
In the Select Report Template window, select the template for the report.

Choose the Template from the drop-down lists.

Note


The Template consists of the individual report types within the categories for the release.

You can review an autogenerated sample in the same window.

Figure 55. Select Report Template

Click Next. The Setup Report Scope window opens.

Step 8

In the Setup Report Scope window, name the report and select the scope.

In the Report Name field, enter a report name and click inside the Scope field to display the available filter. Click the filter options that you want for the report.

Note


The Setup Report Scope options change depending upon the selected Template.

Figure 56. Setup Report Scope

Click Next. The Select File Type window opens.

Step 9

In the Select File Type window, select the file type for the report.

Depending on the report that you are creating, the following File Type options may be available:

  • PDF

  • CSV

  • Tableau Data Extract

  • JSON

For the CSV, JSON, and Tableau Data Extract file types, a Fields option displays that permits you to select attributes (additional fields) for the CSV, JSON, and Tableau Data Extract results.

Figure 57. Select File Type

Click Next. The Schedule Report window opens.

Step 10

In the Schedule Report window, select the time range and schedule for the report.

The following Time Range options are available:

  • Last 3 hours

  • Last 24 hours

  • Last 7 days

  • Custom

    Note


    Clicking Custom displays fields where you can choose the date and time interval for a specific report type, and the time zone (GMT) for the time range.

The following Schedule options are available:

  • Run Now

  • Run Later

  • Run Recurring

You can also select a time zone for the report when configuring with the following Schedule options:

  • Custom

  • Run Later (One Time)

  • Run Recurring

Figure 58. Schedule Report

Click Next. The Delivery and Notification window opens.

Step 11

In the Delivery and Notification window, select the delivery mechanism for the report:

  • Email Report: Email report is sent as a link or attachment.

    Note


    If you have not configured an SMTP server for the emails, you are prompted to configure one. Follow the prompts to the Email tab in the GUI to configure an SMTP server. Click System > Settings > External Services > Destinations > Email tab.

    • Link: The email notification of a successfully compiled report has a link to the report and to the Generated Reports page under Reports. You can view and download the report from this location.

      Note


      Email notifications with embedded links to reports support up to 20 email addresses. To add multiple email addresses, you need to add each email address separately and press Enter (on your keyboard) after each addition. Cisco DNA Center platform validates the email addresses and notifies you if the syntax is incorrect.

    • Attachment: Report is attached to the email notification.

      Note


      PDF reports support email notification attachments of up to 20-MB in size and up to 10 email addresses. To add multiple email addresses, you need to add each email address separately and press Enter (on your keyboard) after each addition. Cisco DNA Center platform validates the email addresses and notifies you if the syntax is incorrect.

    Cisco DNA Center sends the following email notifications for the report:

    • Report is in the queue waiting to be processed.

    • Report processing is in progress.

    • Report has successfully been compiled and is completed.

  • Webhook Notification: Notification is sent as a webhook to the configured webhook URL address (callback URL). Select a webhook from the drop-down list (Subscription Profile field).

    Note


    If you have not yet created a webhook, you are prompted to create one. Follow the prompts to the Webhook tab in the GUI to configure a webhook. In general, to configure a webhook, click System > Settings > External Services > Destinations > Webhook.

    You receive status webhook notifications for the report, for example, In Queue, In Progress, and Success. You are also able to view these notifications in the GUI.

Figure 59. Delivery and Notification

Click Next. The Summary window opens.

Step 12

In the Summary window, review the configuration and, if necessary, edit the files.

Figure 60. Summary

Click Next.

After the report is generated, a success window appears.

Step 13

Click the View the Generated Reports link.

The Generated Reports window is displayed with instance details of the report that was scheduled.

Figure 61. Generated Reports

What to do next

Review your report instance in Generated Reports window.


Note


You can download, review, edit, duplicate, or delete the report in the Generated Reports window. For additional information, see View Generated Reports.


Run a Network Devices Report

Perform this procedure to configure Network Devices reports for your network. You can configure Network Devices reports using the Reports window in the Cisco DNA Center GUI.

Figure 62. Network Devices Reports

Before you begin

Run a successful Discovery job in Cisco DNA Center. You can check whether a Discovery job is successful in Device Inventory. Click the menu icon () and choose Provision > Inventory to view the results.

Procedure


Step 1

Click the menu icon () and choose Reports > Report Templates.

The Report Templates window opens and displays the supported reporting categories. Each category is represented by link. Click a link to view only the supported reports for that category.

For this release, reporting is supported for the following categories:

  • Access Point: Reports that provide data about Access Points and Access Point Radios.

  • Client: Reports that help with analyzing how the clients are performing in the network.

  • Executive Summary: Report that helps with analyzing how devices, applications, and clients are performing in the network.

  • Inventory: Report that lists devices discovered by Cisco DNA Center.

  • Licensing: Reports that list noncompliant devices and the reasons for noncompliance.

  • Network Devices: Reports that provide data about the devices in your network.

  • Rogue and aWIPS: Reports that provide data about threats in your network.

  • SWIM: Report that lists the software and version of the devices in your network.

  • Security Advisories: Report that provides Cisco security advisory information on the network devices.

Note


The Access Point, Client, and Executive Summary reports support up to 90 days of data retention.

Step 2

After clicking a link, review the Report Templates window for that selected category.

Figure 63. Network Devices Reports

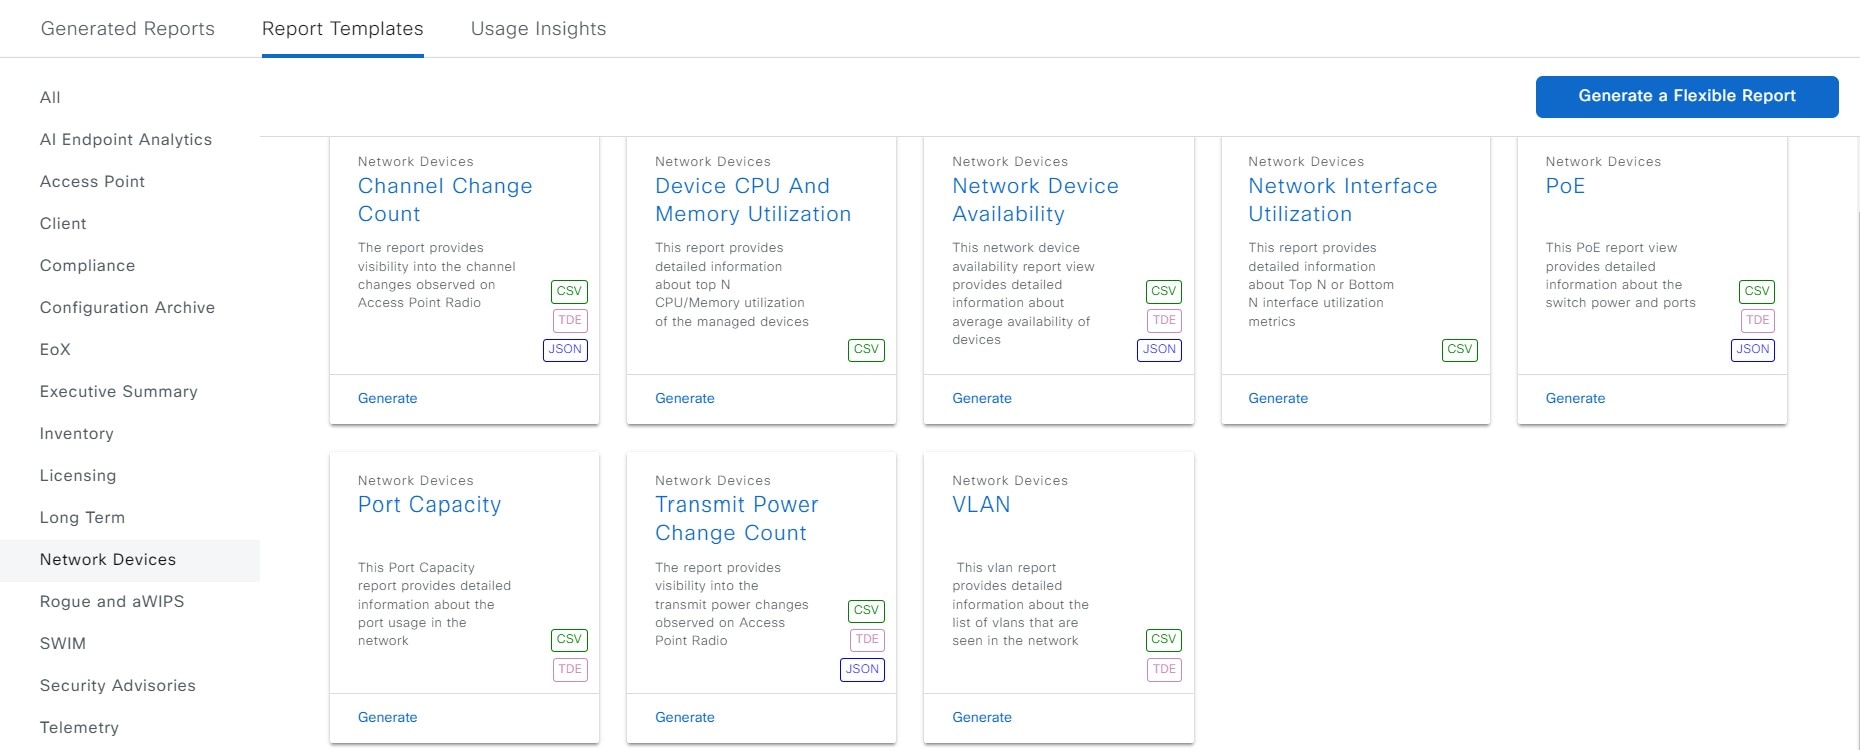
The Report Templates window displays supported report templates. Each template is represented by a tile and contains information about the report and links to configure (generate) a report. Determine which template you wish to use to generate a report. For example, for a Network Devices report you can create a Channel Change Count, Network Device Availability, PoE, Port Capacity, Transmit Power Change Count, or VLAN report. Within the tile are also icons that represent the supported file types for the reports (CSV, TDE, or JSON).

Step 3

In the tile, click the header to view a sample report.

A window appears for the sample report. Use the side bar in the window to scroll down and review the entire sample report. The following data is presented:

  • Applied filters (data filters that were used to build the report).

  • Data metrics and summaries

  • Graphical representation of the data (including line, bar, and pie graphs).

  • Tables that assist you in analyzing the data.

Note


You can use the sample report to plan how you want your report to look.

Step 4

Click X to close the preview.

Step 5

In the tile, click the Generate link to configure parameters to build a report.

The Generate window opens where you can select a format type for the report, apply data filters for your reports, as well as set up schedules for the actual report generation.

Step 6

In the Generate a New Report window, click Let's Do It to get started.

Figure 64. Generate a New Report

The Setup the Report Template window opens.

Step 7

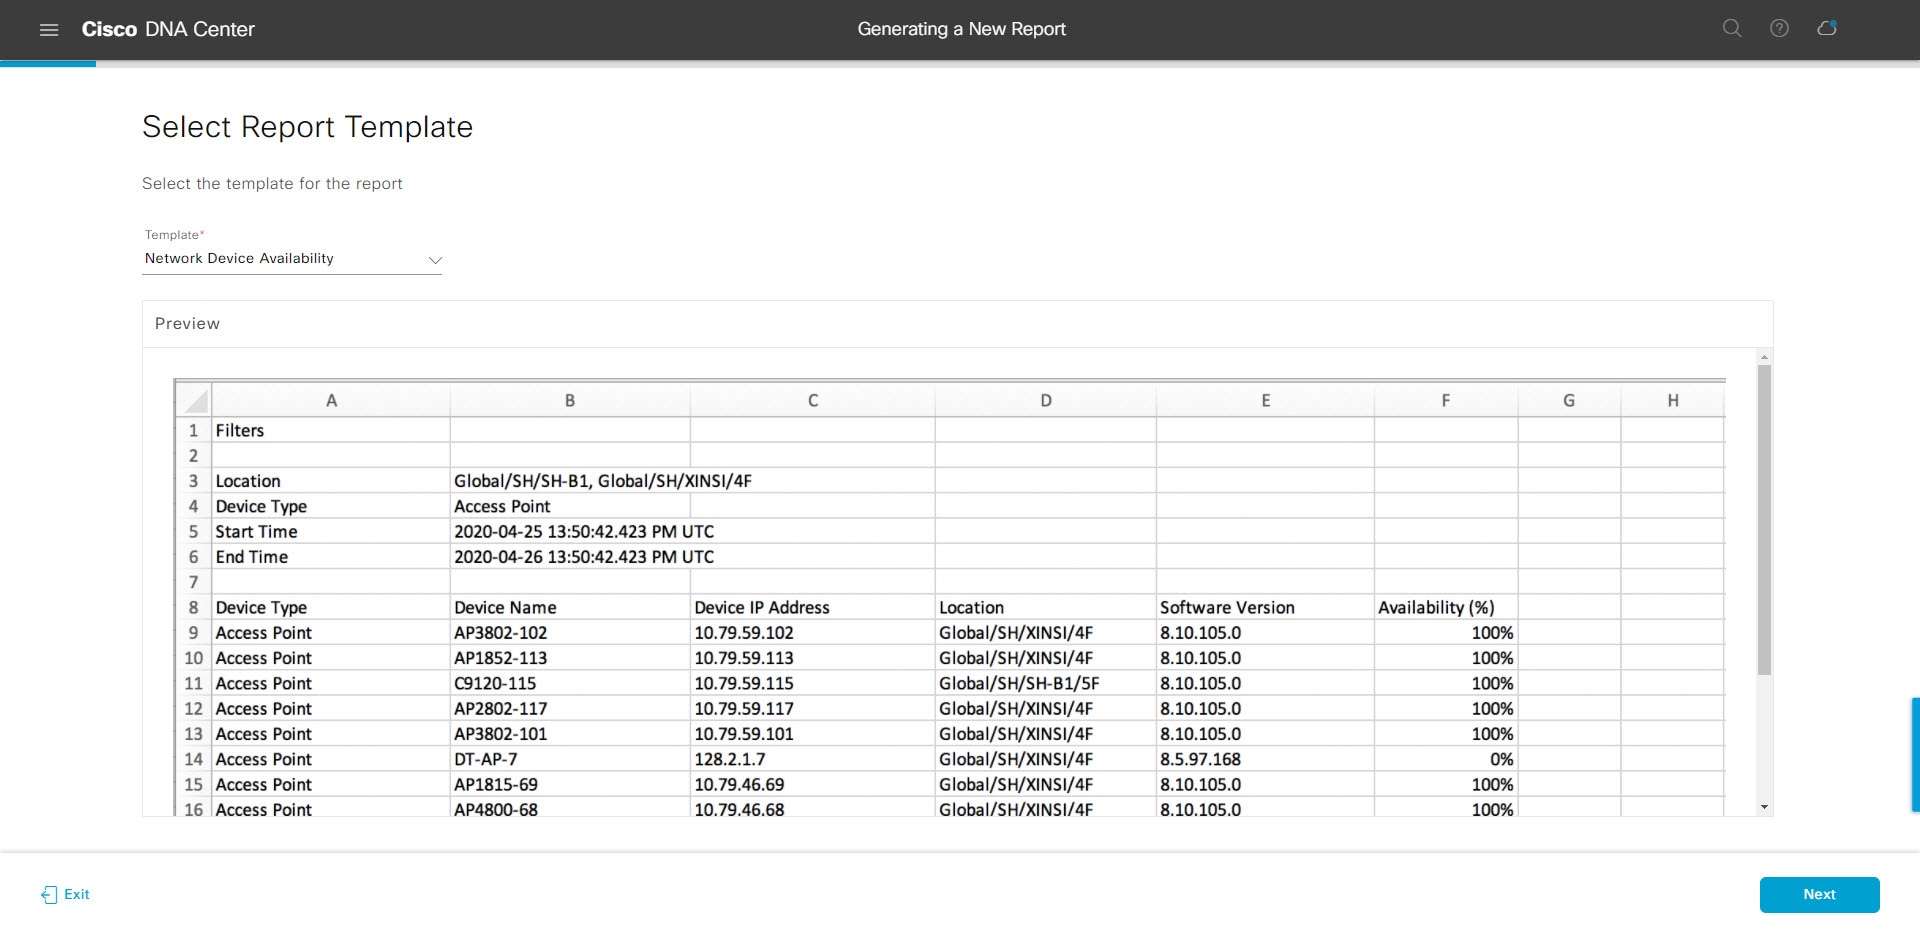
In the Setup the Report Template window, select the template for the report.

Choose the Template from the drop-down menus.

Note


The Template consists of the individual report types within the categories for the release.

You can review an auto-generated sample in the same window.

Figure 65. Setup Report Template

Click Next. The Setup Report Scope window opens.

Step 8

In the Setup Report Scope window, name the report and select the scope.

Enter a report name in the Report Name field and click in the Scope field to display the available filter. Click on the filter options that you want for the report.

Note


The Setup Report Scope options will change depending upon the selected Template.

Figure 66. Setup Report Scope

Click Next. The Select File Type window opens.

Step 9

In the Select File Type window, select the file type for the report.

Depending on the report that you are creating, the following File Type options may be available:

  • PDF

  • CSV

  • Tableau Data Extract

  • JSON

For the CSV, JSON, and Tableau Data Extract file types, a Fields option will display that permits you to select attributes (additional fields) for the CSV, JSON, and Tableau Data Extract results.

Figure 67. Select File Type

Click Next. The Schedule Report window opens.

Step 10

In the Schedule Report window, select the time range and schedule for the report.

The following Time Range options are available:

  • Last 3 hours

  • Last 24 hours

  • Last 7 days

  • Custom

    Note


    Clicking Custom opens up fields where you can choose the date and time interval per the specific report type, as well as the time zone (GMT) for the time range.

The following Schedule options are available:

  • Run Now

  • Run Later

  • Run Recurring

You can also select a timezone for the report when configuring with the following Schedule options:

  • Custom

  • Run Later (One Time)

  • Run Recurring

Figure 68. Schedule Report

Click Next. The Delivery and Notification window opens.

Step 11

In the Delivery and Notification window, select the delivery mechanism for the report.

The options include:

  • Email Report: Email report is sent as a link or attachment.

    Note


    If you have not yet configured a SMTP server for the emails, you will be prompted to configure one. Follow the prompts to the Email tab in the GUI to configure a SMTP server. Click System > Settings > External Services > Destinations > Email.

    • Link: The email notification of a successfully compiled report will have a link back to itself and the Generated Reports page under Reports. You can view and download the report from this link and location.

      Note


      Email notifications with embedded links to reports support up to 20 email addresses. To add multiple email addresses, you need to add each email address separately and press Enter (on your keyboard) after each addition. Cisco DNA Center platform validates the email addresses and notifies you if the syntax is incorrect.

    • Attachment: Report is attached to the email notification.

      Note


      PDF reports support email notification attachments of up to 20-MB in size and up to 10 email addresses. To add multiple email addresses, you need to add each email address separately and press Enter (on your keyboard) after each addition. Cisco DNA Center platform validates the email addresses and notifies you if the syntax is incorrect.

    Cisco DNA Center sends the following email notifications for the report:

    • Report is in the queue waiting to be processed.

    • Report processing is in progress.

    • Report has successfully been compiled and is completed.

  • Webhook Notification: Notification is sent as a webhook to the configured webhook URL address (callback URL). Select a webhook from the drop-down menu (Subscription Profile field).

    Note


    If you have not yet created a webhook, you will be prompted to create one. Follow the prompts to the Webhook tab in the GUI to configure a webhook. In general, to configure a webhook, click System > Settings > External Services > Destinations > Webhook tab.

    You will receive status webhook notifications for the report. For example, you will receive "In Queue," "In Progress," and "Success" webhook notifications. You will also be able to view these notifications in the GUI.

Figure 69. Delivery and Notification

Click Next. The Summary window opens.

Step 12

In the Summary window, review the configuration and if necessary edit any of the files.

Figure 70. Summary

Click Next.

After the report is generated, a success window appears.

Step 13

Click the View the Generated Reports link.

The Generated Reports window opens with instance details of the report that was scheduled.

Figure 71. Generated Reports

What to do next

Review your report instance in Generated Reports window.


Note


You can download, review, edit, duplicate, or delete the report in the Generated Reports window. For additional information, see View Generated Reports.


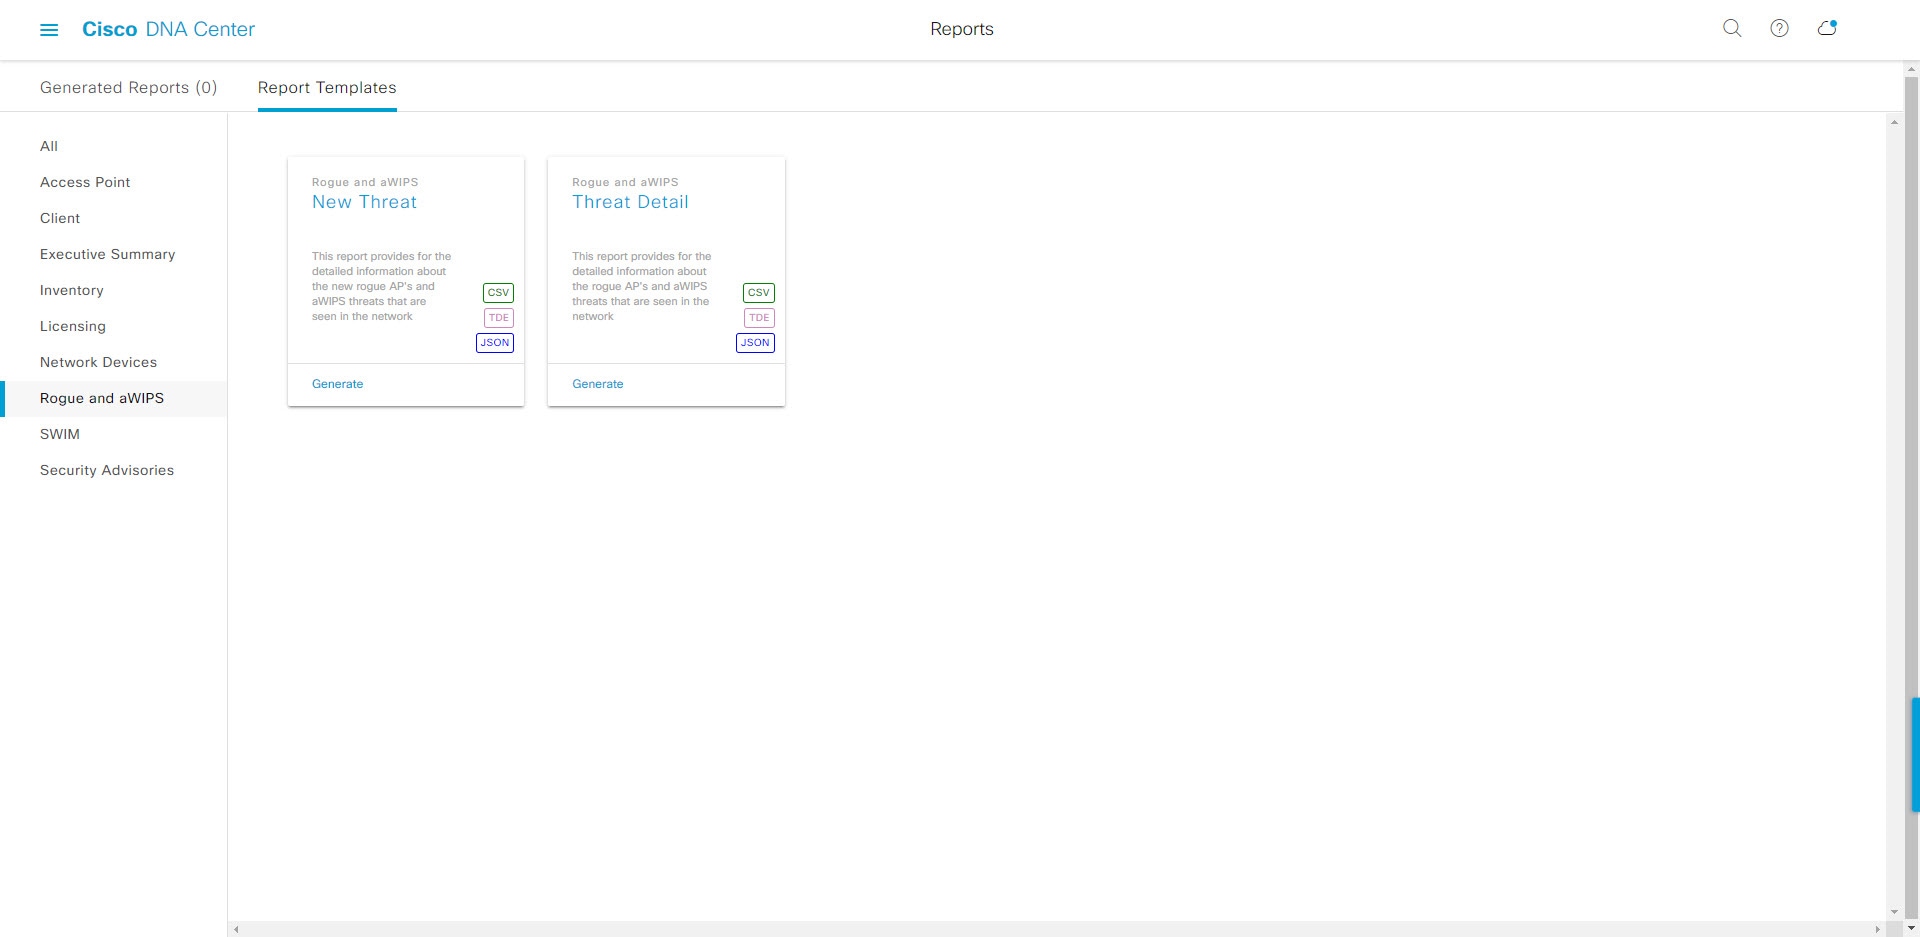
Run a Rogue and aWIPS Report

Perform this procedure to configure Rogue and aWIPs reports for your network. You can configure Rogue and aWIPS reports using the Reports window in the Cisco DNA Center GUI.

Figure 72. Rogue and aWIPS Reports

Before you begin

Run a successful Discovery job in Cisco DNA Center. You can check whether a Discovery job is successful in Device Inventory. Click the menu icon () and choose Provision > Inventory to view the results.

Procedure


Step 1

Click the menu icon () and choose Reports > Report Templates.

The Report Templates window opens and displays the supported reporting categories. A link represents each category. Click a link to view only the supported reports for that category.

For this release, reporting is supported for the following categories:

  • Access Point: Reports that provide data about Access Points and Access Point Radios.

  • Client: Reports that help with analyzing how the clients are performing in the network.

  • Executive Summary: Report that helps with analyzing how devices, applications, and clients are performing in the network.

  • Inventory: Report listing devices discovered by Cisco DNA Center.

  • Licensing: Reports that lists devices that noncompliant devices and the reasons for noncompliance.

  • Network Devices: Reports that provide data about the devices within your network.

  • Rogue and aWIPS: Reports that provide data about threats within your network.

  • SWIM: Report listing all the devices in network with software and versioning.

  • Security Advisories: Report that provides Cisco security advisory information on the network devices.

Note


The Access Point, Client, and Executive Summary reports support up to 90 days of data retention.

Step 2

After clicking a link, review the Report Templates window for that selected category.

Figure 73. Reports Templates Window

The Report Templates window displays supported report templates. Each template is represented by a tile and contains information about the report and links to configure (generate) a report. Determine which template you wish to use to generate a report. For example, for a Rogue and aWIPs report you can create a New Threat or Thread Detail report. Within the tile are also icons that represent the supported file types for the reports (CSV, TDE, or JSON).

Step 3

In the tile, click the header to view a sample report.

A window appears for the sample report. Use the side bar in the window to scroll down and review the entire sample report. The following data is presented:

  • Applied filters (data filters that were used to build the report).

  • Data metrics and summaries

  • Graphical representation of the data (including line, bar, and pie graphs).

  • Tables that assist you in analyzing the data.

Note


You can use the sample report to plan how you want your report to look.

Step 4

Click X to close the preview.

Step 5

In the tile, click the Generate link to configure parameters to build a report.

The Generate window opens where you can select a format type for the report, apply data filters for your reports, as well as set up schedules for the actual report generation.

Step 6

In the Generate a New Report window, click Let's Do It to get started.

Figure 74. Generate a New Report

The Select Report Template window opens.

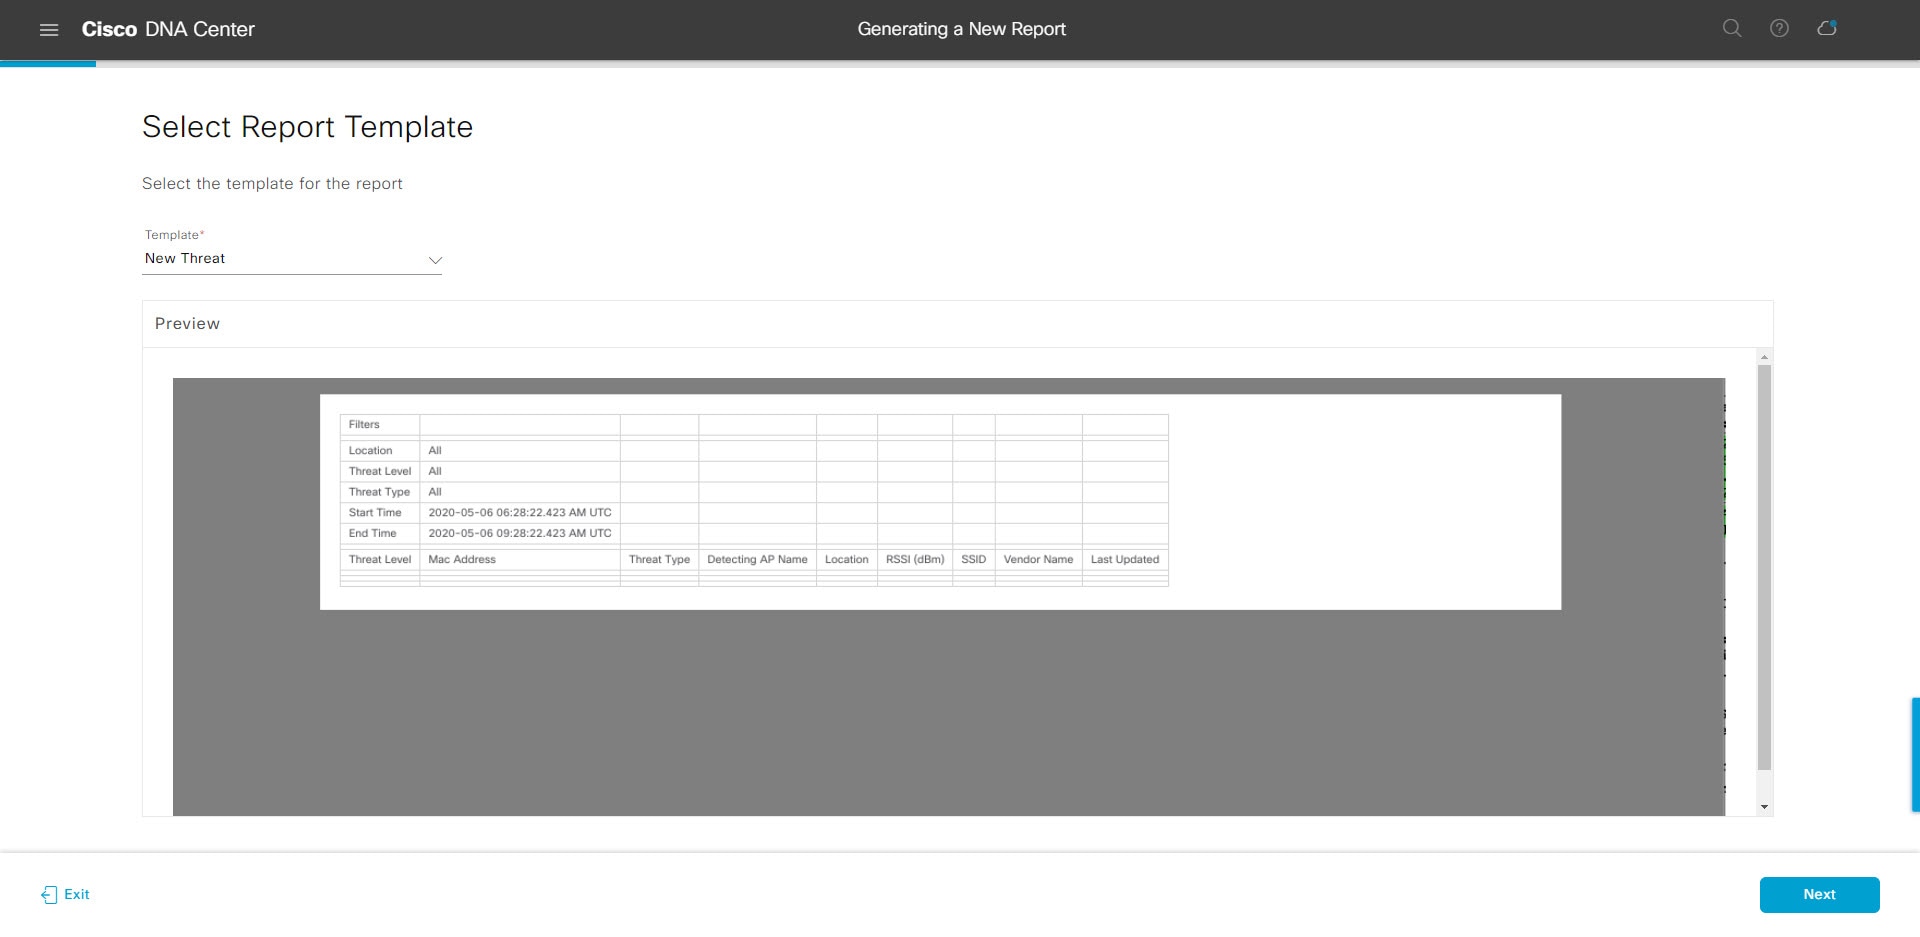
Step 7

In the Select Report Template window, select the template for the report.

Choose the Template from the drop-down lists.

Note


The Template consists of the individual report types within the categories for the release.

You can review an autogenerated sample in the same window.

Figure 75. Setup Report Template

Click Next. The Setup Report Scope window opens.

Step 8

In the Setup Report Scope window, name the report and select the scope.

Enter a report name in the Report Name field and click in the Scope field to display the available filter. Click the filter options that you want for the report.

Note


The Setup Report Scope options change depending upon the selected Template.

Figure 76. Setup Report Scope

Click Next. The Select File Type window opens.

Step 9

In the Select File Type window, select the file type for the report.

Depending upon the report that you are creating, the following File Type options may be available:

  • PDF

  • CSV

  • Tableau Data Extract

  • JSON

For the CSV, JSON, and Tableau Data Extract file types, a Fields option displays that permits you to select attributes (additional fields) for the CSV, JSON, and Tableau Data Extract results.

Figure 77. Select File Type

Click Next. The Schedule Report window opens.

Step 10

In the Schedule Report window, select the time range and schedule for the report.

The following Time Range options are available:

  • Last 3 hours

  • Last 24 hours

  • Last 7 days

  • Custom

    Note


    Clicking Custom opens up fields where you can choose the date and time interval per the specific report type, as well as the time zone (GMT) for the time range.

The following Schedule options are available:

  • Run Now

  • Run Later

  • Run Recurring

You can also select a time zone for the report when configuring with the following Schedule options:

  • Custom

  • Run Later (One Time)

  • Run Recurring

Figure 78. Schedule Report

Click Next. The Delivery and Notification window opens.

Step 11

In the Delivery and Notification window, select the Delivery mechanism for the report.

The options include:

  • Email Report: Email report is sent as a link or attachment.

    Note


    If you have not yet configured an SMTP server for the emails, you will be prompted to configure one. Follow the prompts to the Email tab in the GUI to configure an SMTP server. Click System > Settings > External Services > Destinations > Email.

    • Link: The email notification of a successfully compiled report has a link back to itself and the Generated Reports page under Reports. You can view and download the report from this link and location.

      Note


      Email notifications with embedded links to reports support up to 20 email addresses. To add multiple email addresses, you need to add each email address separately and press Enter (on your keyboard) after each addition. Cisco DNA Center platform validates the email addresses and notifies you if the syntax is incorrect.

    • Attachment: Report is attached to the email notification.

      Note


      PDF reports support email notification attachments of up to 20-MB in size and up to 10 email addresses. To add multiple email addresses, you need to add each email address separately and press Enter (on your keyboard) after each addition. Cisco DNA Center platform validates the email addresses and notifies you if the syntax is incorrect.

    Cisco DNA Center sends the following email notifications for the report:

    • Report is in the queue waiting to be processed.

    • Report processing is in progress.

    • Report has successfully been compiled and is completed.

  • Webhook Notification: Notification is sent as a webhook to the configured webhook URL address (callback URL). Select a webhook from the drop-down list (Subscription Profile field).

    Note


    If you have not yet created a webhook, you will be prompted to create one. Follow the prompts to the Webhook tab in the GUI to configure a webhook. In general, to configure a webhook, click System > Settings > External Services > Destinations > Webhook tab.

    You will receive status webhook notifications for the report. For example, you will receive "In Queue", "In Progress", and "Success" webhook notifications. You will also be able to view these notifications in the GUI.

Figure 79. Delivery and Notification

Click Next. The Summary window opens.

Step 12

In the Summary window, review the configuration and if necessary edit any of the files.

Figure 80. Summary

Click Next.

After the report is generated, a success window appears.

Step 13

Click the View the Generated Reports link.

The Generated Reports window opens with instance details of the report that was scheduled.

Figure 81. Generated Reports

What to do next

Review your report instance in Generated Reports window.


Note


You can download, review, edit, duplicate, or delete the report in the Generated Reports window. For additional information, see View Generated Reports.


Run an ROI Report

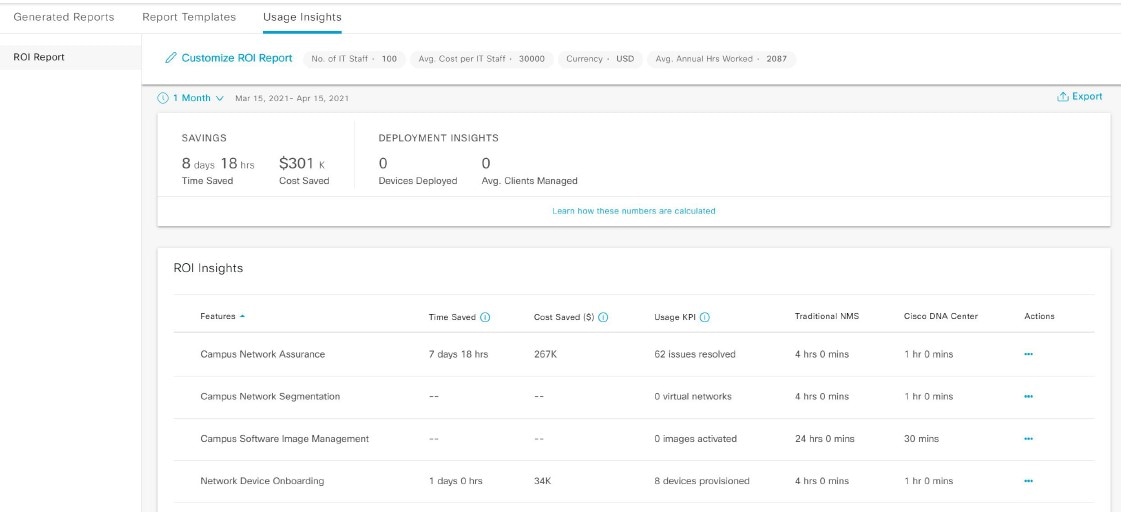
The Cisco DNA Center platform ROI Insights report is a customized report that shows the productivity improvement of network operations with Cisco DNA Center and comparative ROI insights with a traditional NMS.

The following procedure describes how to configure an ROI report for a network operation.

Procedure


Step 1

Click the menu icon () and choose Reports > Usage Insights.

The Usage Insights window displays the following information:

  • SAVINGS: Displays the time and cost saved on network operation with Cisco DNA Center for a selected time range.

  • ROI Insights: Lists the ROI Insights report that is created based on Features, Time Saved, Cost Saved, Usage KPI, Traditional NMS time, Cisco DNA Center time, and Actions.

  • Savings Trends: Displays the savings trend of Cost and Time for an ROI Insights report.

    Note


    The Savings Trends area appears only if the selected time range is more than a month.

Step 2

In the Campus Network Assurance, Network Device Onboarding, Campus Software Image Management, and Campus Network Segmentation areas, enter the time savings in the Hours and Minutes name fields for a traditional NMS and Cisco DNA Center.

  • Traditional NMS: Average time to detect and resolve an issue in the network without Cisco DNA Center.

  • Cisco DNA Center: Average time to detect and resolve an issue in the network with Cisco DNA Center.

Step 3

To modify the Cost Inputs and IT Inputs, click Customize ROI Insights and make the changes.

The Customize ROI Insights area displays the preconfigured Avg. Cost per IT Staff, Currency, No. of IT Staff, and Avg. Annual Hrs Worked.

Step 4

To edit the time savings for a feature, click the corresponding Edit link under the Actions column and update the time in the subsequent pop-up window.

Step 5

To choose the time range for which you want to see the ROI report, click the time range drop-down list below the Customize ROI Insights pane and click a time range radio button.

  1. Choose from the available time range options: 1 Month, 3 Months, 6 Months, and 1 Year.

  2. To customize the time range of ROI reports, click the time range drop-down list, click Custom, and define the Start Date and End Date.

Figure 82. Usage Insights Report Dashboard

Step 6

Click Learn how these numbers are calculated above the ROI Insights table in the middle pane to see the calculation details.

The Calculation Details window shows how to calculate Time Saved and Cost Saved.

Step 7

To export the ROI report, click Export.

The supported file types for the reports are PDF and CSV.


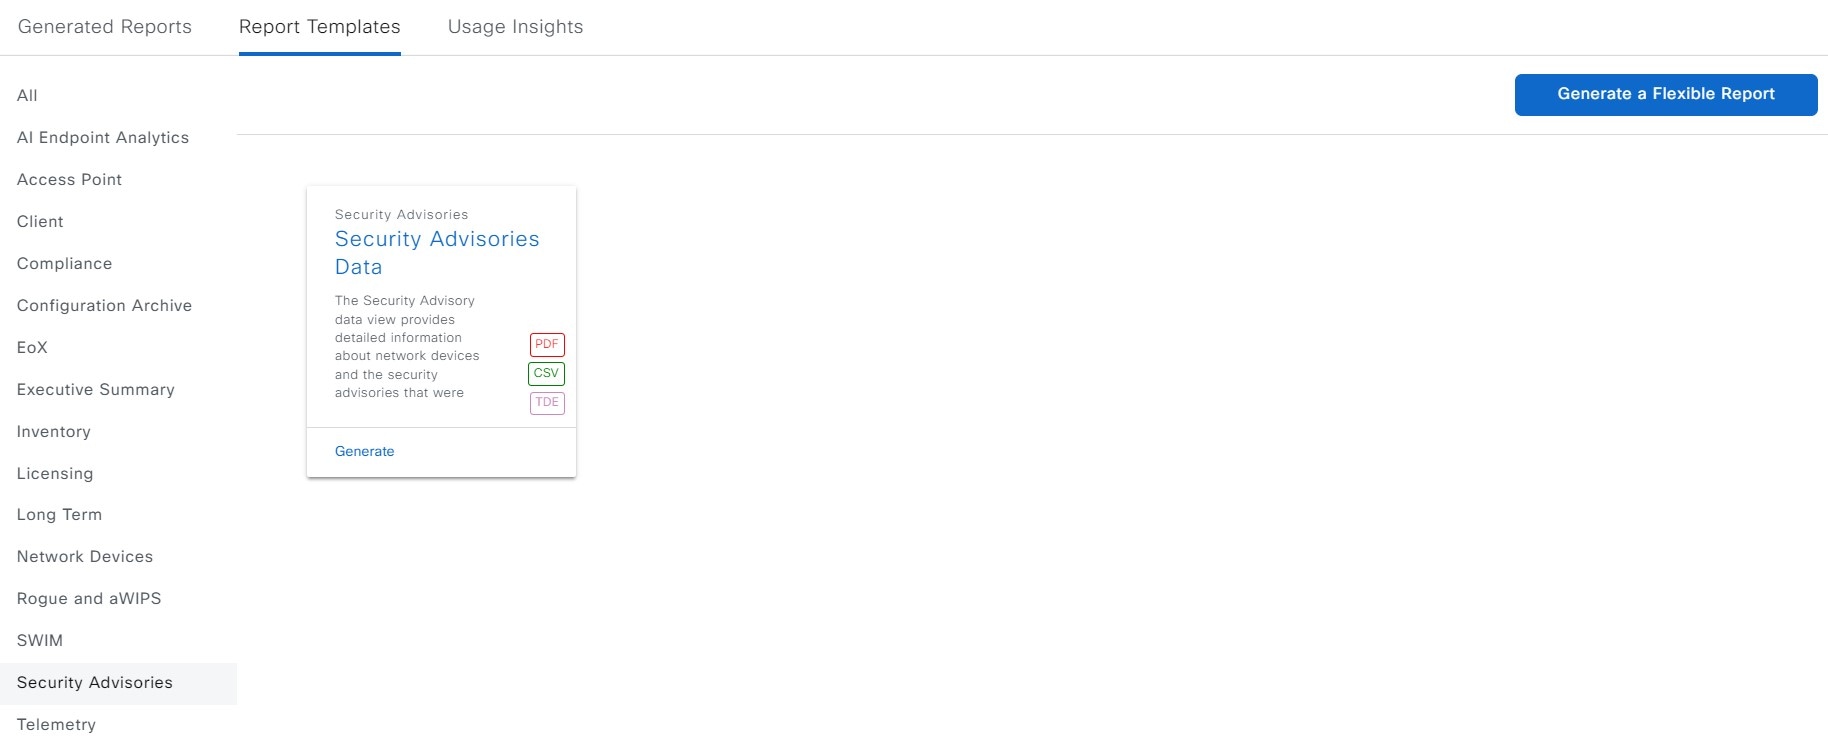
Run a Security Advisories Report

Perform this procedure to configure a Security Advisories report about your network. You can configure a Security Advisories report using the Reports window in the Cisco DNA Center GUI.

Figure 83. Security Advisories Report

Before you begin

Run a successful Discovery job in Cisco DNA Center. You can check whether a Discovery job is successful in Device Inventory. Click the menu icon () and choose Provision > Inventory to view the results.

Procedure


Step 1

Click the menu icon () and choose Reports > Report Templates.

The Report Templates window opens and displays the supported reporting categories. A link represents each category. Click a link to view only the supported reports for that category.

For this release, reporting is supported for the following categories:

  • Access Point: Reports that provide data about Access Points and Access Point Radios.

  • Client: Reports that help with analyzing how the clients are performing in the network.

  • Executive Summary: Report that helps with analyzing how devices, applications, and clients are performing in the network.

  • Inventory: Report listing devices discovered by Cisco DNA Center.

  • Licensing: Reports that lists devices that noncompliant devices and the reasons for noncompliance.

  • Network Devices: Reports that provide data about the devices within your network.

  • Rogue and aWIPS: Reports that provide data about threats within your network.

  • SWIM: Report listing all the devices in network with software and versioning.

  • Security Advisories: Report that provides Cisco security advisory information on the network devices.

Note


The Access Point, Client, and Executive Summary reports support up to 90 days of data retention.

Step 2

After clicking on a link, review the Report Templates window for that selected category.

Figure 84. Report Templates Window

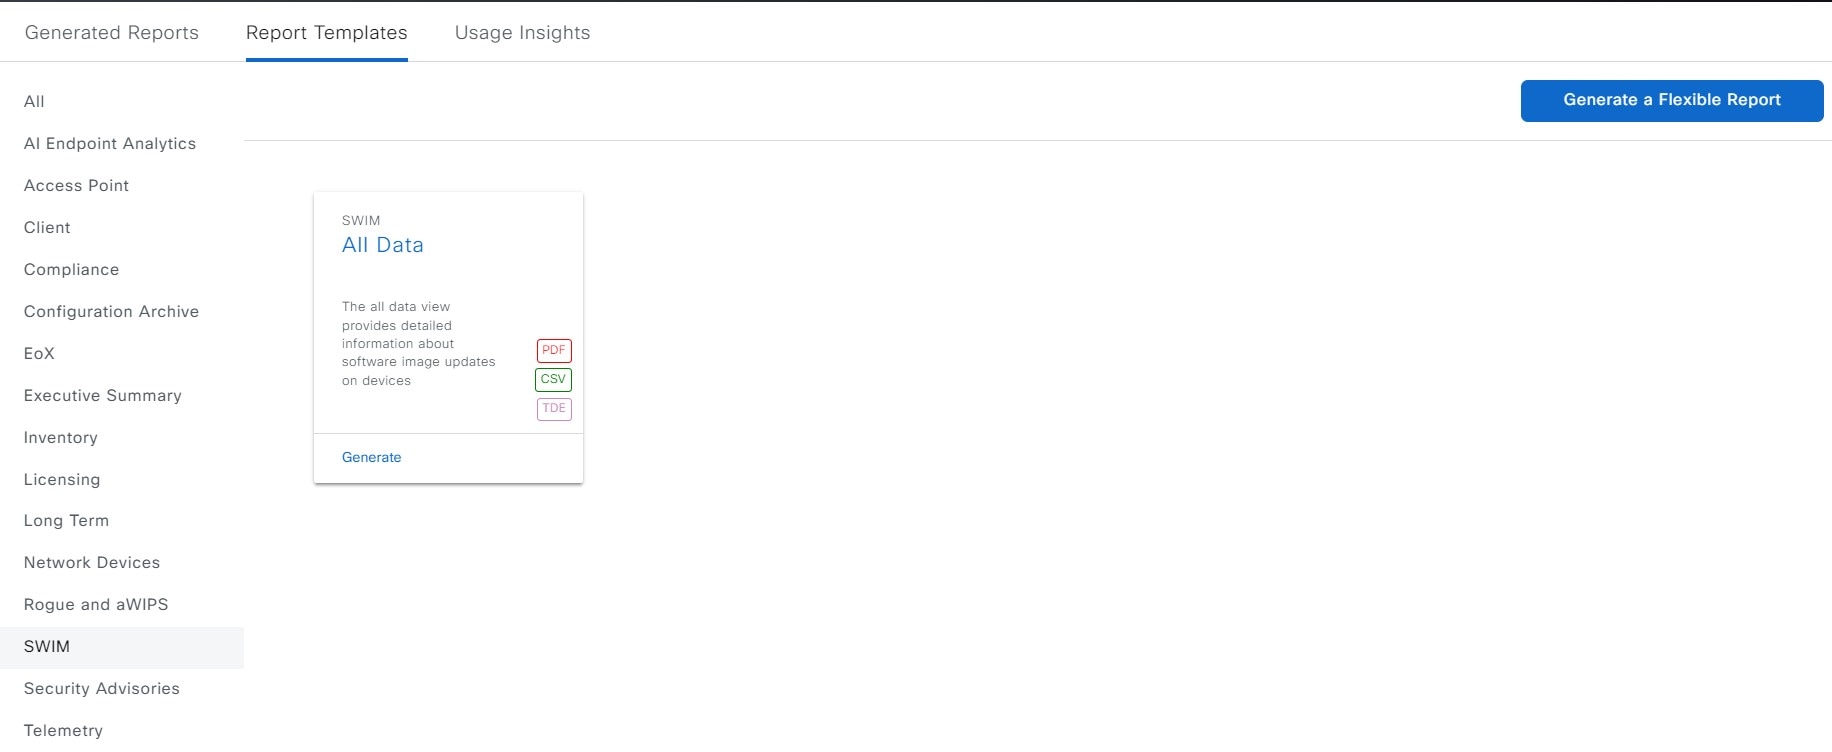
The Report Templates window displays supported report templates. Each template is represented by a tile and contains information about the report and links to configure (generate) a report. Determine which template you wish to use to generate a report. For example, for a Security Advisories report you can create a Security Advisories Data report. Within the tile are also icons that represent the supported file types for the reports (PDF, CSV, or TDE).

Step 3

In the tile, click the header to view a sample report.

A window appears for the sample report. Use the side bar in the window to scroll down and review the entire sample report. The following data is presented:

  • Applied filters (data filters that were used to build the report).

  • Data metrics and summaries

  • Tables that assist you in analyzing the data.

Note


You can use the sample report to plan how you want your report to look.

Step 4

Click X to close the preview.

Step 5

In the tile, click the Generate link to configure parameters to build a report.

The Generate window opens where you can select a format type for the report, apply data filters for your reports, as well as set up schedules for the actual report generation.

Step 6

In the Generate a New Report window, click Let's Do It to get started.

Figure 85. Generate a New Report

The Select Report Template window opens.

Step 7

In the Select Report Template window, select the template for the report.

Choose the Template from the drop-down lists.

Note


The Template consists of the individual report types within the categories for the release.

You can review an autogenerated sample in the same window.

Figure 86. Select Report Template

Click Next. The Setup Report Scope window opens.

Step 8

In the Setup Report Scope window, name the report and select the scope.

Enter a report name in the Report Name field and click in the Scope field to display the available filter. Click the filter options that you want for the report.

Note


The Setup Report Scope options change depending upon the selected Template.

Figure 87. Setup Report Scope

Click Next. The Select File Type window opens.

Step 9

In the Select File Type window, select the file type for the report.

Depending upon the report that you are creating, the following File Type options may be available:

  • PDF

  • CSV

  • Tableau Data Extract

  • JSON

For the CSV, JSON, and Tableau Data Extract file types, a Fields option displays that permits you to select attributes (additional fields) for the CSV, JSON, and Tableau Data Extract results.

Figure 88. Select File Type

Click Next. The Schedule Report window opens.

Step 10

In the Schedule Report window, select the time range and schedule for the report.

The following Time Range options are available:

  • Last 3 hours

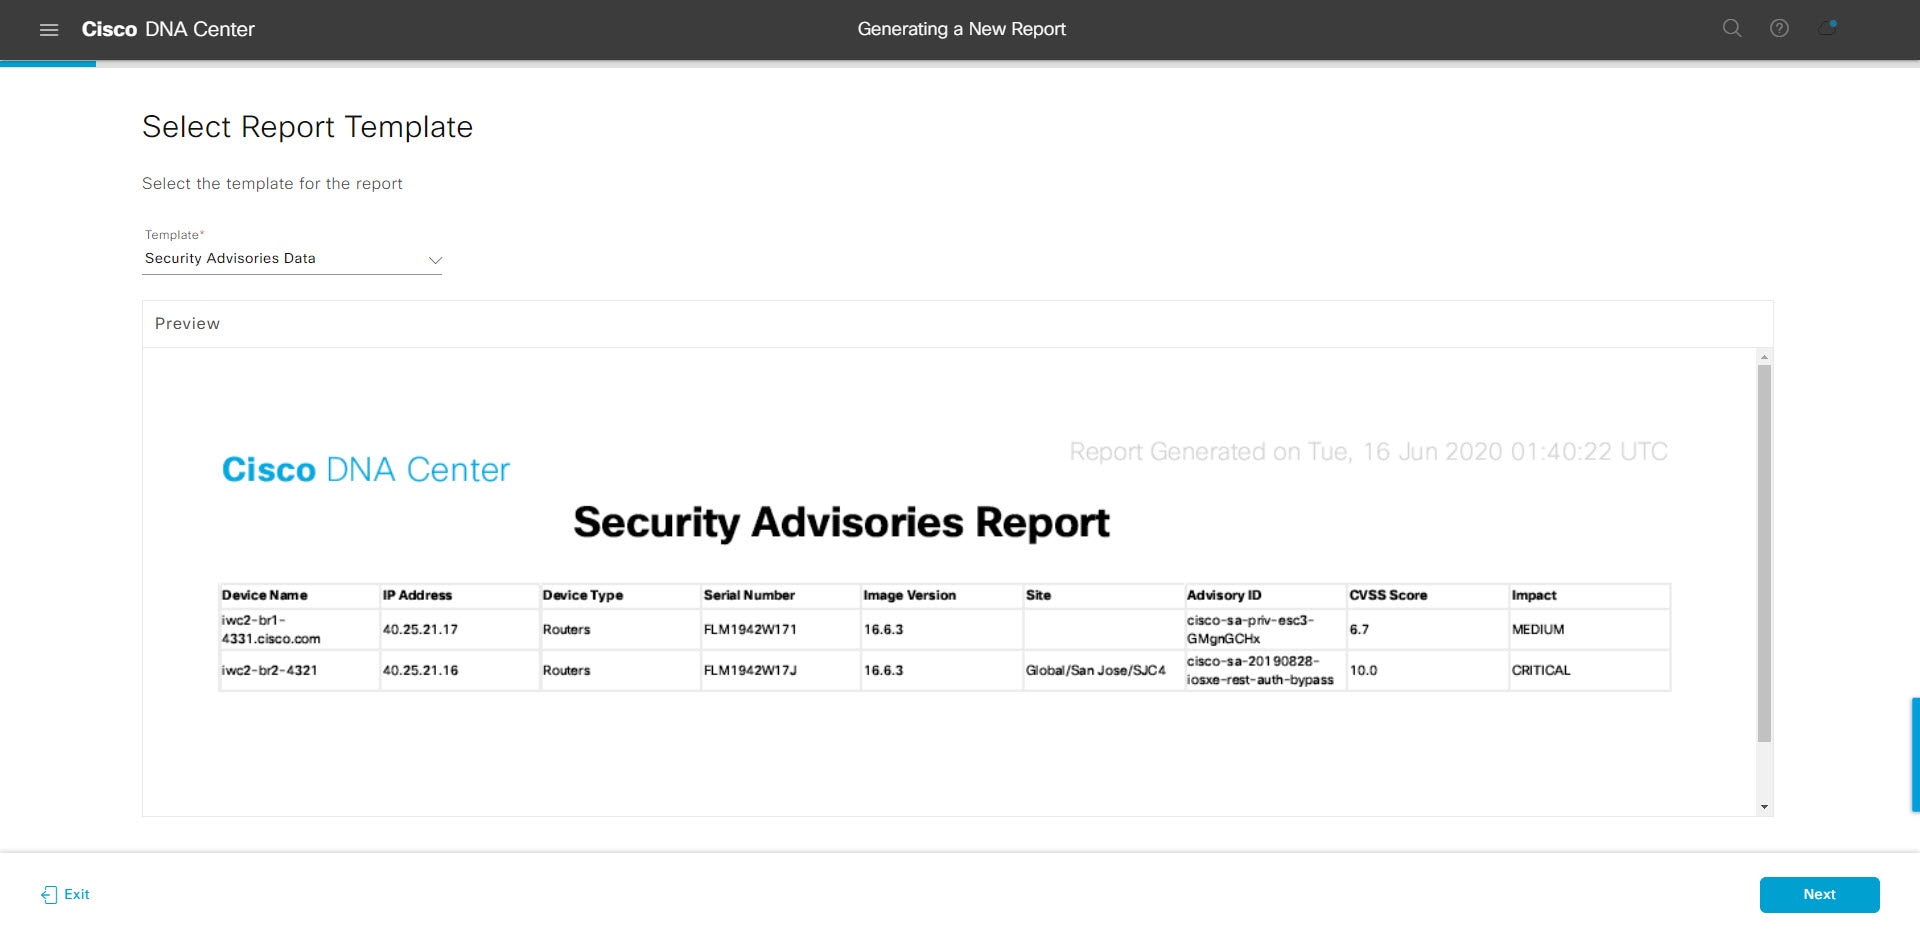
  • Last 24 hours

  • Last 7 days

  • Custom

    Note


    Clicking Custom opens up fields where you can choose the date and time interval per the specific report type, as well as the time zone (GMT) for the time range.

The following Schedule options are available:

  • Run Now

  • Run Later

  • Run Recurring

You can also select a time zone for the report when configuring with the following Schedule options:

  • Custom

  • Run Later (One Time)

  • Run Recurring

Figure 89. Schedule Report

Click Next. The Delivery and Notification window opens.

Step 11

In the Delivery and Notification window, select the Delivery mechanism for the report.

The options include:

  • Email Report: Email report is sent as a link or attachment.

    Note


    If you have not yet configured an SMTP server for the emails, you will be prompted to configure one. Follow the prompts to the Email tab in the GUI to configure an SMTP server. Click System > Settings > External Services > Destinations > Email.

    • Link: The email notification of a successfully compiled report has a link back to itself and the Generated Reports page under Reports. You can view and download the report from this link and location.

      Note


      Email notifications with embedded links to reports support up to 20 email addresses. To add multiple email addresses, you need to add each email address separately and press Enter (on your keyboard) after each addition. Cisco DNA Center platform validates the email addresses and notifies you if the syntax is incorrect.

    • Attachment: Report is attached to the email notification.

      Note


      PDF reports support email notification attachments of up to 20-MB in size and up to 10 email addresses. To add multiple email addresses, you need to add each email address separately and press Enter (on your keyboard) after each addition. Cisco DNA Center platform validates the email addresses and notifies you if the syntax is incorrect.

    Cisco DNA Center sends the following email notifications for the report:

    • Report is in the queue waiting to be processed.

    • Report processing is in progress.

    • Report has successfully been compiled and is completed.

  • Webhook Notification: Notification is sent as a webhook to the configured webhook URL address (callback URL). Select a webhook from the drop-down list (Subscription Profile field).

    Note


    If you have not yet created a webhook, you will be prompted to create one. Follow the prompts to the Webhook tab in the GUI to configure a webhook. In general, to configure a webhook, click System > Settings > External Services > Destinations > Webhook tab.

    You will receive status webhook notifications for the report. For example, you will receive "In Queue," "In Progress," and "Success" webhook notifications. You will also be able to view these notifications in the GUI.

Figure 90. Delivery and Notification

Click Next. The Summary window opens.

Step 12

In the Summary window, review the configuration and if necessary edit any of the files.

Figure 91. Summary

Click Next.

After the report is generated, a success window appears.

Step 13

Click the View the Generated Reports link.

The Generated Reports window opens with instance details of the report that was scheduled.

Figure 92. Generated Reports

What to do next

Review your report instance in Generated Reports window.


Note


You can download, review, edit, duplicate, or delete the report in the Generated Reports window. For additional information, see View Generated Reports.


Run a SWIM Report

Perform this procedure to configure SWIM reports about your network. You can configure SWIM reports using the Reports window in the Cisco DNA Center GUI.

Figure 93. SWIM Reports

Before you begin

Run a successful Discovery job in Cisco DNA Center. You can check whether a Discovery job is successful in Device Inventory. Click the menu icon () and choose Provision > Inventory to view the results.

Procedure


Step 1

Click the menu icon () and choose Reports > Report Templates.

The Report Templates window opens and displays the supported reporting categories. A link represents each category. Click a link to view only the supported reports for that category.

For this release, reporting is supported for the following categories:

  • Access Point: Reports that provide data about Access Points and Access Point Radios.

  • Client: Reports that help with analyzing how the clients are performing in the network.

  • Executive Summary: Report that helps with analyzing how devices, applications, and clients are performing in the network.

  • Inventory: Report listing devices discovered by Cisco DNA Center.

  • Licensing: Reports that lists devices that noncompliant devices and the reasons for noncompliance.

  • Network Devices: Reports that provide data about the devices within your network.

  • Rogue and aWIPS: Reports that provide data about threats within your network.

  • SWIM: Report listing all the devices in network with software and versioning.

  • Security Advisories: Report that provides Cisco security advisory information on the network devices.

Note


The Access Point, Client, and Executive Summary reports support up to 90 days of data retention.

Step 2

After clicking a link, review the Report Templates window for that selected category.

Figure 94. Report Templates Window

The Report Templates window displays supported report templates. Each template is represented by a tile and contains information about the report and links to configure (generate) a report. Determine which template you wish to use to generate a report. For example, for a SWIM report you can create an All Data report. Within the tile are also icons that represent the supported file types for the reports (PDF, CSV, or TDE).

Step 3

In the tile, click the header to view a sample report.

A window appears for the sample report. Use the side bar in the window to scroll down and review the entire sample report. The following data is presented:

  • Applied filters (data filters that were used to build the report).

  • Data metrics and summaries

  • Tables that assist you in analyzing the data.

Note


You can use the sample report to plan how you want your report to look.

Step 4

Click X to close the preview.

Step 5

In the tile, click the Generate link to configure parameters to build a report.

The Generate window opens where you can select a format type for the report, apply data filters for your reports, as well as set up schedules for the actual report generation.

Step 6

In the Generate a New Report window, click Let's Do It to get started.

Figure 95. Generate a New Report

The Select Report Template window opens.

Step 7

In the Select Report Template window, select the template for the report.

Choose the Template from the drop-down lists.

Note


The Template consists of the individual report types within the categories for the release.

You can review an autogenerated sample in the same window.

Figure 96. Setup Report Template

Click Next. The Setup Report Scope window opens.

Step 8

In the Setup Report Scope window, name the report and select the scope.

Enter a report name in the Report Name field and click in the Scope field to display the available filter. Click the filter options that you want for the report.

Note


The Setup Report Scope options change depending upon the selected Template.

Figure 97. Setup Report Scope

Click Next. The Select File Type window opens.

Step 9

In the Select File Type window, select the file type for the report.

Depending upon the report that you are creating, the following File Type options may be available:

  • PDF

  • CSV

  • Tableau Data Extract

  • JSON

For the CSV, JSON, and Tableau Data Extract file types, a Fields option displays that permits you to select attributes (additional fields) for the CSV, JSON, and Tableau Data Extract results.

Figure 98. Select File Type

Click Next. The Schedule Report window opens.

Step 10

In the Schedule Report window, select the time range and schedule for the report.

The following Time Range options are available:

  • Last 3 hours

  • Last 24 hours

  • Last 7 days

  • Custom

    Note


    Clicking Custom opens up fields where you can choose the date and time interval per the specific report type, as well as the time zone (GMT) for the time range.

The following Schedule options are available:

  • Run Now

  • Run Later

  • Run Recurring

You can also select a time zone for the report when configuring with the following Schedule options:

  • Custom

  • Run Later (One Time)

  • Run Recurring

Figure 99. Schedule Report

Click Next. The Delivery and Notification window opens.

Step 11

In the Delivery and Notification window, select the Delivery mechanism for the report.

The options include:

  • Email Report: Email report is sent as a link or attachment.

    Note


    If you have not yet configured an SMTP server for the emails, you will be prompted to configure one. Follow the prompts to the Email tab in the GUI to configure a SMTP server. Click System > Settings > External Services > Destinations > Email.

    • Link: The email notification of a successfully compiled report has a link back to itself and the Generated Reports page under Reports. You can view and download the report from this link and location.

      Note


      Email notifications with embedded links to reports support up to 20 email addresses. To add multiple email addresses, you need to add each email address separately and press Enter (on your keyboard) after each addition. Cisco DNA Center platform validates the email addresses and notifies you if the syntax is incorrect.

    • Attachment: Report is attached to the email notification.

      Note


      PDF reports support email notification attachments of up to 20-MB in size and up to 10 email addresses. To add multiple email addresses, you need to add each email address separately and press Enter (on your keyboard) after each addition. Cisco DNA Center platform validates the email addresses and notifies you if the syntax is incorrect.

    Cisco DNA Center sends the following email notifications for the report:

    • Report is in the queue waiting to be processed.

    • Report processing is in progress.

    • Report has successfully been compiled and is completed.

  • Webhook Notification: Notification is sent as a webhook to the configured webhook URL address (callback URL). Select a webhook from the drop-down list (Subscription Profile field).

    Note


    If you have not yet created a webhook, you will be prompted to create one. Follow the prompts to the Webhook tab in the GUI to configure a webhook. In general, to configure a webhook, click System > Settings > External Services > Destinations > Webhook tab.

    You will receive status webhook notifications for the report. For example, you will receive "In Queue," "In Progress," and "Success" webhook notifications. You will also be able to view these notifications in the GUI.

Figure 100. Delivery and Notification

Click Next. The Summary window opens.

Step 12

In the Summary window, review the configuration and if necessary edit any of the files.

Figure 101. Summary

Click Next.

After the report is generated, a success window appears.

Step 13

Click the View the Generated Reports link.

The Generated Reports window opens with instance details of the report that was scheduled.

Figure 102. Generated Reports

What to do next

Review your report instance in the Generated Reports window.


Note


You can download, review, edit, duplicate, or delete the report in the Generated Reports window. For additional information, see View Generated Reports.


View Generated Reports

Perform this procedure to download, review, edit, duplicate, or delete a previously generated report.

Figure 103. Generated Reports

Before you begin

  • Run a successful Discovery job in Cisco DNA Center. You can check whether a Discovery job is successful in Device Inventory. Click the menu icon () and choose Provision > Inventory to view the results.

  • Create a report using the Schedule functionality in the Catalog.

Procedure


Step 1

Click the menu icon () and choose Reports.

Step 2

Click the Generated Reports tab.

The following information is displayed:

  • Report Name: Name of the report.

  • If you did not give the report a name, a default name is given to the report that contains the report type with the date and time of the report.

    Note


    With this release, the report name becomes a link that opens up a view of the report itself within the Generated Reports window. Also, there is a Download link that is provided to download a copy of the report.

  • Schedule: One-time generated report or reoccurring report. Also, there is a brief description of the schedule that generated the report.

  • Last Run: Displays report execution status and details. The following report execution status types may be displayed:

    • Not Initiated: Report scheduled but not yet started.

    • In Queue: Report scheduled and in the processing queue to be executed.

    • In Progress: Report currently being executed.

    • Completed: Report execution completed displaying the date and time.

      Clicking on the icon (downward pointing arrow) downloads the last generated report.

    • Expired: Report expired and no longer available in Cisco DNA Center.

    • Error: Report execution failed.

  • Reports: Number of reports up to a total of 7.

    Hover (mouse) over the displayed report number and View Report List appears. Click View Report List to display a reports dialog box. The reports dialog box lists all the report executions, their status (Not Initiated, In Queue, In Progress, Completed, Expired, and Error) and a Download button to download a copy. Clicking Error displays any errors and warnings for the report execution.

    Important


    Cisco DNA Center retains a total of 7 reports. Specifically, Cisco DNA Center retains the last 7 reports that are executed, as well as the last 7 reports executed over the last 7 days (week). For example, if you run 8 reports in a single day, Cisco DNA Center will only retain the last 7 reports. If you schedule 1 report for each day, Cisco DNA Center will only keep the most recent 7 reports over the last 7 days (week). You can also export the reports in their various formats from the Cisco DNA Center and archive them to a safe location.

  • Format: File format type, for example a PDF or CSV file format.

  • Template Category: Type of report based on the catalog options (Client, Executive Summary, SWIM, or Inventory).

  • Report Template: Template used when generating the report.

  • Actions: List of tasks you can perform with the reports.

You can adjust the downloads that are displayed in the GUI by clicking the Filter icon and using the filter, or entering a keyword in the Find field.

Step 3

Click Actions to perform one or more of the following tasks:

  • View Config: Opens a window where the configured parameters for the report are displayed (including the schedule). You can review the configured report parameters in this window. You cannot make any changes to the report configuration in this window. This is a read-only view. If you must edit the configuration, click Edit. You can both view and edit a report configuration by clicking Edit.

  • Edit: Opens a window where configured parameters for the report are displayed (including the schedule). You can review the parameters and also edit them in this window. Click Save after making any edits to the report.

    Important


    After you edit and update the report configuration, any future report executions reflect this new configuration. This is important if reports are being generated on a reoccurring schedule. Also, if you edit and update a report configuration, all the previous reports in Cisco DNA Center will be deleted. The GUI displays a warning about the deletion when clicking the Save button in the window. You do not have to make any edits in the configuration to click the Save button and delete all previous reports.

  • Duplicate: Opens the Duplicate window where you can either view or configure the parameters for the report. Click Generate Report to generate the report again.

    Note


    If you want to create a new report based on an existing report and its configuration, use the Duplicate option and make changes to the configuration. This permits you to create a new report similar to the existing one, while retaining the existing report and its configuration. If you want to discard the existing report and completely replace it with a new report, use the View Config and Edit options as described previously.

  • Run Now: Starts the process to execute the report. A Success message appears after a successful report execution.

    Note


    If you try to execute a report and there are seven previous reports, the GUI displays a warning that only the last seven reports are saved. You use the Run Now option when you must generate a report outside of an existing schedule for the reports.

  • Delete: Deletes the report. You are prompted to confirm that this action before the report is deleted.