Manage Intelligent Capture

About Intelligent Capture

For Cisco DNA Center, all information about device and client health is typically available from Cisco wireless controllers. Intelligent Capture provides support for a direct communication link between Cisco DNA Center and access points (APs), so each of the APs can communicate with Cisco DNA Center directly. Using this channel, Cisco DNA Center can receive packet capture data, AP and client statistics, and spectrum data. With the direct communication link between Cisco DNA Center and APs, Intelligent Capture allows you to access data from APs that is not available from wireless controllers.


Note


  • Intelligent Capture is only supported for APs in either local or FlexConnect mode.

  • Intelligent Capture is not supported in SDA deployments.


Supported Devices for Intelligent Capture

The following table lists the Cisco Wireless Controllers that support Intelligent Capture:

Supported Cisco Wireless Controllers
Device Minimum Supported Software Version

Cisco 3504 Wireless Controller

AireOS 8.8.125.0

Cisco 5520 Wireless Controller

AireOS 8.8.125.0

Cisco 8540 Wireless Controller

AireOS 8.8.125.0

The following table lists the Cisco Catalyst Wireless Controllers that support Intelligent Capture:

Supported Cisco Catalyst Wireless Controllers
Device Minimum Supported Software Version

Cisco Catalyst 9800 Series Wireless Controllers

IOS-XE Gibraltar 16.12.1.s

The following table lists the Cisco APs that support Intelligent Capture:

Supported Cisco APs
Device Minimum Supported AireOS Software Version Minimum Supported IOS-XE Software Version

Aironet 1540 APs1

8.10.105.0

16.12.1.s

Aironet 1560 APs

8.10.105.0

16.12.1s

Aironet 1815 APs1

8.10.105.0

16.12.1s

Aironet 1830 APs1

8.10.105.0

16.12.1s

Aironet 1840 APs1

8.10.105.0

16.12.1s

Aironet 1850 APs1

8.10.105.0

16.12.1s

Aironet 2800 Series AP

8.8.125.0 or 8.10

16.12.1s

Aironet 3800 Series APs

8.8.125.0 or 8.10

16.12.1s

Aironet 4800 Series APs2

8.8.125.0 or 8.10

16.12.1s

Catalyst 9105 AP1

8.10 MR3

17.3.1

Catalyst 9115 AP1

8.10.105.0

16.12.1s

Catalyst 9120 AP

8.10.105.0

8.10.112.0 (for Spectrum Analysis)

16.12.1s

17.2.1 (for Spectrum Analysis)

Catalyst 9130 AP2

8.10 MR3

17.3.1

Catalyst IW6300 Heavy Duty Series APs

8.10.105.0

17.1.1s

Catalyst ESW6300 Embedded Services APs

8.10.105.0

17.1.1s

1 Spectrum Analysis is not supported on the following APs: Aironet 1540 AP, Aironet 1800 Series APs, Catalyst 9105 AP, and Catalyst 9115 AP.
2 Data Packet Capture is only supported on Aironet 4800 APs and Catalyst 9130 AP.

Intelligent Capture Best Practices

The following are best practices to ensure Intelligent Capture functions optimally in Cisco DNA Center:

  • After a new wireless controller device is added to Cisco DNA Center, disable any Intelligent Capture global settings, and then re-enable those settings so that they will be configured on the new wireless controller.

  • Before deleting a wireless controller device from Cisco DNA Center, disable all Intelligent Capture settings.

  • Before upgrading any of managed wireless controllers or reimaging Cisco DNA Center, disable all Intelligent Capture settings, and then re-enable them after completing the upgrade.

Live and Scheduled Capture Sessions for a Client Device

About Capture Sessions for a Client Device

You can run the following types of capture sessions for a client device:

  • Live Capture Sessions: Live capture sessions can be started immediately and can run for up to three hours for that specific client. See Enable a Live Capture Session for a Client Device.

  • Scheduled Capture Sessions: Scheduled capture sessions are scheduled for a future time and can run for up to eight hours. See Schedule and Manage Capture Sessions for a Client Device.


    Note


    Because scheduled capture and live capture sessions collect the same data, a scheduled capture session that is currently running is equivalent to a live capture session.


Live and scheduled capture sessions allow you to collect data for onboarding events (2-second intervals) and RF statistics charts (5-second samples). This data is displayed in the Client 360 > Intelligent Capture window.

Client Capture Session Limitations

Client capture sessions have the following limitations:

  • There are a total of 16 time slots allocated for capture sessions (live and scheduled), where each client in a session uses one time slot.

    The maximum number of live capture sessions is 16, so if 16 live capture sessions are running at the same time, no slots are available for scheduled capture sessions.

    The maximum number of concurrent scheduled capture sessions is 12, which always leaves four (16 minus 12) available slots for live capture sessions.

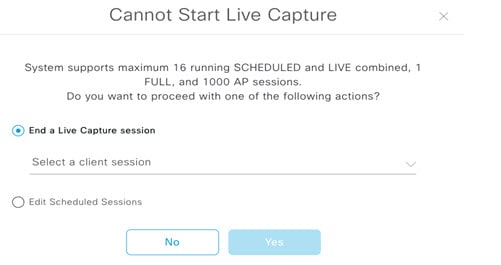
    If these maximum values are exceeded, for example, you try to start a seventeenth live capture session, the following error message is displayed. Click Yes in the error message dialog box, and then select a capture session for which you want to end the live capture.


    Note


    The 16-time-slot limit is enforced by the wireless controller.

    When capture sessions are configured on Cisco DNA Center, any live or scheduled capture sessions that Cisco DNA Center is not aware of (such as partial packet capture sessions that were directly configured on the wireless controller) are removed.


  • A maximum of 100 packets involved in onboarding events can be captured during the time period surrounding the event.

  • There is a 3.5-GB limit on the total size of all scheduled onboarding packet files that reside on Cisco DNA Center. If the limit is exceeded, packet files are removed, starting with the oldest, until the total size falls below the 3.5-GB limit.

About Client Statistics

Live and scheduled capture sessions are global settings that enable supported APs to collect client statistics over 5-second intervals.

Client statistics are also collected over 30-second intervals when AP stats are enabled for the AP to which the client is connected.

When client statistics are collected, they are displayed on the four RF statistic charts on the Client 360 > Intelligent Capture window.

Enable a Live Capture Session for a Client Device

Use this procedure to enable a live capture session for a specific client device and view data packets for the onboarding events and RF statistics.

Procedure


Step 1

Click the menu icon () and choose Assurance > Health.

The Overall health dashboard appears.

Step 2

Click the Client Health tab.

The Client Health window appears.

Step 3

Open the Client 360 window of a specific client by doing one of the following:

  • In the Client Devices table, click the hyperlinked Identifier or the MAC address of the device.
  • In the Search field (located on the top-right corner), enter one of the following: user ID (authenticated through Cisco ISE), IP address, or MAC address.

A 360° view of the client device appears.

Step 4

In the Client 360 window, click Intelligent Capture.

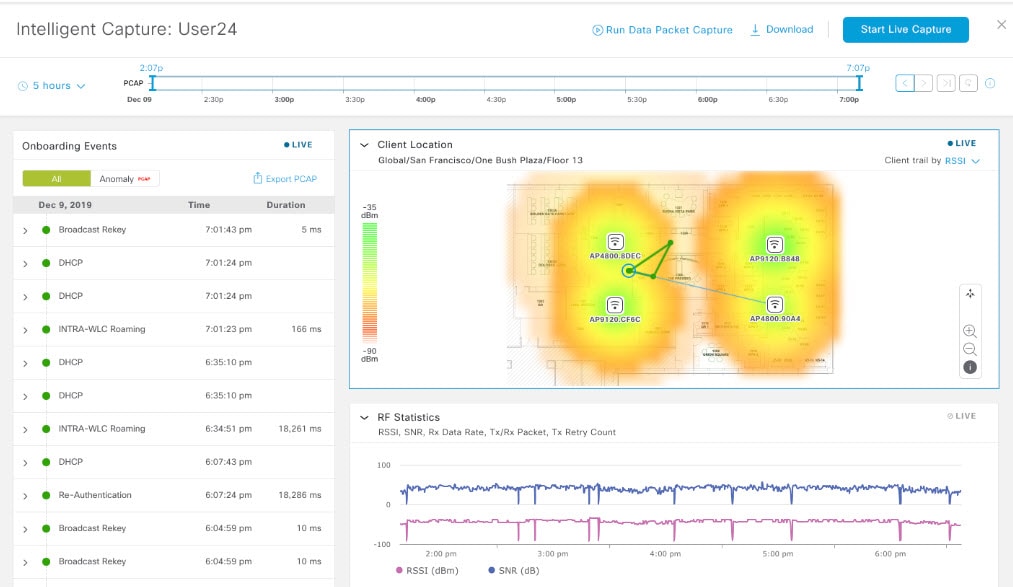
The Intelligent Capture: Client Device window appears with the following information:

Attention


If a icon with the message GRPC link is not ready (CONNECTING) appears next to the client name, see Client or Access Point Unable to Send Intelligent Capture Data to Cisco DNA Center for more details.

Figure 1. Intelligent Capture Window of a Client

Step 5

Use the timeline slider for the following functionality:

Timeline Slider
Item Description

1 hour drop-down list

Click the drop-down list and select a duration to set the range of the timeline. Options are 1 hour, 3 hours, and 5 hours. Default is 1 hour.

Timeline Slider

The timeline slider determines the time window of all data displayed. A line chart of onboarding events is displayed for the results of a live capture. Green indicates onboarding events and red indicates anomaly events.

To adjust the timeline to a different time window, click the < and > buttons to the desired time window.

Note


The timeline can display data from up to two weeks in the past.

For more customization of the timeline range, click and drag the boundary lines.

Step 6

To perform a live capture session, do the following:

  1. Click Start Live Capture at the top-right corner to start a live capture session.

    During a live capture session, data packets for the Onboarding Events and RF Statistics dashlets are collected.

  2. Click Stop Capturing to stop the live capture session.

    Note


    Live capture sessions run for three hours. After three hours, a dialog box for extending the session appears.

  3. View the running live capture sessions in the Intelligent Capture Settings window for clients.

Step 7

Use the Onboarding Events dashlet to view events that are associated with establishing a network connection:

Onboarding Events Dashlet
Item Description

All and filter

Allows you to filter the onboarding events. Options are:

  • All: Displays all events. This is the default.

  • : Filter for only anomaly events.

Note


If the client has issues joining the network, the word "PCAP" is displayed in red beside the specific event.

If the client has no issues joining the network, the word "PCAP" is displayed in gray beside the specific event.

Export PCAP

You can download the packets for a range of specified events:

  1. Click Export PCAP.

  2. Specify the first and last events that you want to include in the PCAP.

  3. Click Download PCAP to start the download.

Note


Since heuristics are used to determine which packets belong to an event, packets from one minute before the first event and one minute after the last event will be included in the download. This ensures that all relevant packets are in the downloaded PCAP.

Each export is limited to the first 2000 packets, starting from the oldest timestamp.

List of Onboarding, Incomplete, and Anomaly Events

View the list onboarding, incomplete, and anomaly events in chronological order. Events are color-coded to indicate the following:

  • : Successful onboarding event.
  • : Incomplete event.
  • : Anomaly event.

Note


Events with a icon indicates that data packets for this event have been captured for download or analysis.

You can click the parent event group to expand it and view the individual events for that group.

Event Details

You can click an event group or individual event to view the following sections with further details:

Client Location: Displays the map of the client location and the client's movement during the event.

Auto Packet Analyzer: This section appears if a live capture, scheduled capture, or anomaly capture session has captured packets for the event. The icon that appears next to the event indicates that the event has captured packets.

The Auto Packet Analyzer section displays a graph with the following information:

  • The packets (up to 100) surrounding the event are divided into two groups. Gray sections indicate packets that precede the start of an onboarding session. White sections indicate packets in the onboarding session.

    De-authentication packets and unexpected patterns of packets are represented by red triangles. These are potentially significant packets that can degrade the client's onboarding experiences.

    You can download the packets by clicking Download Packets for further analysis.

  • Packet (from client or from AP)

  • Onboard packet stage identifier

  • Interpacket gap (ms)

  • RSSI (dBm) per packet

  • Associated AP

RF Statistics: Displays charts with the RF statistic data for the 10 minute interval surrounding the event.

The RF statistic data is composed of RSSI and SNR measurements in decibels, Rx average data rate and Rx last data rate, Tx packets and Rx packets, and Tx packet retry.

Note


If Anomaly Capture is enabled, the packets for anomaly events are captured even if a live or scheduled capture is not running.

Step 8

Use the Client Location dashlet to view the a floor map with the following information:

  • The location of the client and APs on the floor.

  • Heat map with the color intensity representing the strength of the coverage.

  • The real-time location of the client on the floor map. If the client moves to another location, its movement is displayed.

  • Client trail tracking with color-coded display of connectivity using the RF statistics: RSSI, SNR, data rate, throughtput, and packet drop rate.

    The color on the map indicates the client's health:

    : Good : Fair : Poor

  • The tracking of the client for a one-minute interval surrounding the time of a selected onboarding event.

  • The replay and stop or start controls below the map can be used to control the viewing.

Note


The Client Location feature requires that CMX is integrated with Cisco DNA Center. For details, see the Integrate Cisco CMX for Wireless Maps chapter.

Step 9

Use the RF Statistics dashlet to view detailed RF information.

There are four charts that displays the AP client statistics for the client. See About Client Statistics. The color-coded data contains the following information:

  • RSSI and SNR measurements in decibels.

  • Rx average data rate (from the past 5 seconds) and Rx last data rate.

  • Tx packets and Rx packets.

  • Tx packet retry.

You can do the following in the charts:

  • Hover your cursor over the chart to see the statistics for a particular time.

  • Click and drag within the chart to zoom in on a period. To change the view to the default, click the icon.

Step 10

To run a Data Packet Capture for a client device, see Run Data Packet Capture for a Client Device.


Schedule and Manage Capture Sessions for a Client Device

Use this procedure to schedule a capture session and to stop, edit, or delete a scheduled capture session.

Client capture sessions collect the following data:

Procedure


Step 1

Click the menu icon () and choose Assurance > Intelligent Capture Settings.

The Client Schedule Capture window appears.

Step 2

To schedule a client capture session, click + Schedule Client Capture.

In the Schedule Client Capture slide-in pane, do the following:

  1. In the Start Time area, specify when you want the capture session to start. Options are Run Now and Run Later.

  2. Click the Duration drop-down list to specify the duration.

  3. Click the Select Client Devices drop-down list and enter a search string that returns matches for the categories: client user ID, host name, or MAC address.

    Note


    Search returns a maximum of 10 matches for each category, so refine your search string if you do not find your entry.

    Note


    For more details about capture sessions, see About Capture Sessions for a Client Device.

  4. Click Save.

Step 3

To stop a running capture session, do the following:

  1. Click the In-progress Captures tab.

  2. Select a client from the table.

  3. Click Stop Capture.

Step 4

To edit a capture session that has been scheduled for a future time, do the following:

  1. Click the Scheduled Captures tab.

  2. Select a client from the table.

  3. Click Edit Schedule.

Step 5

To delete a completed capture session, do the following:

  1. Click the Completed Captures tab.

  2. Select a client from the table.

  3. Click Delete Schedule.


Data Packet Capture for a Client Device

About Data Packet Capture for a Client Device

Data Packet Capture allows you to capture network data into PCAP files, which can be downloaded and viewed in Wireshark. In addition, if you choose to integrate with the Network Analysis Module (NAM), you can capture the following information for a client device: accessed applications and ports, QoS data, packet loss, wireless delay, and jitter. For information about NAM integration, see About NAM Integration.

To run Data Packet Capture, see Run Data Packet Capture for a Client Device.

Data Packet Capture Limitations

Data Packet Capture has the following limitations:

  • Data Packet Capture is only supported on Cisco Aironet 4800 APs and Cisco Catalyst 9130 APs. If Data Packet Capture is enabled and the client roams to an AP that does not support it, packet capture stops until the client reconnects to an AP that supports packet capture.

  • Only one Data Packet Capture session can run at a time.

  • As for all Intelligent Capture features, clocks must be synchronized between Cisco DNA Center and the Cisco Wireless Controller for Data Packet Capture to work. Ensure that the wireless controller is connected to a Network Time Protocol (NTP) server.

  • Each Data Packet Capture session can capture up to 1 GB of rolling data. The 1 GB of data is broken into ten 100 MB files for faster downloads.

About NAM Integration

If you have a Network Analysis Module (NAM) or vNAM server running software version 6.4(2) or later, you can integrate your NAM server with Cisco DNA Center. For information about installation and configuration, see the Cisco Prime Virtual Network Analysis Module (vNAM) Installation and Configuration Guide.

With NAM integration and Full Packet Capture enabled for a client, data is provided to the Wireless Packet Application Analysis charts in the Client 360 > Intelligent Capture window. The table and charts provide information on the applications used by the client, their QoS settings, packet loss, wireless delay, and jitter.

To integrate your NAM server with Cisco DNA Center, do the following:

  1. Configure an IP address on the NAM data port.

  2. Configure the gRPC collector.


Note


NAM integration is not supported on Cisco DNA Center clusters that use IPv6 addresses.


Configure an IP Address on the NAM Data Port

Use this procedure to configure a valid IP address on the data port of the NAM or vNAM. This is required to integrate with NAM.

Note


The data port is meant for receiving packets only; it does not respond to requests. Consequently, pinging the data port will time out even if you have the IP address configured correctly. Make sure that the IP address is valid and reachable from Cisco DNA Center.


Procedure

Step 1

Log in to the CLI of the NAM server.

Step 2

Enter the command show data-port ip-addresses .

The command displays the port number and IP address:
Device# show data-port ip-addresses
Port number: 1
IPv4 address: 172.20.125.125

Step 3

If nothing is displayed for the show data-port ip-addresses command, enter the command data-port 1 ip-address ip-address to assign an IP address to port 1.

Step 4

Run the show data-port ip-addresses command again to verify that data-port 1 has been assigned an IP address.

Step 5

Record the IP address of data-port 1 or one of the other displayed ports.

Step 6

Verify that cdb-export is enabled in Cisco DNA Center. To do this, enter the command show cdb-export all . If nothing is displayed, enter the command cdb-export collector 1 ip-address IP-address-of-Cisco-DNA-Center .

Step 7

Make sure that data packets from Cisco DNA Center are processed by entering the command autocreate-data-source erspan .

Step 8

Make sure that the time on the NAM or vNAM server and Cisco DNA Center is synchronized. You can synchronize the time from the NAM user interface by choosing Administration > System > System Time.


Configure the gRPC Collector

Use this procedure to configure a gRPC collector for NAM integration. gRPC is an open source high performance RPC (Remote Procedure Call) framework.
Before you begin

Configure an IP address on the NAM data port. See Configure an IP Address on the NAM Data Port.

Procedure

Step 1

Click the menu icon () and choose System > Data Platform.

The Data Platform window appears.

Step 2

Click the Collectors tab.

The Collectors window appears.

Step 3

Click GRPC-COLLECTOR.

The GRPC-COLLECTOR window appears.

Step 4

Click + Add.

The gRPC Collector Configuration window appears.

Step 5

Add only one GRPC-COLLECTOR configuration. Do the following:

  1. In the ConfigData area, check the Agent Export check box to export the network packet data to NAM.

  2. In the Agent IP Address field, enter the IP address of the data port recorded (refer to Step 5 from Configure an IP Address on the NAM Data Port).

  3. In the Configuration Name field, enter a unique name for the GRPC collector configuration.

  4. Click Save Configuration.


Run Data Packet Capture for a Client Device

Use this procedure to run a Data Packet Capture for a client device.

Before you begin

To retrieve information about accessed applications and ports, QoS data, packet loss, wireless delay, and jitter, you must enable NAM integration. For details, see About NAM Integration.

Procedure


Step 1

Click the menu icon () and choose Assurance > Health.

The Overall health dashboard appears.

Step 2

Click the Client Health tab.

The Client Health window appears.

Step 3

Open the Client 360 window of a specific client by doing one of the following:

  • In the Client Devices table, click the hyperlinked Identifier or the MAC address of the device.
  • In the Search field (located on the top-right corner), enter one of the following: user ID (authenticated through Cisco ISE), IP address, or MAC address.

A 360° view of the client device appears.

Step 4

In the Client 360 window, click Intelligent Capture.

The Intelligent Capture: Client Device window appears with the following information:

Attention


If a icon with the message GRPC link is not ready (CONNECTING) appears next to the client name, see Client or Access Point Unable to Send Intelligent Capture Data to Cisco DNA Center.

Figure 2. Intelligent Capture Window of a Client

Step 5

Use the timeline slider for the following functionality:

Timeline Slider
Item Description

1 hour drop-down list

Click the drop-down list and select a duration to set the range of the timeline. Options are 1 hour, 3 hours, and 5 hours. Default is 1 hour.

Timeline Slider

The timeline slider determines the time window of all data displayed.

To adjust the timeline to a different time window, click the < and > buttons to the desired time window.

Note


The timeline can display data from up to two weeks in the past.

For more customization of the timeline range, click and drag the boundary lines.

Step 6

To run a Data Packet Capture, use the Data Packet Capture Area (located on the top-right corner) for the following functionality:

Data Packet Capture Area
Item Description

Run Data Packet Capture button

Use this button to start a Data Packet Capture for the client. Data Packet Capture files are used for troubleshooting and the Wireless Packet Application Analysis dashlet.

If Data Packet Capture is currently running for the client, click Data Packet Capturing Stop to stop it.

Note


Only one Data Packet Capture can run at a time. If you click Run Data Packet Capture while Data Packet Capture is running, a dialog box appears with the option to either end the current capture or start a new capture.

When a Data Packet Capture session is configured on Cisco DNA Center, any Data Packet Capture sessions that Cisco DNA Center is not aware of are removed (such as full packet capture sessions that were directly configured on the wireless controller).

Note


As for all Intelligent Capture features, time zones must be synchronized between Cisco DNA Center and the Cisco Wireless Controller for Data Packet Capture to work. Ensure that the wireless controller is connected to a Network Time Protocol (NTP) server.

Note


New sets of PCAP files are started each time a new capture session is started.

Download button

After full packet PCAP files have been captured from a session, click this button to download PCAP files. Click the icon in the Download column to download the data packet files. You can download files for either:

  • Wireless data: 802.11 files for packets between the AP and the client.

  • Wired data: Ethernet files for packets between the AP and the switch or wireless controller.

Note


A Data Packet Capture file has a limit of 100 MB. The total of all Data Packet Capture files cannot exceed 3.5 GB.

Note


Only PCAP files from the past seven days can be downloaded.

Step 7

Use the Wireless Packet Application Analysis dashlet to view details about the data packet capture.

When a data packet capture is running, this dashlet displays details about the analyzed packets, such as the accessed applications and ports, QoS data, packet loss, wireless delay, and jitter.

Note


To view data in this dashlet, you must set up the integration for NAM. See About NAM Integration.


View Client Data Packet Capture History

Use this procedure to view the history of the client data packet capture sessions, such as the time the first packet and the last data packet was captured, the total size of the captured data packets, and the type of packet.

Procedure


Step 1

Click the menu icon () and choose Assurance > Intelligent Capture Settings.

The Client Schedule Capture window appears.

Step 2

Click the Client Data Packet Capture tab.

The Client Data Packet Control window appears.

Step 3

Use the Intelligent Capture Settings - Client Data Packet Capture window to view the following information:

Option Description

Identifier

Displays the client's user ID or hostname. Click the user ID or hostname to open the Intelligent Capture: Client Device window.

MAC Address

Displays the MAC address of the client device.

First Packet Time

Displays the time the first data packet was captured.

Last Packet Time

Displays the time the last data packet was captured.

Total Size

Displays the total size of the captured data.

Currently Running

Displays whether the data packet capture is currently running.

Type of Packet

Displays the type of packet, for example, Wired or Wireless.


Intelligent Capture for Access Points

About Intelligent Capture for Access Points

The AP Intelligent Capture feature allows you to enable one or more APs to capture the following data:

  • AP Stats Capture, which includes:

    • AP radio and WLAN statistics that are displayed in the RF Statistics tab of the Device 360 > Intelligent Capture window.

    • AP Client statistics (30-second samples) that are displayed in the RF Statistics area of the Client 360 > Intelligent Capture window for all clients associated with the selected APs.

  • Anomaly Capture for anomaly onboarding events for all clients that are associated with one or more selected APs. Enabling Anomaly Capture ensures that all anomaly onboarding events (global or for all clients associated with the selected APs) are captured for download and display.

AP Capture Limitation

There is a 1.05-GB limit on the total size of all anomaly triggered packet files that reside on Cisco DNA Center. If the limit is exceeded, then packet files are removed, starting with the oldest, until the total size falls below the 1.05-GB limit.

Enable and Manage Intelligent Capture for an Access Point

Use this procedure to enable one or more access points (APs) to capture the following data:

  • AP Statistics: Includes AP radio statistics, WLAN statistics, and AP Client statistics.

  • Anomaly Capture: For anomaly onboarding events of all clients that are associated with one or more selected APs. Enabling Anomaly Capture ensures that all anomaly onboarding events (global or for all clients associated with the selected APs) are captured for download and display.

Procedure


Step 1

Click the menu icon () and choose Assurance > Intelligent Capture Settings.

The Client Schedule Capture window appears.

Step 2

Click the Access Point tab.

The Access Point window appears.

Step 3

To enable or disable AP Stats Capture, do one of the following:

  • If there are no enabled APs, the Configure AP Enablement area is displayed. Choose either the Specific or Global option, and then click Get Started.
  • If there is least one AP is enabled, the AP Stats Capture window appears. From the AP Stats Capture window, choose one of the following options:
Option Description

None - disable all APs

The None - disable all APs appears when at least one AP is enabled.

Allows you to disable AP Stats Capture on all of the APs in which it is currently enabled.

Specific - select specific APs and enable

Allows you to enable AP Stats Capture for selected APs. Do the following:

  1. Click the Specific - select specific APs and enable radio button.

  2. In the left pane, expand Global, and drill down to the site > building > floor. The right pane displays the list of APs on that floor and contains three tabs: Enabled APs, Disabled APs, and Not-Ready APs.

  3. To enable AP Stats Capture for selected APs, do the following:

    • Click the Disabled APs tab. A list of APs that have AP Stats Capture currently disabled, is displayed.

    • Check the check boxes adjacent to the APs for which you want to enable AP Stats Capture, and then click Enable.

  4. To view incompatible APs, click the Not-Ready APs tab.

    Note


    Incompatible APs have the following conditions:

    • The operation mode is not set to local or FlexConnect.

    • The OS release that is installed on the AP is not compatible. The OS release must be MR1 or later.

Global - enable all capable APs

Allows you to enable the AP Stats Capture for all capable APs.

Step 4

To enable or disable Anomaly Capture, click the Anomaly Capture tab, and then do one of the following:

  • If no APs are enabled, the Configure AP Enablement area displays, choose one of the following options, and then click Get Started.
  • If at least one AP is enabled, the Anomaly Capture window appears. From the Anomaly Capture window, choose one of the following options:
Option Description

None - disable all APs

The None - disable all APs appears when at least one AP is enabled.

Allows you to disable Anomaly Capture on all of the APs in which it is currently enabled.

Specific - select specific APs and enable or disable

Allows you to enable or disable Anomaly Capture for selected APs. Do the following:

  1. Click the Specific - select specific APs and enable or disable radio button.

  2. In the left pane, expand Global, and drill down to the site > building > floor. The right pane displays the list of APs on that floor and contains three tabs: Enabled APs, Disabled APs, and Not-Ready APs.

  3. To enable Anomaly Capture for selected APs, do the following:

    • Click the Disabled APs tab. A list of APs that have Anomaly Capture currently disabled, is displayed.

      Note


      If a previous attempt to enable the AP failed, an error message is displayed in the Config Status column.

    • Check the check boxes adjacent to the APs for which you want to enable Anomaly Capture, and then click Enable.

  4. To disable Anomaly Capture for selected APs, do the following:

    • Click the Enabled APs tab. A list of APs that have Anomaly Capture currently enabled, is displayed.

    • Check the check boxes adjacent to the APs for which you want to disable Anomaly Capture, and then click Disable.

  5. To view incompatible APs, click the Not-Ready APs tab.

    Note


    Incompatible APs have the following conditions:

    • The operation mode is not set to local or FlexConnect.

    • The OS release that is installed on the AP is not compatible. The OS release must be MR1 or later.

  6. To display the list of APs that support Intelligent Capture, click the information (I) icon next to the Not-Ready APs tab.

Global - enable all capable APs

Allows you to enable the Anomaly Capture for all capable APs.


View RF Statistics and Manage Spectrum Analysis Data for an Access Point

Use this procedure to view RF statistics and start and manage Spectrum Analysis data for a specific access point.

Procedure


Step 1

Click the menu icon () and choose Assurance > Health.

The Overall health dashboard appears.

Step 2

Click the Network Health tab.

The Network Health window appears.

Step 3

Do one of the following:

  • From the Network Devices dashlet, click the device name (hyperlinked identifier) for the AP to view the details for the AP.
  • In the Search field (located at the top-right corner), enter the device name, IP address, or MAC address.

A 360° view of the AP appears.

Step 4

In the Device 360 window, click Intelligent Capture at the top-right corner.

The Intelligent Capture: AP Name window appears.

Attention


If a icon with the message GRPC link is not ready (CONNECTING) appears next to the AP name, see Client or Access Point Unable to Send Intelligent Capture Data to Cisco DNA Center for more details.

Step 5

Click the RF Statistics tab to view details about RF statistics.

Note


If AP Stats Capture has not been enabled, enable it. See Enable and Manage Intelligent Capture for an Access Point.

Step 6

In the RF Statistics tab you can do the following:

  1. Use the timeline to view the RF statistics for a given time and specify the scope of the data:

    Timeline Slider
    Item Description

    1 hour drop-down list

    Click the drop-down list and select a duration to set the range of the timeline. Options are 1 hour, 3 hours, and 5 hours. Default is 1 hour.

    Timeline Slider

    The timeline slider determines the time window of all data displayed. The timeline slider is color-coded to display the health of the AP. You can hover your cursor at a specific time to see details such as the device health score, system resources, and data plane.

    To adjust the timeline to a different time window, click the < and > buttons to the desired time window.

    For more customization of the timeline range, click and drag the boundary lines.

  2. Use the radio frequency selector under the timeline to filter the data that appears in the dashlets based on the frequency bands. Click the drop-down list and select Radio 0 (2.4 GHz or 5 GHz) or Radio 1 (5 GHz).

    Note

     
    If APs have three radios, the drop-down list provides the following options: Radio 0 (2.4 GHz), Radio 1 (5 GHz), or Radio 2 (5 GHz).
  3. Use the dashlets to view the RF statistics details:

    Note


    You can do the following in the charts that are displayed in the dashlets:

    • Hover your cursor over the charts to view details.

    • Click and drag within the chart to zoom in on a period. To change the view to the default, click .

    • Click the color-coded data types below the chart to disable or enable the data type that is displayed in the chart.

    Dashlets Description

    Clients dashlet

    Displays the number of clients using the AP. The data source is from the AP WLAN statistics.

    Top Clients with Tx Failed Packets by SSID dashlet

    Displays the list of SSIDs in the table. The data source for the table is from the AP WLAN statistics. The data source for the bar chart is from AP client statistics.

    Select an SSID to see the top clients with transmit failed packets for that SSID.

    Channel Utilization dashlet

    Displays the channel utilization percentage used by the AP and other wireless and non-wireless devices. The data source for the bar chart is from AP Radio Statistics.

    Channel Utilization by this Radio dashlet

    Displays the current channel utilization percentage used by the AP and a list of SSIDs, the number of clients connected to it, and the number of packets sent or received over the last 15 minutes for its clients.

    The data source for the table is from the AP WLAN statistics. The data source for the circle chart is from AP radio statistics.

    Frame Count dashlet

    Displays the number of management and data frames. The data source is from the AP radio statistics.

    Frame Errors dashlet

    Displays the number of transmit and receive errors. The data source is from the AP radio statistics.

    Tx Power and Noise Floor dashlet

    Displays the transmit power and noise floor. The data source is from the AP radio statistics.

    Multicast/Broadcast Counter dashlet

    Displays the multicast and broadcast counts for each SSID. The data source is from the AP WLAN statistics.

Step 7

Click the Spectrum Analysis tab.

Step 8

Click Start Spectrum Analysis to start a spectrum analysis session.

Note

 
  • The spectrum analysis duration is 10 minutes.

  • The maximum number of concurrent spectrum analysis sessions is 20.

Step 9

In the Spectrum Analysis tab you can do the following:

  1. Use the timeline to view the spectrum analysis data for a given time and specify the scope of the data to display:

    Timeline Slider
    Item Description

    1 hour drop-down list

    Click the drop-down list and select a duration to set the range of the timeline. Options are 1 hour, 3 hours, and 5 hours. Default is 1 hour.

    Timeline Slider

    The timeline slider determines the time window of data that is displayed. The timeline slider is color-coded to display the health of the AP. You can hover your cursor at a specific time to see the details, such as the device health score, system resources, and data plane.

    For Spectrum Analysis, the time range is set to a 5-minute window.

    To adjust the timeline to a different time window, click the < and > buttons to the desired time window.

    Note


    The timeline can display data from up to two weeks in the past.

    Click and drag the boundary lines to view data for a specific time.

  2. Use the radio frequency selector under the timeline to filter the data that appears in the charts based on the frequency bands. Click the drop-down list and select Radio 0 (2.4 GHz) or Radio 1 (5 GHz).

    Note

     
    If APs have three radios, the drop-down list provides the following options: Radio 0 (2.4 GHz), Radio 1 (5 GHz), or Radio 2 (5 GHz).

    Note

     
    If Radio Mode and Channel (above the Spectrum Analysis charts) do not display any data, this indicates that the AP has no radios operating on the selected band. This occurs when an AP has both the client serving radios operating on 5 GHz, while the radio frequency selector is set to 2.4 GHz.

    For more details, see About Cisco AP Functionality During Spectrum Analysis.

  3. Use the Spectrum Analysis charts for the following functionality:

    Spectrum Analysis Charts
    Item Description

    Top chart (Persistence)

    This chart provides in real time the amplitude (power) and the channel frequency for each heard signal in the RF environment. The X axis represents the amplitude and the Y axis represents the channel frequency.

    The colors in the chart represent how many signals are heard at the same amplitude and channel frequency within the selected 5-minute time period:

    • Blue indicates a low number of overlapping signals (or signals heard at the same amplitude and frequency).

    • Red indicates a high number of overlapping signals.

    The intensity of the color increases (from blue > green > yellow > orange > red) as more signals are heard. As the lines in the chart overlap and intersect, they change color.

    The transparency of the colors represents the age of the signal data, with older data being more transparent.

    To view the RF environment in real time, click Realtime FFT (Fast Fourier Transform) to enable it. Enabling Realtime FFT limits the persistence chart to display "one" most recent data stream, rather than a collection of data streams from a 5-minute time period.

    To zoom in and view data for a specific range of channels, click and drag your mouse to select the range. The chart refreshes and displays data for the specific channels that you selected.

    To zoom out and view the entire chart, click the magnifying glass on the top-right corner.

    Bottom chart (Waterfall)

    This chart provides a time-wise interpretation of data. The chart provides the same information as the Persistence chart but in a different format. The X axis shows the time and the Y axis shows the channel frequency. The lines in the chart represent the exact order in which the events have occurred, which can enable you to troubleshoot the root cause if a problem occurs.

    The colors in the chart represent the amplitude. Blue indicates a low value (-100 dBm) and red indicates a high value (-20 dBm).

  4. Use the Interference and Duty Cycle chart to view the following:

    • Detected interference and its severity:

      • Interference is plotted as a circle where the radius represents the bandwidth of the interference. The X axis represents the frequency in which the interference was heard on and the Y axis represent the severity.

      • Severity measures the impact of the interference and the range. Range is from 0, which indicates no impact, to 100, which indicates a huge impact.

      • The interference type is determined by its RF signature, which is identified by Cisco CleanAir Technology.

    • The duty cycle of each channel.


About Cisco AP Functionality During Spectrum Analysis

The Cisco Aironet 2800 Series, 3800 Series, and 4800 Series Access Points (APs) have dual band radios with flexible radio assignment (FRA) in slot 0. This FRA radio operates on 2.4 GHz, but can be assigned to operate on 5 GHz. Its mode can be changed to differ from the AP's operational mode. When you configure the AP's FRA radio to operate in 5 GHz, no client radios can operate in 2.4 GHz band.


Note


Spectrum Analysis is not supported on the Aironet 1540 AP, Aironet 1800 Series APs, and Catalyst 9115 AP.


Note


Verify that the APs have the correct software version installed. See the Supported Cisco APs table in the Supported Devices for Intelligent Capture topic.


Radio slot assignments for spectrum analysis are as follows:

Device Model Spectrum Analysis Radio Slot Assignment

Aironet 2800 Series APs

Aironet 3800 Series APs

Aironet 1560 APs

Catalyst IW6300 Heavy Duty Series APs

Catalyst IW6300 Heavy Duty Series APs

Radio slots 0 and 1 are enabled.

Aironet 4800 Series APs

Catalyst 9120 AP

Catalyst 9130 APs

These APs have three radio slots.

If data packet capture is running, radio slots 0 and 1 are enabled.

If data packet capture is not running, radio slot 2 is enabled.

Note


AP spectrum analysis data is not displayed for the 2.4 GHz channel band. Also, if there is no AP radio serving the 2.4 GHz band, the Radio Mode and Channel fields are empty. This occurs if the FRA radio is set to operate in 5 GHz and packet capture is enabled.

Troubleshoot Intelligent Capture

Client or Access Point Unable to Send Intelligent Capture Data to Cisco DNA Center

Problem: Client or access point is unable to send Intelligent Capture data to Cisco DNA Center. The warning () icon appears with the message GRPC link is not ready (CONNECTING):

Background: In order for APs to send Intelligent Capture data to Cisco DNA Center, the Intelligent Capture port number on the eWLC or WLC must be set to 32626. Typically, when the eWLC or WLC is discovered by Cisco DNA Center, the port number is automatically set to 32626.

However, there are some upgrade paths for Cisco DNA Center that can cause the port number from being properly set.

Solution: To resolve this issue, do the following:

  1. Check that the eWLC or WLC has the Intelligent Capture server port number is set to 32626.

  2. If the port number is not set to 32626, manually set it.