About Network
A network consists of one or more devices, including routers, switches, wireless controllers, and access points.
The documentation set for this product strives to use bias-free language. For the purposes of this documentation set, bias-free is defined as language that does not imply discrimination based on age, disability, gender, racial identity, ethnic identity, sexual orientation, socioeconomic status, and intersectionality. Exceptions may be present in the documentation due to language that is hardcoded in the user interfaces of the product software, language used based on RFP documentation, or language that is used by a referenced third-party product. Learn more about how Cisco is using Inclusive Language.
A network consists of one or more devices, including routers, switches, wireless controllers, and access points.
Use this procedure to get a global view of your network and to determine if there are potential issues that must be addressed.
A network consists of one or more devices, including routers, switches, wireless controllers, and access points.
 Note |
The network health score exists only in the context of a location. If the location of a device is not available, it is not counted in the network health score. |
Configure Assurance. See Basic Setup Workflow.
|
Step 1 |
Click the menu icon ( The Overall health dashboard appears. |
||||||||||||||||||
|
Step 2 |
Click the Network tab. The Network health dashboard appears. 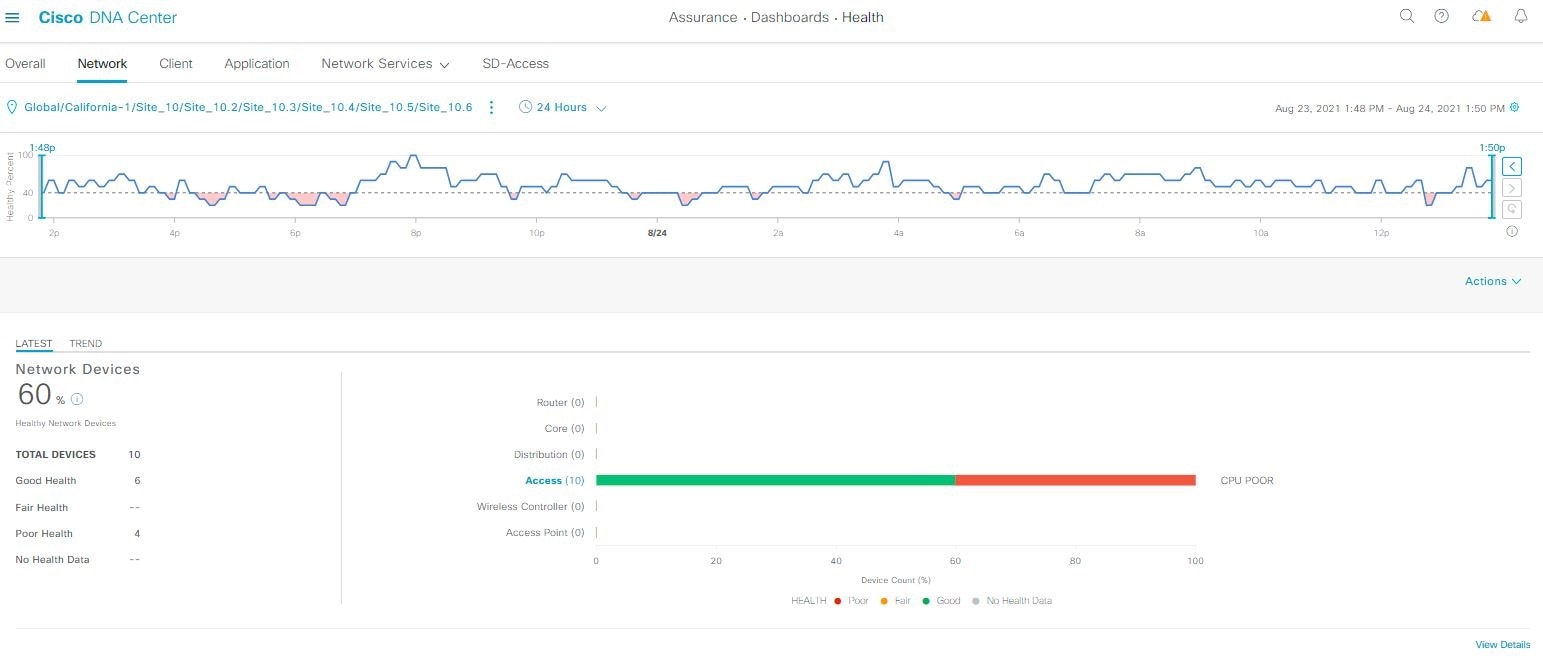
|
||||||||||||||||||
|
Step 3 |
Click the location option ( |
||||||||||||||||||
|
Step 4 |
Click The location pane has the following functionality:
|
||||||||||||||||||
|
Step 5 |
Click the time range setting (
|
||||||||||||||||||
|
Step 6 |
Click the Actions drop-down list in the top menu bar for the following functionality:
|
||||||||||||||||||
|
Step 7 |
Use the Network Health timeline for the following functionality. You can specify a more granular time range. You can click and drag the timeline boundary lines to specify the time range. This sets the context for the custom charts on the dashboard. You can use the arrow buttons on the right of the timeline to view data for up to 30 days. Hover your cursor within the timeline chart to view the network device health score percentage at a specific time. The dotted horizontal line represents the threshold for a healthy network, which by default is set to 40%. To change the threshold value:
|
||||||||||||||||||
|
Step 8 |
Use the Network Devices Health Summary dashlet for the following functionality:
|
||||||||||||||||||
|
Step 9 |
Use the AP dashlets to view the following information:
|
||||||||||||||||||
|
Step 10 |
Use the Network Devices dashlet for the following functionality:
|
||||||||||||||||||
|
Step 11 |
Use the Network Devices Reachability dashlet to view the following information:
|
||||||||||||||||||
|
Step 12 |
Use the WAN Link Utilization dashlet to view the following information:
|
||||||||||||||||||
|
Step 13 |
Use the WAN Link Availability dashlet to view the following information:
|
||||||||||||||||||
Use this procedure to view details about a specific device and determine if there are potential issues that must be addressed.
|
Step 1 |
Click the menu icon ( The Overall health dashboard appears. |
||||||||||||||||||||||||||||||||
|
Step 2 |
Click the Network tab. |
||||||||||||||||||||||||||||||||
|
Step 3 |
In the Network health dashboard, do one of the following:
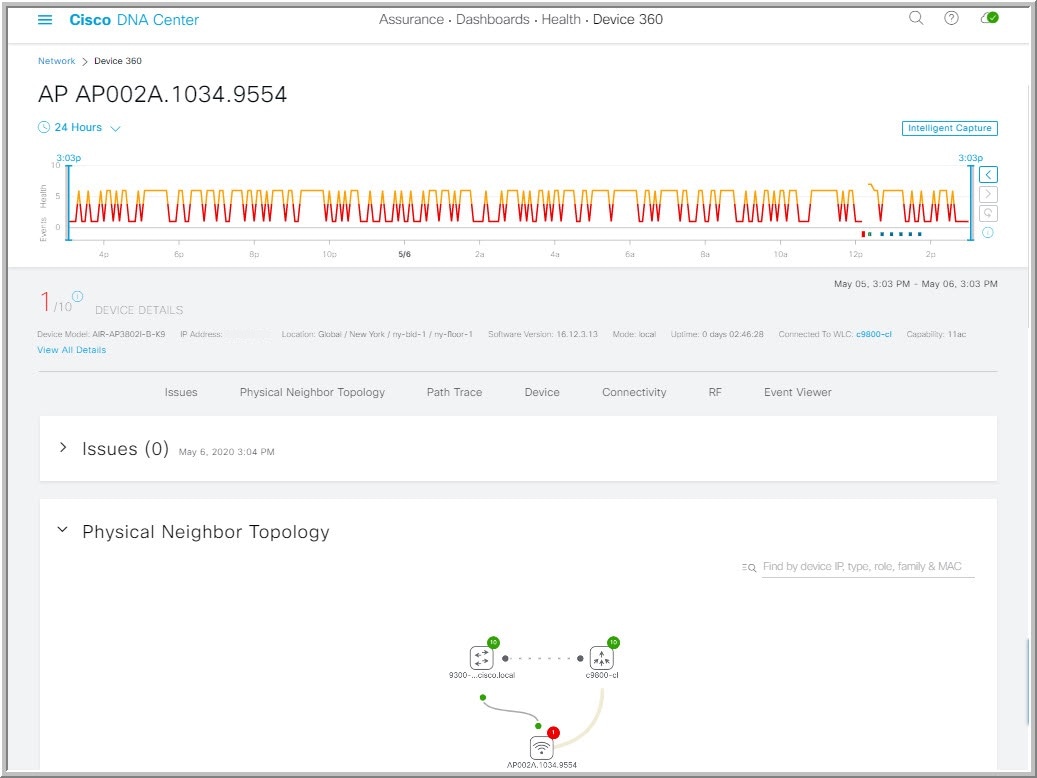
The Device 360 window displays a 360° view of the network device.
|
||||||||||||||||||||||||||||||||
|
Step 4 |
Click the time range setting (
|
||||||||||||||||||||||||||||||||
|
Step 5 |
Click Intelligent Capture to view, monitor, and troubleshoot captured onboarding and data packets for a specific network device and to determine if there are potential issues that must be addressed. See View RF Statistics and Manage Spectrum Analysis Data for an Access Point.
|
||||||||||||||||||||||||||||||||
|
Step 6 |
Use the timeline slider to view the health and events information about the network device over a period of time. The timeline slider has the following functionality:
|
||||||||||||||||||||||||||||||||
|
Step 7 |
You can view the device's health score in the Device Details area, below the timeline. The details for the device's health score are as follows:
The color of the health score represents its severity. The health is measured on a scale of 1 to 10, where 10 is the best score. A score of 0 indicates that data could not be obtained.
|
||||||||||||||||||||||||||||||||
|
Step 8 |
Use the Device Details area, below the timeline, to view the most current information about the device, such as the building and floor where the device is located, the device model, IP address, software version installed on the device, device role, HA status, the IP address or MAC address, and the uptime.
|
||||||||||||||||||||||||||||||||
|
Step 9 |
Click View All Details in the Device Details area to open a slide-in pane that displays additional attributes of a device, such as general information, network information, and rack location. |
||||||||||||||||||||||||||||||||
|
Step 10 |
Use the Issues category to view issues that must be addressed. Issues are listed based on the timestamp. The most recent issue is listed first. Click an issue to open a slide-in pane to view the corresponding details, such as the description of the issue, impact, and suggested actions. From the slide-in pane, you can do the following:
|
||||||||||||||||||||||||||||||||
|
Step 11 |
Use the Physical Neighbor Topology category to view the topology of the device and how that device is connected to neighboring devices. You can do the following:
|
||||||||||||||||||||||||||||||||
|
Step 12 |
Use the Event View category to view an audit trail of events for the device. The Event Viewer table provides information about the issue such as the reason code and the time stamp when the event occurred. Click an event to view details about that event in the right pane.
|
||||||||||||||||||||||||||||||||
|
Step 13 |
Use the Path Trace category to run a path trace. Click Run New Path Trace to display a network topology between a specified source device and a destination device. The topology includes the path's direction and the devices along the path, including their IP addresses. The display also shows the protocol of the devices along the path (Switched, STP, ECMP, Routed, Trace Route) or other source type. See Perform a Path Trace. |
||||||||||||||||||||||||||||||||
|
Step 14 |
Click the Application Experience category to view the running applications in your network. To view the metrics in a chart format, click the radio button next to an application. A slide-in pane opens with the relevant information. See About Application Experience and Application Visibility and View Application Experience of a Host.
|
||||||||||||||||||||||||||||||||
|
Step 15 |
Use the Detail Information category to view the device's historical KPIs performing over a period of time. Click the following tabs to view the respective details:
|
||||||||||||||||||||||||||||||||
|
Step 16 |
To compare the health of AP radios across the floor in a building, click the toggle button in the top-right corner to switch between Map View and Map and Comparison View. Map and Comparison View displays a floor map with the AP radios placed on it. |
||||||||||||||||||||||||||||||||
|
Step 17 |
From the View Floor drop-down list, choose the floor on which you want to compare the AP radios. Hover your cursor over the AP icon on the floor map to view the device details of an AP radio, such as MAC Address, Model, Mode, and Issue Count. |
||||||||||||||||||||||||||||||||
|
Step 18 |
Click Compare AP Radios to compare the AP radios on the floor map. The Map View appears by default, showing the last 5 minutes of AP radio data. |
||||||||||||||||||||||||||||||||
|
Step 19 |
Click the AP icon on the floor map. A dialog box appears to select or deselect the radios for comparison. |
||||||||||||||||||||||||||||||||
|
Step 20 |
Check the check boxes next to the list of radios that you want to compare on a floor.
|
||||||||||||||||||||||||||||||||
|
Step 21 |
Use AP Radio Comparison to view the list of AP radios selected for comparison. You can compare Radio, IP Address, Model, Uptime, Connected to WLC, and Floor. |
||||||||||||||||||||||||||||||||
|
Step 22 |
Use Comparative Metrics to view the comparative metrics for the selected KPIs. |
||||||||||||||||||||||||||||||||
|
Step 23 |
From the Select KPI drop-down list, choose the KPIs for which you want to see the comparative matrices. You can select from the following KPIs:
|
||||||||||||||||||||||||||||||||
|
Step 24 |
Click the toggle button to switch between Map View and Table View. The Access Point Radios table view lists the AP radios. |
||||||||||||||||||||||||||||||||
|
Step 25 |
Check the check box next to the AP radios that you want to compare on a floor map. |
||||||||||||||||||||||||||||||||
|
Step 26 |
To remove all radios from the comparison in the AP Radio Comparison area, click Clear Selection. |
||||||||||||||||||||||||||||||||
|
Step 27 |
Click Exit Comparison to exit. |
The following tables provide the selected list of syslog messages, less than Critical level (Error, Warning, Notice, and Info), that are displayed in the Event Viewer from the Device 360 window:
| Protocol Events | Layer 2 Events |
|---|---|
|
OSPF-5-ADJCHG IFDAMP-5-UPDOWN BGP-5-ADJCHANGE DUAL-5-NBRCHANGE BGP-5-ADJCHANGE-bfd CLNS-5-ADJCHANGE LDP-5-NBRCHG-TDP LDP-5-NBRCHG-LDP CDP-4-NATIVE_VLAN_MISMATCH LISP-4-LOCAL_EID_RLOC_INCONSISTENCY LISP-4-LOCAL_EID_NO_ROUTE LISP-4-CEF_DISABLED LISP-4-LOCAL_EID_MAP_REGISTER_FAILURE LISP-4-MAP_CACHE_WARNING_THRESHOLD_REACHED |
SW_MATM-4-MACFLAP_NOTIF MAC_LIMIT-4-PORT_EXCEED MAC_LIMIT-4-VLAN_EXCEED IGMP-6-IGMP_GROUP_LIMIT SPANTREE-5-ROOTCHANGE UDLD-4-UDLD_PORT_DISABLED PM-4-ERR_DISABLE CDP-4-DUPLEX_MISMATCH LINK-5-CHANGED PORT-5-IF_DOWN PORT-5-IF_UP |
| Hardware Platform Events |
|---|
|
SYS-5-CONFIG_I SYS-5-RELOAD SYS-5-RESTART OIR-6-INSCARD OIR-6-REMCARD OIR-SP-6-INSCARD OIR-SP-6-REMCARD PLATFORM_STACKPOWER-6-CABLE_EVENT PLATFORM_STACKPOWER-6-LINK_EVENT PLATFORM_STACKPOWER-4-TOO_MANY_ERRORS PLATFORM_STACKPOWER-4-VERSION_MISMATCH PLATFORM_STACKPOWER-4-UNDER_BUDGET PLATFORM_STACKPOWER-4-INSUFFICIENT_PWR PLATFORM_STACKPOWER-4-REDUNDANCY_LOSS ILPOWER-5-POWER_GRANTED ILPOWER-5-LINKDOWN_DISCONNECT ILPOWER-5-IEEE_DISCONNECT ILPOWER-5-INVALID_IEEE_CLASS ILPOWER-4-LOG_OVERDRAWN ILPOWER-5-CLR_OVERDRAWN |
Cisco StackWise Virtual is a network system visualization technology that allows two physical switches to operate as a single logical virtual switch using a 40-G or 10-G Ethernet connection.
The following table lists the Cisco Catalyst Switches that support StackWise Virtual:
| Device | Minimum Supported IOS-XE Software Version |
|---|---|
|
Cisco Catalyst 9300 Series Switches |
16.11+ |
|
Cisco Catalyst 9400 Series Switches |
16.11+ |
|
Cisco Catalyst 9500 Series Switches |
16.11+ |
Cisco StackWise Virtual has the following known limitations:
After you have configured Cisco StackWise Virtual, the second switch still appears in the inventory, and stops responding because it does not have its own IP address. As a workaround, do the following:
Delete both the switches from the inventory. See Delete a Network Device.
Configure StackWise Virtual. (Configure the two switches into one virtual switch.)
Discover the devices. See Discover Your Network Using an IP Address Range, Discover Your Network Using CDP, or Discover Your Network Using LLDP.
Note |
After StackWise Virtual is discovered, one switch plays the active role, while the other a standby role. Both switches in the stack get associated with one primary management IP address. |
After you remove Cisco StackWise Virtual, the two switches are independent. They both have the same IP address and operate in Dual Active Detection (DAD) state. As a workaround, do the following:
Configure a different IP address on the second switch.
Rediscover the devices. See Discover Your Network Using an IP Address Range, Discover Your Network Using CDP, or Discover Your Network Using LLDP.
The Cisco StackWise technology provides an innovative new method for collectively utilizing the capabilities of a stack of switches. Individual switches intelligently join to create a single switching unit with a 32-Gbps switching backplane. Configuration and routing information is shared by every switch in the stack, creating a single switching unit.
The following devices support Cisco StackWise:
Cisco Catalyst 3650 Series Switches
Cisco Catalyst 3850 Series Switches
Cisco Catalyst 9300 Series Switches
Cisco StackWise has the following known limitations:
Ring status is not displayed in the Device 360 header.
Link Speed information is not provided in the. tab.
Use this procedure to configure the health score settings for network devices. You can customize the health score calculation for network devices by changing the KPI thresholds and specifying the KPIs that are included for the calculation.
|
Step 1 |
Click the menu icon ( The Health Score window appears. |
|
Step 2 |
Click the tab of the network device category to customize its health score calculation settings. The tab displays the KPIs that affect the network device type's health score calculation. |
|
Step 3 |
From the KPI Name column, click the KPI name link. The slide-in pane for the KPI appears. |
|
Step 4 |
Configure the KPI health score settings: |
|
Step 5 |
Click Apply. A confirmation dialog box is displayed. |
A fabric network is a logical group of devices that is managed as a single entity in one or multiple locations. Having a fabric network in place enables several capabilities, such as the creation of virtual networks and user and device groups, and advanced reporting. Other capabilities include intelligent services for application recognition, traffic analytics, traffic prioritization, and steering for optimum performance and operational effectiveness.
Cisco DNA Center allows you to add devices to a fabric network. These devices can be configured to act as control plane, border, or edge devices within the fabric network.
You can create a new fabric site only if IP Device Tracking (IPDT) is already configured for the site. This means that you should have enabled Monitor wired clients while configuring Telemetry settings for the site.
|
Step 1 |
In the Cisco DNA Center GUI, click the Menu icon ( |
|
Step 2 |
In the Fabric Sites tab, click Add fabric site. Alternatively, instead of the first two steps, in the Cisco DNA Center GUI, click the Menu icon and choose . Follow the workflow wizard. |
|
Step 3 |
In the Create a Fabric Site window, click Let’s Do it. |
|
Step 4 |
Select an area, building, or floor to add as a fabric site and click Next. |
|
Step 5 |
(Optional) To designate fabric zones and create scoped subnets, select Yes Setup Zones. To enable a fabric zone, select a fabric site from the network hierarchy displayed. |
|
Step 6 |
Click Next. |
|
Step 7 |
Review the fabric site settings on the Summary window. You can edit any of the fabric site or zone settings here. |
|
Step 8 |
Click Create. |
After you have created a fabric site, you can add devices to the fabric site. You can also specify whether the device should act as a control plane node, an edge node, or a border node.
You can add a new device to the fabric site only if IP Device Tracking (IPDT) is configured for the fabric site.
A device which is assigned the Access role and has been provisioned before enabling IPDT on the site can’t be added to the fabric. Reprovision such devices before adding them to the fabric site. Check the Provision workflow to confirm the status of Deployment of IPDT on the device.
Note |
|
Provision the device if you haven’t already provisioned it:
Click the menu icon (![]() ) and choose
.
) and choose
.
The window displays the discovered devices.
The topology view shows a device in gray color if it has passed the fabric readiness checks and is ready to be provisioned.
If an error is detected during any of the fabric readiness checks, an error notification is displayed on the topology area. Click See more details to check the problem area listed in the resulting window. Correct the problem and click Re-check to ensure that the problem is resolved.
If you update the device configuration as part of problem resolution, ensure that you resynchronize the device information by performing an for the device.
Note |
You can continue to provision a device that has failed the fabric readiness checks. |
|
Step 1 |
Click the menu icon ( |
||||||||
|
Step 2 |
Select the fabric site to add a device. The resulting topology view displays all devices in the network that have been inventoried. In the topology view, any device that is added to the fabric is shown in blue. |
||||||||
|
Step 3 |
Click a device. A slide-in pane displays the following Fabric options:
To configure a device as a fabric-in-a-box, select the Control Plane, Border, and Edge options. To configure the device as a control plane and a border node, select both Control Plane and Border. |
||||||||
|
Step 4 |
Click Add. |
After a device is added to the fabric, fabric compliance checks are automatically performed to ensure that the device is fabric-compliant. The topology displays a device that has failed the fabric compliance check in blue color with a cross-mark beside it. Click See more details on the error notification to identify the problem area and correct it.
For the health score to populate correctly for fabric devices, you must enable the SNMP Collector metrics.
|
Step 1 |
Click the menu icon ( |
|
Step 2 |
Click Collectors. A list of collectors is displayed. |
|
Step 3 |
Click COLLECTOR-SNMP. The COLLECTOR-SNMP window opens. |
|
Step 4 |
Click + Add. The SNMP Configuration dialog box opens. |
|
Step 5 |
Check the check boxes adjacent to all the metrics except QOS. 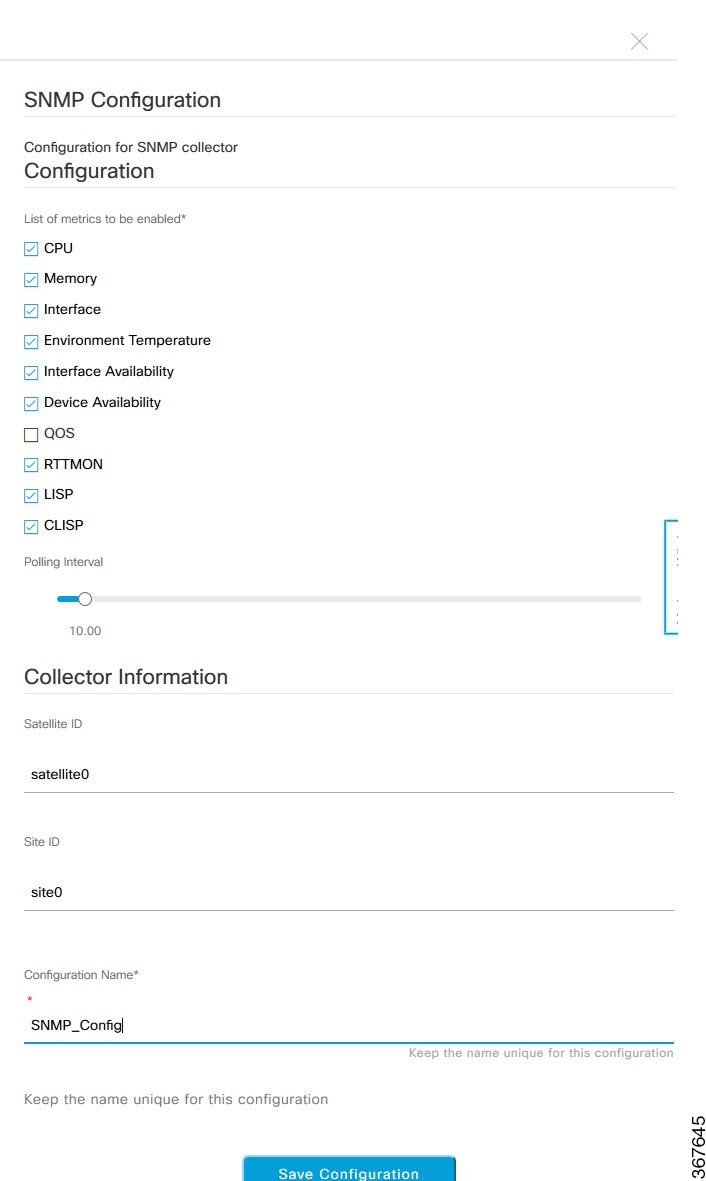 |
|
Step 6 |
In the Configuration Name field, enter a unique name for the SNMP configuration. |
|
Step 7 |
Click Save Configuration. |
This section provides information about how the network health scores and KPI metrics are computed.
The Network Health score is a percentage of the number of healthy network devices (a health score from 8 to 10) divided by the total number of network devices. The score is calculated every 5 minutes.
For example: 90% (health score) = 90 (network devices with health score from 8 to 10) ÷ 100 (total number of network devices)
The Device Category Health score (Access, Core, Distribution, Router, Wireless) is the percentage of the number of healthy network devices (a health score from 8 to 10) in a target category, divided by the total number of network devices in that category. The score is calculated every 5 minutes.
For example: 90% (health score) = 90 (network devices in a target category with health score from 8 to 10) ÷ 100 (network devices in that category)
The Individual Device Health score is the minimum score of following KPI metric health scores: System Health, Data Plane Connectivity, and Control Plane Connectivity. The KPI metric score is based on the threshold that is defined per KPI.
Device Health Score = MIN (System Health, Data Plane Connectivity, Control Plane Connectivity)
Depending on the type of device, the metrics vary.
| System Health | |
|---|---|
| Device Type | Description |
|
Switch (Access and Distribution) |
Includes system-monitoring metrics, such as CPU utilization and memory utilization. |
|
Wireless |
Includes the following system-monitoring metrics:
|
|
Router |
Includes system-monitoring metrics, such as CPU utilization and memory utilization. |
|
Fabric |
Includes system-monitoring metrics, such as CPU utilization and memory utilization. |
| Data Plane Connectivity | |
|---|---|
| Device Type | Description |
|
Switch (Access and Distribution) |
Includes metrics, such as link errors and link status. For switches, the Inter-device Link Availability metric counts physical stack ports, network device-connected links, and fabric edge-facing port channels. |
|
Wireless |
Includes the following metrics:
|
|
Router |
Includes metrics, such as link errors. |
| Control Plane Connectivity | |
|---|---|
| Device Type | Description |
|
Wireless |
Includes the following KPIs:
|
The Switch Health score is the minimum subscore of the following parameters:
| Parameter | Score Calculation | ||||
|---|---|---|---|---|---|
|
CPU Utilization |
|
||||
|
Memory Utilization |
|
||||
|
Link Errors (Rx and Tx) |
Only infrastructure links are considered for link errors. Infrastructure links are topological links between network devices, such as switches, routers, wireless controllers, and APs. If a physical infrastructure interface has errors, the score is 8, if all links are down, it is 1, otherwise it is 10. |
||||
|
Link Discards |
Only infrastructure links are considered for link discards. Infrastructure links are topological links between network devices, such as switches, routers, wireless controllers, and APs. If a physical infra link has packet drops (discards), the score is 8, if all links encounter discards, it is 1, otherwise it is 10. |
||||
|
Link Status |
Only infrastructure links are considered for link status UP/DOWN. Infrastructure links are topological links between network devices, such as switches, routers, wireless controllers, and APs. If a physical infrastructure interface is down, the score is 8, if all interfaces are down, it is 1, otherwise it is 10. |
||||
|
Connection to Control Plane Node—Fabric Devices Only (Edge and Border) |
|
The Router Health score is the minimum subscore of the following parameters:
| Parameter | Score Calculation |
|---|---|
|
CPU Utilization |
|
|
Memory Utilization |
|
|
WAN Connectivity |
|
|
Link Errors |
Only infrastructure links are considered for link errors. Infrastructure links are topological links between network devices, such as switches, routers, wireless controllers, and APs. If a physical infrastructure interface has errors, the score is 8, if all links are down, it is 1, otherwise it is 10. |
|
Link Discards |
Only infrastructure links are considered for link discards. Infrastructure links are topological links between network devices, such as switches, routers, wireless controllers, and APs. If a physical infra link has packet drops (discards), the score is 8, if all links encounter discards, it is 1, otherwise it is 10. |
The AP Health score is the minimum subscore of the following parameters:
| Parameter | Score Calculation |
|---|---|
|
CPU Utilization |
|
|
Memory Utilization |
|
|
Radio Utilization Score |
The score is calculated individually for each radio, and then the average radio score is determined.
|
|
Interference Score |
The score is calculated individually for each radio, and then the average radio score is determined. For 2.4-GHz radio:
For 5-GHz radio:
|
|
RF Noise Score |
The score is calculated individually for each radio, and then the average radio score is determined. For 2.4-GHz radio:
For 5-GHz radio:
|
|
Air Quality Score |
The score is calculated individually for each radio, and then the average radio the score is determined. For 2.4-GHz radio:
For 5-GHz radio:
|
The Wireless Controller Health score is the minimum subscore of the following parameters:
| Parameter | Score Calculation | ||
|---|---|---|---|
|
Memory Utilization |
|
||
|
Free Timer Score |
|
||
|
Free Memory Buffers (MBufs) |
|
||
|
Work Queue Element (WQE) Pool Score |
|
||
|
Packet Pools |
|
||
|
Link Errors |
|
||
|
Connection to Control Plane Node—Fabric Wireless Controllers Only |
|
 ) in the top menu bar to select the site, building, or floor from the Site hierarchy.
 next to the location icon and choose
  toggle button
 for a site or building to display data only for that location on the
  toggle button


 ) in the top menu bar to specify the time range of data that appears on the dashboard.
 ) icon.
 ) icon.
 : Poor network devices. Health score range is 1 to 3.
 : Fair network devices. Health score range is 4 to 7.
 : Good network devices. Health score range is 8 to 10.
 : No Health data. Health score is 0.

 ) to specify the time range of data that is displayed on the window:
 ).
).
 to open a menu where you can add and remove columns for specific data types.
 Feedback