Performing a Path Trace
You can perform a path trace between two nodes in your network. The two nodes may be two hosts and/or Layer 3 interfaces.
 Note |
The path trace application may display accuracy notes. Accuracy notes are red boxes that appears on a node or path segment indicating the accuracy of the computed path as a percentage. Place your cursor over the note to view suggestions of corrective actions to take to improve the path trace accuracy. For example, you may be prompted to enter port values and run the path trace again. |
Before you begin
Make sure that you have devices in your inventory. If not, discover devices using the Discovery function.
Ensure that the controller has SSH or Telnet access to the devices.
Procedure
| Step 1 |
In the Navigation pane, click Path Trace. |
||
| Step 2 |
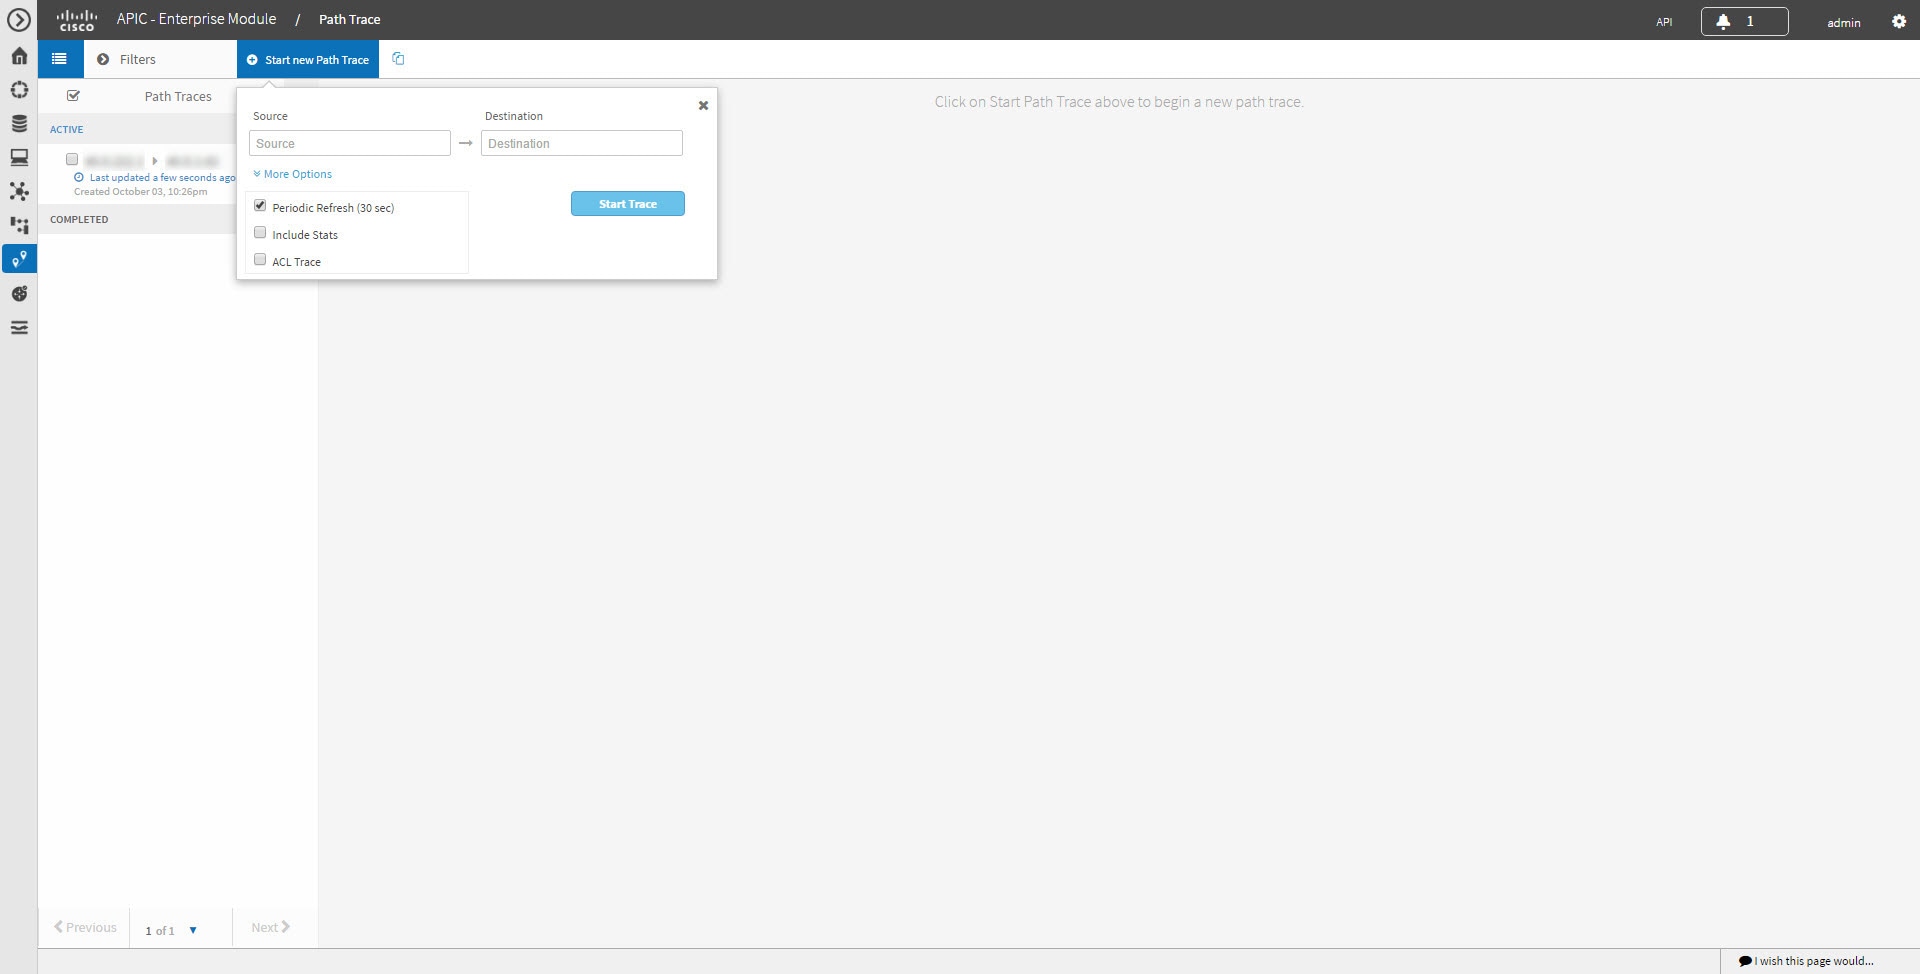
From the path trace toolbar, click Start new Path Trace. |
||
| Step 3 |
In the Source field, enter the IP address of the host or the Layer 3 forwarding interface where you want the trace to start. If you enter the device IP address manually, you need to select the device from the list and then the interfaces for that device. |
||
| Step 4 |
In the Destination field, enter the IP address of the host or Layer 3 forwarding interface where you want the trace to end. You can also enter an IP address of an unmanaged device (called an unknown destination). If you enter the device IP address manually, you need to select the device from the list and then the interfaces for that device. |
||
| Step 5 |
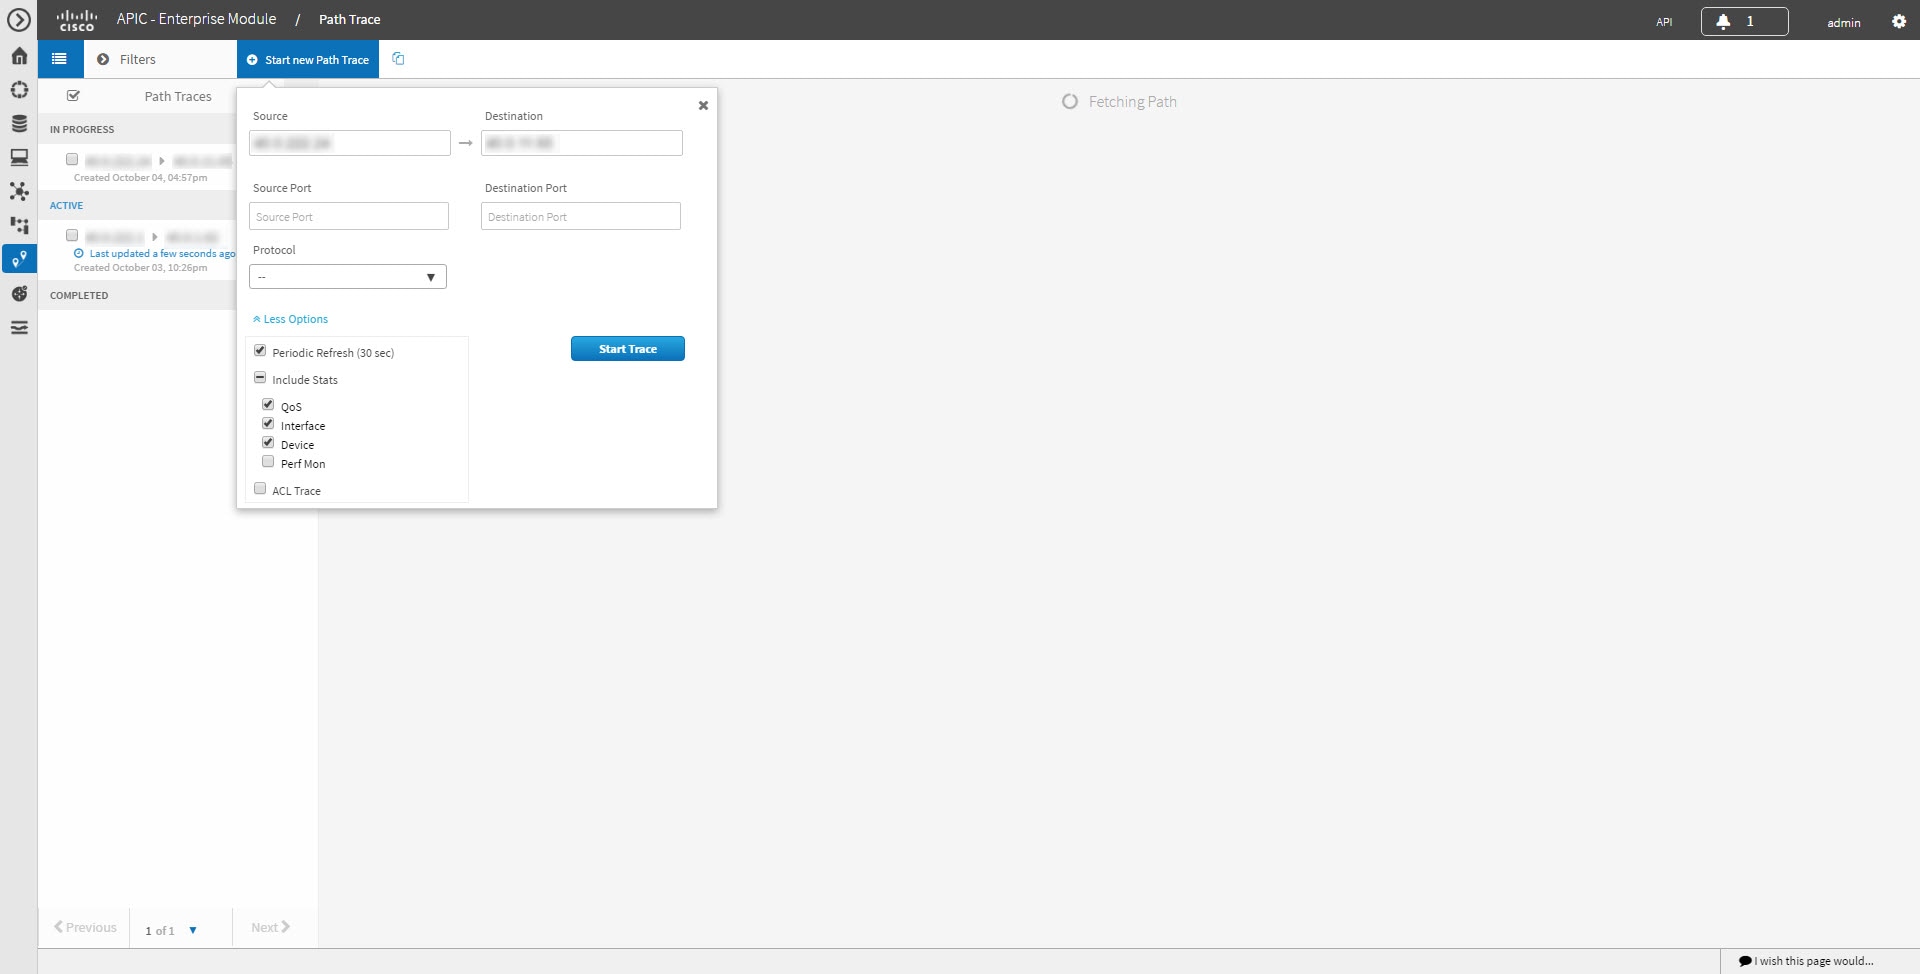
(Optional) To configure source and destination ports or protocols, click More Options. |
||
| Step 6 |
(Optional) In the Source Port field, enter the port number of the host where you want the trace to end. |
||
| Step 7 |
(Optional) In the Destination Port field, enter the port number of the host where you want the trace to end. |
||
| Step 8 |
(Optional) In the Protocol field, choose tcp or udp from the drop-down menu for the Layer 4 path trace protocol. |
||
| Step 9 |
(Optional) To configure the path trace to refresh every 30 seconds, check the Periodic Refresh (30 sec) check box. |
||
| Step 10 |
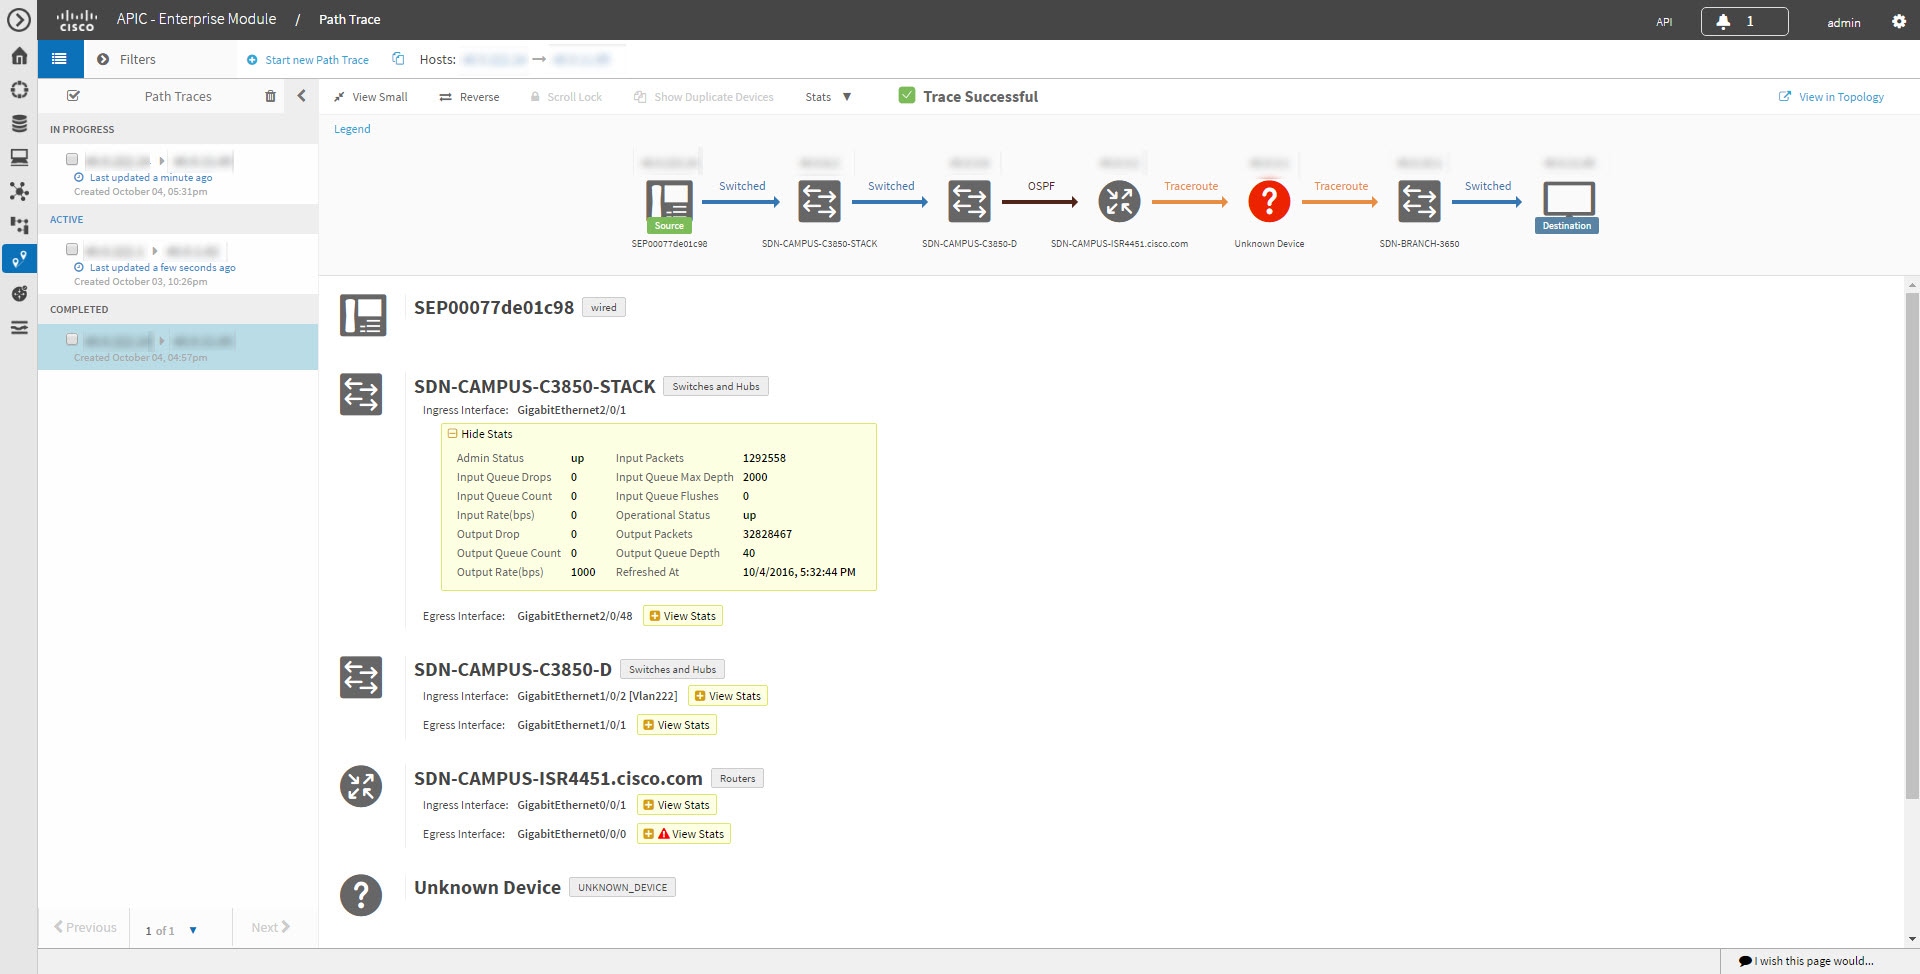
(Optional) To configure the path trace to collect additonal statistics, check the Stats check box and any of the following check boxes, as desired:
|
||
| Step 11 |
(Optional) Select the ACL Trace check box to run an ACL-based path trace. |
||
| Step 12 |
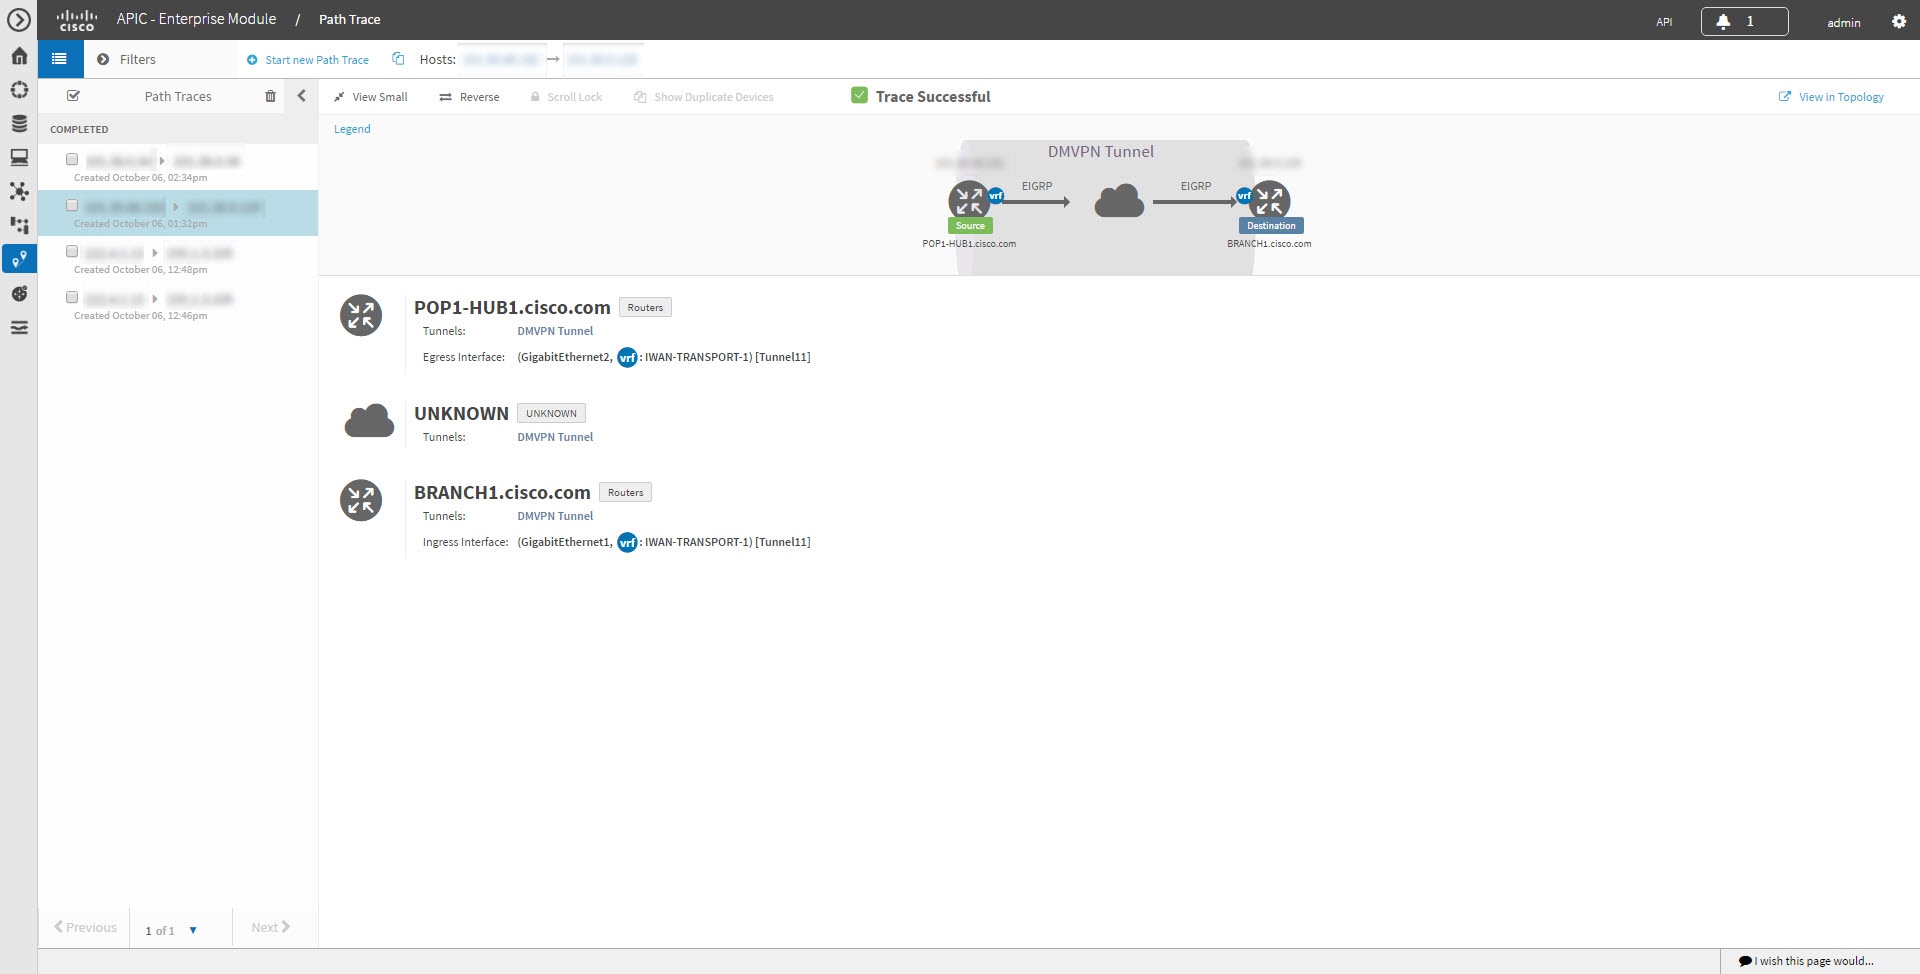
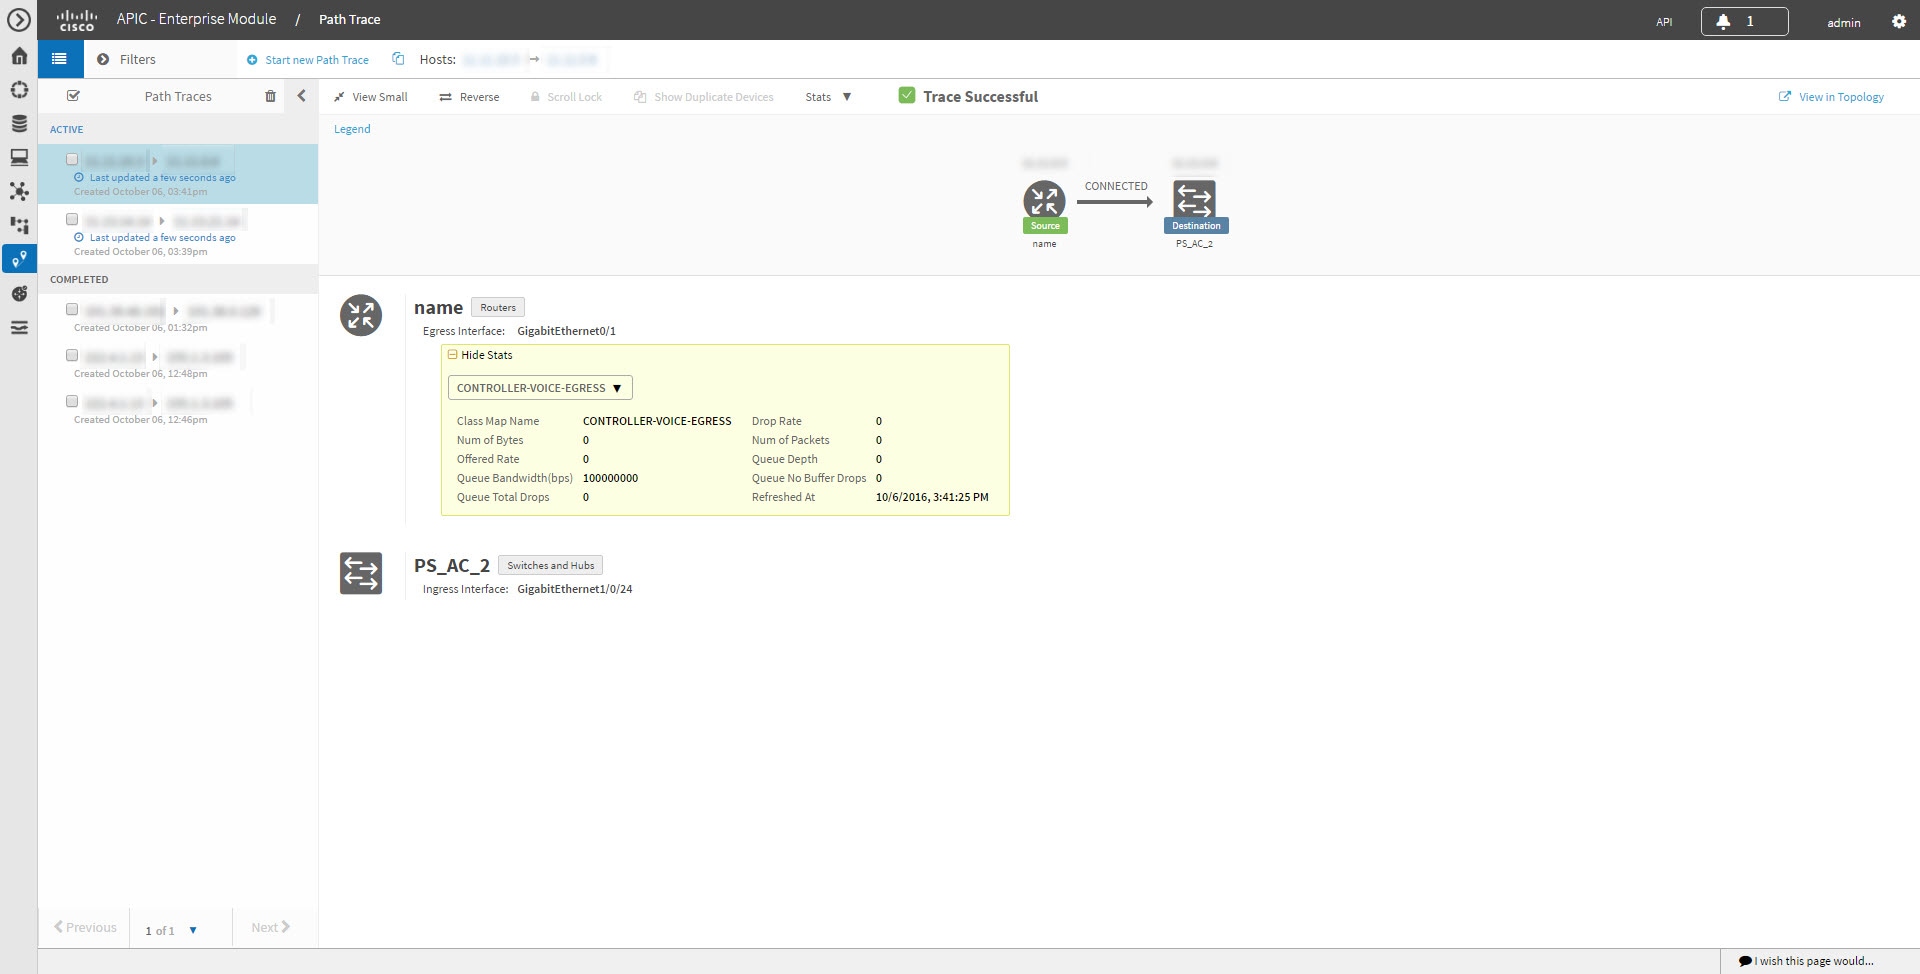
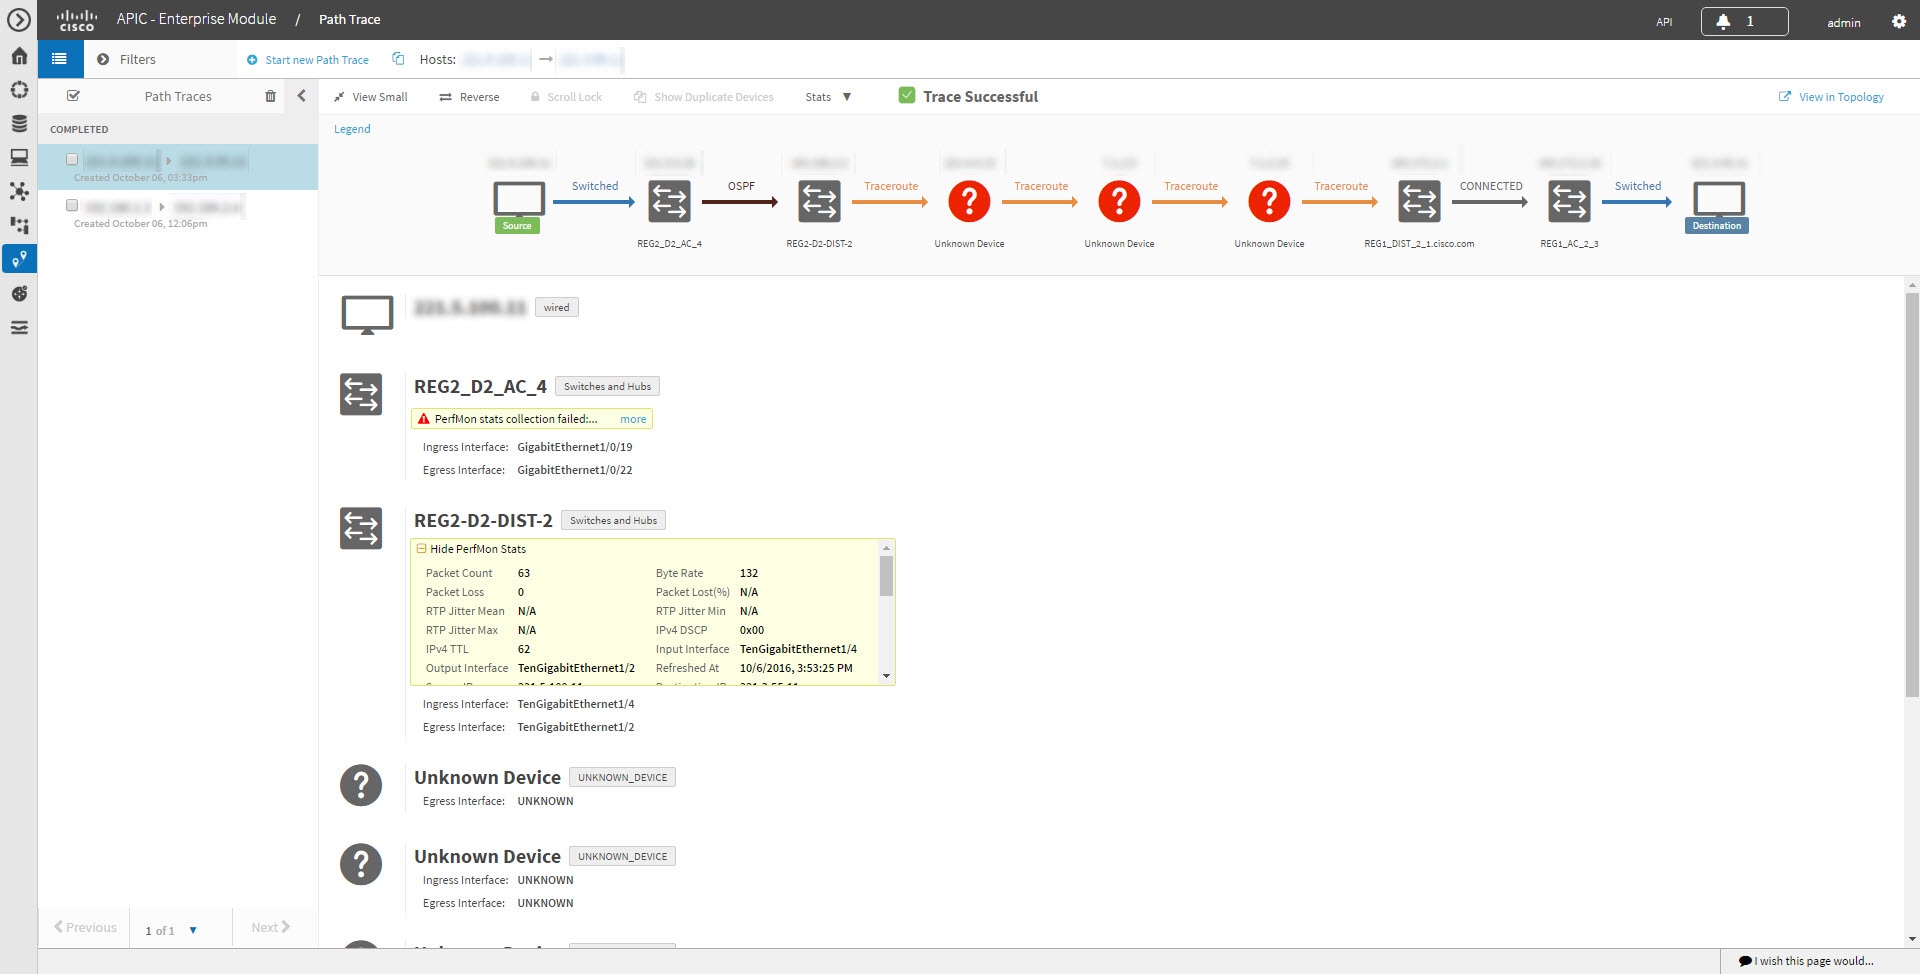
Click Start Trace. Review the path trace output. For more information, see Understanding Path Trace Results. |
||
| Step 13 |
Unless you performed a path trace to an unknown destination, you can view the path trace in the Topology window. To do so, click View in Topology.
|


 Feedback