Cisco Application Policy Infrastructure Controller Enterprise Module Administrator Guide, Release 1.4.x
Bias-Free Language
The documentation set for this product strives to use bias-free language. For the purposes of this documentation set, bias-free is defined as language that does not imply discrimination based on age, disability, gender, racial identity, ethnic identity, sexual orientation, socioeconomic status, and intersectionality. Exceptions may be present in the documentation due to language that is hardcoded in the user interfaces of the product software, language used based on RFP documentation, or language that is used by a referenced third-party product. Learn more about how Cisco is using Inclusive Language.
- Updated:
- February 21, 2017
Chapter: Getting Started
Getting Started
About the Cisco Application Policy Infrastructure Controller Enterprise Module (APIC-EM)
The Cisco Application Policy Infrastructure Controller - Enterprise Module (APIC-EM) is Cisco's Software Defined Networking (SDN) Controller for Enterprise Networks (Access, Campus, WAN and Wireless).
The platform hosts multiple applications (SDN apps) that use open northbound REST APIs that drive core network automation solutions. The platform also supports a number of south-bound protocols that enable it to communicate with the breadth of network devices that customers already have in place, and extend SDN benefits to both greenfield and brownfield environments.
The Cisco APIC-EM platform supports both wired and wireless enterprise networks across the Campus, Branch and WAN infrastructures. It offers the following benefits:
-
Creates an intelligent, open, programmable network with open APIs
-
Saves time, resources, and costs through advanced automation
-
Transforms business intent policies into a dynamic network configuration
-
Provides a single point for network wide automation and control
The following table describes the features and benefits of the Cisco APIC-EM.
|
Feature |
Description |
|---|---|
|
Network Information Database |
The Cisco APIC-EM periodically scans the network to create a “single source of truth” for IT. This inventory includes all network devices, along with an abstraction for the entire enterprise network. |
|
Network topology visualization |
The Cisco APIC-EM automatically discovers and maps network devices to a physical topology with detailed device-level data. The topology of devices and links can also be presented on a geographical map. You can use this interactive feature to troubleshoot your network. |
|
EasyQoS application |
The EasyQoS application abstracts away the complexity of deploying Quality of Service across a heterogeneous network. It presents users with a workflow that allows them to think of QoS in terms of business intent policies that are then translated by Cisco APIC-EM into a device centric configuration. |
|
Cisco Network Plug and Play (PnP) application |
The Cisco Network PnP application is one of the components in the Cisco Network PnP solution. The Cisco Network PnP solution extends across Cisco's enterprise portfolio. It provides a highly secure, scalable, seamless, and unified zero-touch deployment experience for customers across Cisco routers, switches and wireless access points. |
|
Cisco Intelligent WAN (IWAN) application |
The separately licensed IWAN application for APIC-EM simplifies the provisioning of IWAN network profiles with simple business policies. The IWAN application defines business-level preferences by application or groups of applications in terms of the preferred path for hybrid WAN links. Doing so improves the application experience over any connection and saves telecom costs by leveraging cheaper WAN links. |
|
Public Key Infrastructure (PKI) server |
The Cisco APIC-EM provides an integrated PKI service that acts as Certificate Authority (CA) or sub-CA to automate X.509 SSL certificate lifecycle management. Applications, such as IWAN and PnP, use the capabilities of the embedded PKI service for automatic SSL certificate management. |
|
Path Trace application |
The path trace application helps to solve network problems by automating the inspection and interrogation of the flow taken by a business application in the network. |
|
High Availability (HA) |
HA is provided in N+ 1 redundancy mode with full data persistence for HA and Scale. All the nodes work in Active-Active mode for optimal performance and load sharing. |
|
Back Up and Restore |
The Cisco APIC-EM supports complete back up and restore of the entire database from the controller GUI. |
|
Audit Logs |
The audit log captures user and network activity for the Cisco APIC-EM applications. |
Logging into the Cisco APIC-EM
You access the Cisco APIC-EM GUI by entering its network IP address in your browser. The IP address was configured for the Cisco APIC-EM network adapter during the initial setup using the configuration wizard. This IP address connects to the external network.
What to Do Next
Click on each tab and review the data provided in the GUI.
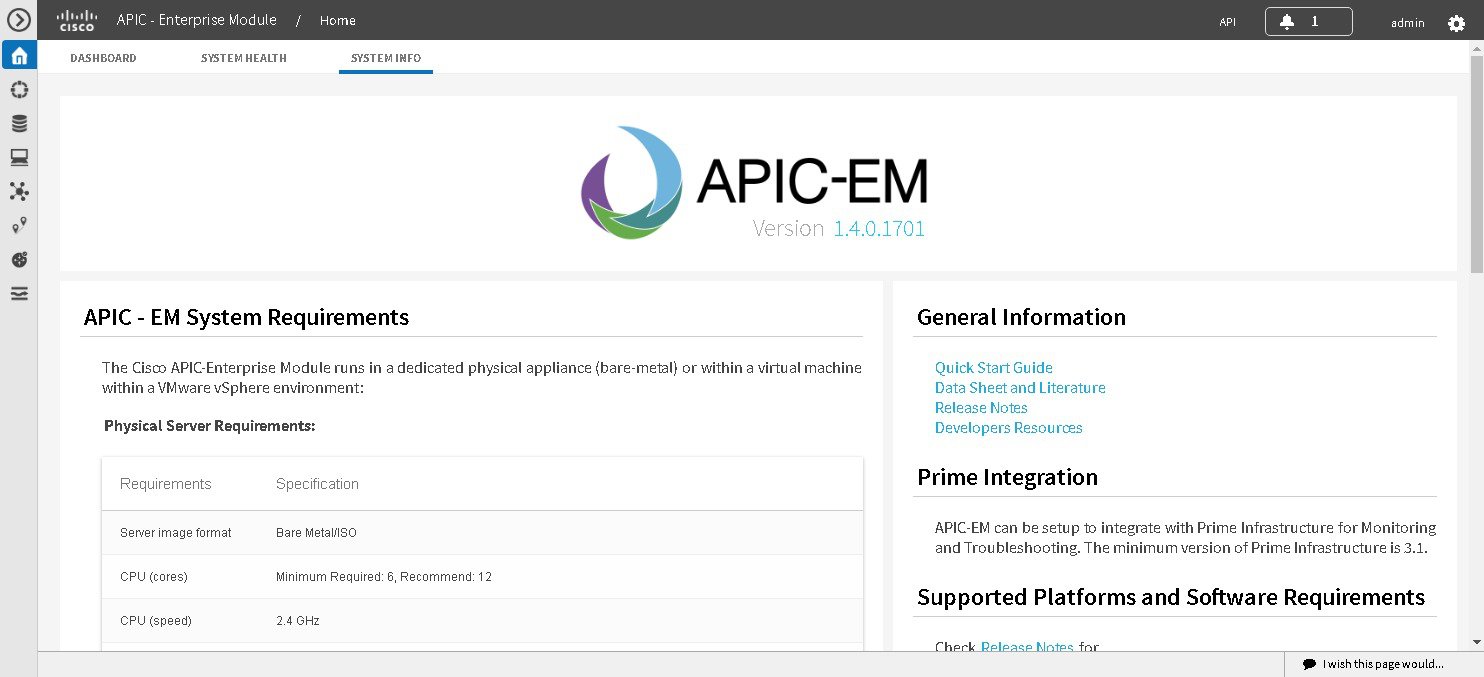
Reviewing the SYSTEM INFO Tab
You can use the SYSTEM INFO tab to access information at a glance about the controller, its system requirements, supported platforms, and other information. The SYSTEM INFO tab is directly accessible from the Home page.
You must have successfully deployed the Cisco APIC-EM and it must be operational.
All users can access the contents of the SYSTEM INFO tab. The SYSTEM HEALTH tab access is limited to users with ROLE_ADMIN privileges and RBAC scope configured to All. The DASHBOARD tab is limited to users with ROLE_ADMIN privileges and RBAC scope configured to All or ROLE_POLICY_ADMIN privileges and RBAC scope configured to All.
For information about user permissions and RBAC scopes required to perform tasks using the Cisco APIC-EM, see "User Settings" in the chapter, "Configuring the Cisco APIC-EM Settings".
Log into the Cisco APIC-EM Home page, as described in the previous procedure.
What to Do Next
Click the datasheet links or Cisco DevNet links for additional information about the controller and access to Cisco DevNet, respectively.
Click the other tabs to review the controller's dashboard and system health.
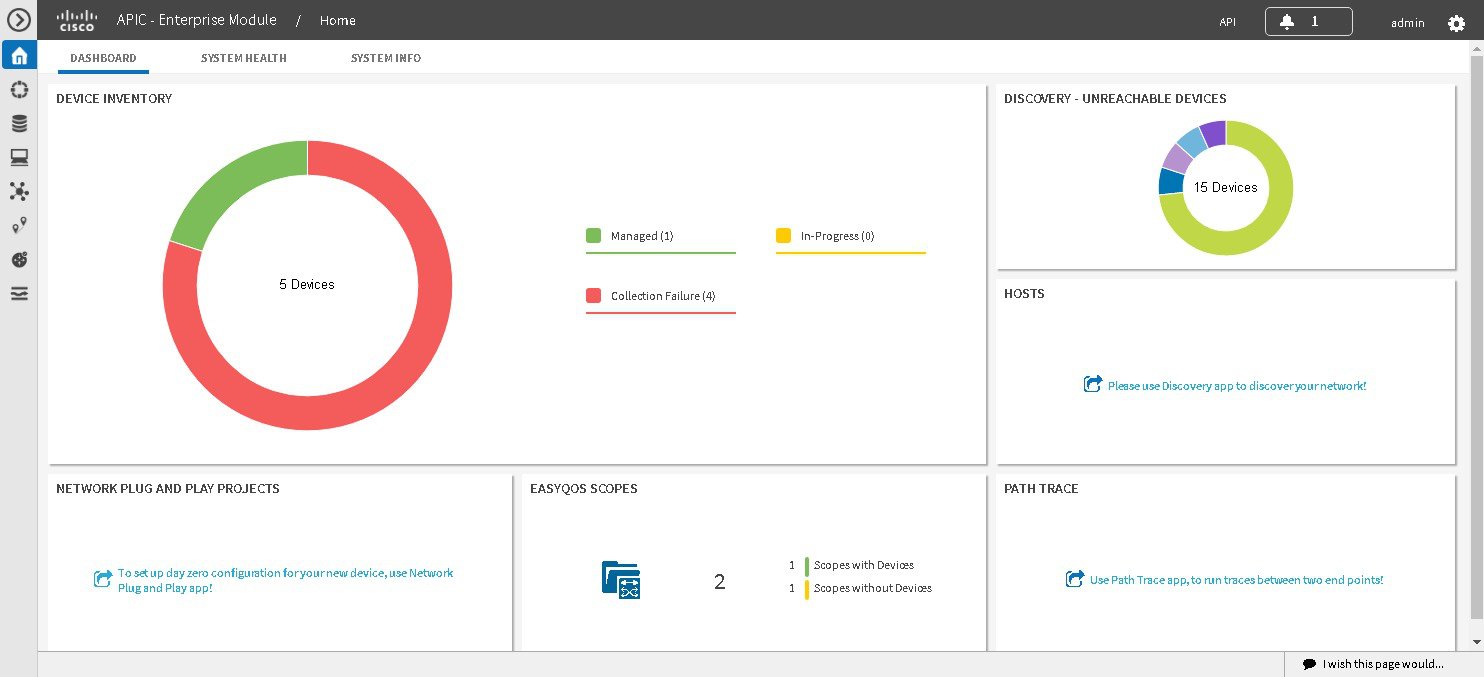
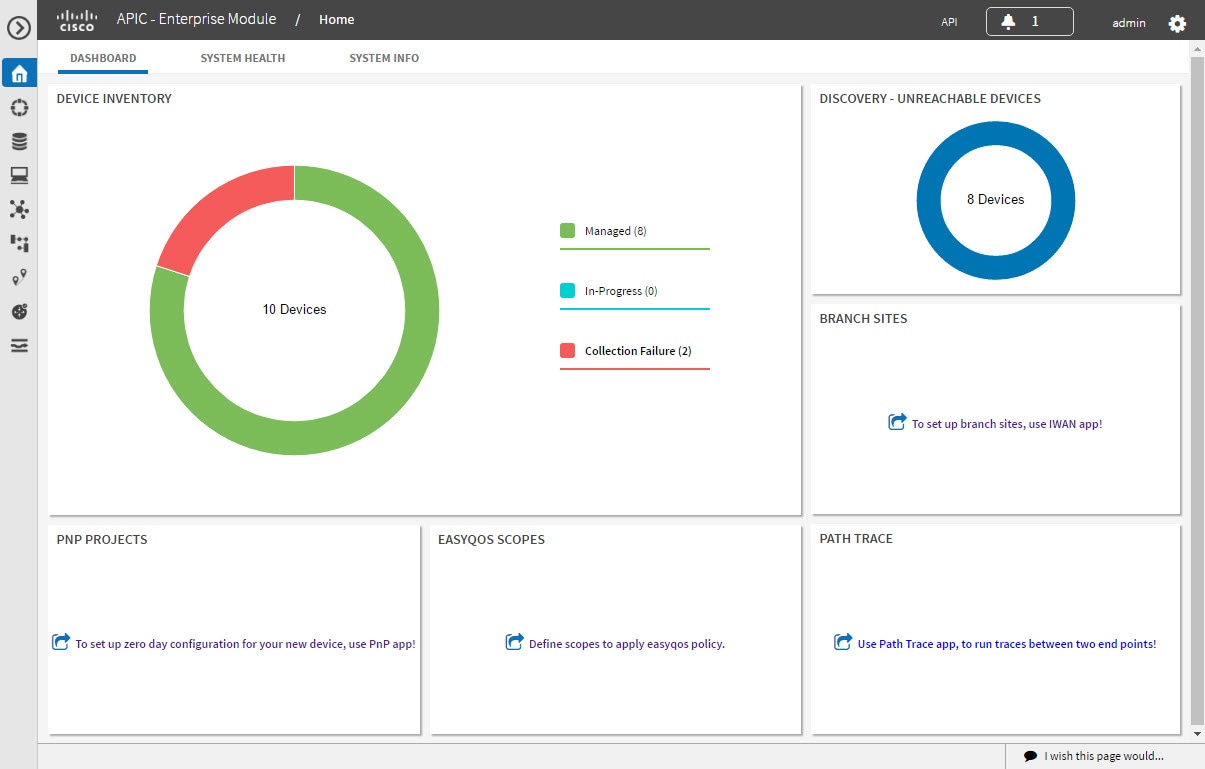
Reviewing the DASHBOARD Tab
You can use the DASHBOARD tab to quickly view graphical displays of key applications on the controller and their operational status. This information can be used to monitor the controller, the network devices that the controller manages, as well as to assist in troubleshooting any problems. The DASHBOARD tab is directly accessible from the Home page.
You must have successfully deployed the Cisco APIC-EM and it must be operational.
All users can access the contents of the SYSTEM INFO tab. The SYSTEM HEALTH tab access is limited to users with ROLE_ADMIN privileges and RBAC scope configured to All. The DASHBOARD tab is limited to users with ROLE_ADMIN privileges and RBAC scope configured to All or ROLE_POLICY_ADMIN privileges and RBAC scope configured to All.
For information about user permissions and RBAC scopes required to perform tasks using the Cisco APIC-EM, see "User Settings" in the chapter, "Configuring the Cisco APIC-EM Settings".
Log into the Cisco APIC-EM Home page, as described in the previous procedure.
What to Do Next
Click the other tabs to review the controller's system health and system information.
Reviewing the SYSTEM HEALTH Tab
You can use the SYSTEM HEALTH tab to quickly view graphical displays of both the basic health of the system and the applications running on the controller. This information can be used to monitor the controller and its applications, as well as to assist in troubleshooting any problems. The SYSTEM HEALTH tab is directly accessible from the Home page.

You must have successfully deployed the Cisco APIC-EM and it must be operational.
All users can access the contents of the SYSTEM INFO tab. The SYSTEM HEALTH tab access is limited to users with ROLE_ADMIN privileges and RBAC scope configured to All. The DASHBOARD tab is limited to users with ROLE_ADMIN privileges and RBAC scope configured to All or ROLE_POLICY_ADMIN privileges and RBAC scope configured to All.
For information about user permissions and RBAC scopes required to perform tasks using the Cisco APIC-EM, see "User Settings" in the chapter, "Configuring the Cisco APIC-EM Settings".
Log into the Cisco APIC-EM Home page, as described in the previous procedure.
| Step 1 | On the
Home page, click the
SYSTEM
HEALTH tab to view information about the health of the basic system
and the applications running on the controller.
The following information is displayed in the SYSTEM HEALTH tab.
| ||||||||
| Step 2 | Place your
cursor over a specific service to view additional information about it.
The following additional information is displayed about the service: | ||||||||
| Step 3 | (Optional)
Click the green-colored addition icon (+) within the service to grow (start up)
an instance of that service for an application.
| ||||||||
| Step 4 | (Optional)
Click the red-colored subtraction icon (-) within the service to harvest (shut
down) an instance of the service for an application.
|
What to Do Next
Click the other tabs to review the controller's dashboard and system information.
Cisco APIC-EM GUI
First GUI Window
When you log into the Cisco APIC-EM, the GUI appears. See the following tables for descriptions of the GUI elements.
|
Name |
Description |
|---|---|
|
Navigation pane |
At the left side of the window, the Navigation pane provides access to the Cisco APIC-EM functions and additional applications, such as EasyQoS, Path Trace, IWAN, and Network Plug and Play. |
|
Global toolbar |
At the top of the window, the Global toolbar provides access to tools, such as API documentation, settings, and notifications. For a full explanation of the icons on the Global toolbar, see the Global Toolbar Options table below. |
|
Application or Function Pane |
In the main window area, the application or function pane displays the interface of the application or function. When you click an option in the Navigation pane or from the Global toolbar, the corresponding application or function opens in this pane. |
|
I wish this page would... feedback link |
At the bottom of the window, the I wish this page would... feedback link opens a preaddressed email in your email application, where you can provide input about your experience using the Cisco APIC-EM and suggestions for improvements. |
Navigation Pane Options
The Navigation pane provides options to access the major Cisco APIC-EM features and applications.
|
Icon |
Name |
Description |
|---|---|---|
 |
Hide/Unhide Navigation |
Allows you to hide and unhide the Navigation pane. |
 |
Home |
Provides information about the APIC-EM, such as its network status, system health, and system information. |
 |
Discovery |
Allows you to configure discovery options for scanning the devices and hosts in your network. |
 |
Device Inventory |
Provides access to the inventory database, where you can display, filter, and sort tabular information about the discovered devices in your network. |
 |
Host Inventory |
Provides access to the inventory database, where you can display, filter, and sort tabular information about the discovered hosts in your network. |
 |
Topology |
Presents the devices and links that the Cisco APIC-EM discovers as a physical topology map with detailed device-level data. The topology of devices and links can also be presented on a geographical map. You can use this interactive feature to troubleshoot your network. |
 |
IWAN |
Simplifies the provisioning of IWAN network profiles with simple business policies. The IWAN application defines business-level preferences by application or groups of applications with preferred paths for hybrid WAN links. Doing so improves the application experience over any connection and saves telecommunication costs by leveraging cheaper WAN links. |
 |
EasyQoS |
Enables you to configure quality of service on previously discovered Cisco network devices that support the EasyQoS feature. Using EasyQoS, you can group devices and then define the business relevance of applications that are used in your network. The Cisco APIC-EM takes your QoS selections, translates them into the proper command line interface (CLI) commands, and deploys them onto the selected devices. |
 |
Path Trace |
Helps to solve network problems by automating the inspection and interrogation of the flow taken by a business application in the network. |
 |
Network Plug and Play |
Provides a highly secure, scalable, seamless, and unified zero-touch deployment experience for customers across Cisco routers, switches and wireless access points. |
Global Toolbar Options
The Global toolbar provides access to API information, administrative functions, system notifications.
|
Icon |
Option |
Description |
|---|---|---|
|
API |
Displays the automatically generated documentation for the northbound REST APIs. |
|
 |
System Notifications |
Opens the System Notifications dialog box, which provides information about system notifications that have occurred. The icons at the top provide a total of the number of notifications in each of the following categories:
If notifications have occurred, they are listed below the icons. For example, any notifications about software updates or security certificates updates appear in this window. Click the Notification History link to open the Notifications window. This window provides information about the notification, such as its severtiy, source, timestamp, and status. You can perform the following actions in this window:
|
|
Administrative Functions |
Opens a menu of options. From this menu, you can choose the following administrative options:
You can perform the following user functions: |
 Feedback