Cisco Service Control Business Intelligence Solution Guide, Release 5.2.x
Available Languages
Table of Contents
Cisco Service Control Business Intelligence Solution Guide, Release 5.2.x
Cisco Service Control Collection Manager Features
Raw Data Records (RDR) on Cisco SCE
Mobile Vendor Specific Attributes (VSA)
Overview
The Cisco Service Control Business Intelligence (BI) solution provides the enhanced analysis and reporting of subscriber network traffic. The infrastructure of the Cisco Service Control BI solution consists of features that enables you to analyze the behavior of subscribers within the network. For example, the traffic analysis can include volume consumption, access patterns, top content providers, and usage trends. The Cisco Service Control BI solution offers tools for trend analysis, traffic comparison, and enhanced data reporting. It also provides ways to access this data over longer periods of time (up to one year).
Within the Cisco Service Control BI solution infrastructure, the Cisco Service Control Engine (Cisco SCE) sends Raw Data Records (RDR) to the Cisco Service Control Collection Manager (CM). The Cisco Service Control Collection Manager then uses software modules to perform various data aggregations and writes the data to an external database (for example, MySQL). The Cisco Insight Reporter processes the data from the database and presents the data in web reports. Figure 1 illustrates the network topology of the Cisco Service Control BI solution.
Figure 1 Cisco Service Control BI Solution Network Topology
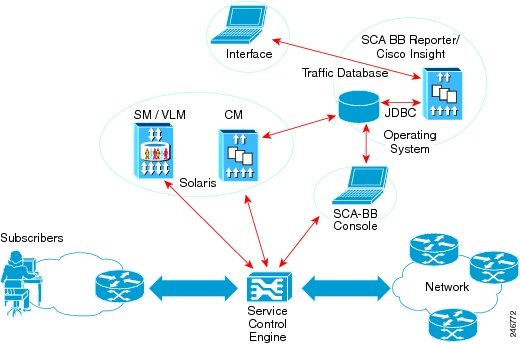
Traffic Database—MySQL, Sybase, or Oracle.
Operating System—Red Hat Linux or CentOS Linux.
For details on Operating Systems and Databases supported by Cisco Insight, see the latest Cisco Insight Reporter User Guide.
Features
The Cisco Service Control BI solution infrastructure generates a large amount of data that needs to be collected, processed, and stored. Reports on this data need to be generated within a reasonable response time to meet user requirements. The need for reporting on both detailed and long-term trends can create challenges. To address these challenges, the Cisco Service Control BI solution provides these features:
Cisco Service Control Collection Manager Features
The Collection Manager uses several complementary features to provide a compromise between level of detail and long-term storage of the data:
Focus on Significant Data
The term ClickStream describes the actual Hypertext Transfer Protocol (HTTP) requests that a particular subscriber triggers. The SCE filters out irrelevant URLs that secondary HTTP requests trigger. The ability to classify HTTP requests as belonging to the ClickStream of the subscriber allows an accurate and effective extraction of the web browsing habits of the subscriber. The ClickStream of the subscriber contains significant data about the access pattern of the subscriber. The ClickStream events make up only 1 to 5 percentage of the total HTTP requests, hence, the quantity of data that requires analysis also reduces.
You can set the volume threshold within the reports based on the ClickStream, and transactions for particular applications that exceed the threshold are filtered out. This filtering significantly reduces the amount of data that requires processing, without compromising accuracy.
Database Table Partitioning
The Collection Manager partitions records of the same type into separate tables within the database. These partitions are calculated according to time-stamp ranges. A rolling window mechanism is then used to delete the oldest partition periodically.
String Removal
Strings require storage space and have limited use in data mining. Eliminating strings frees up space for more storage. The Java Database Connectivity (JDBC) adapter of the Collection Manager can replace strings with empty strings based on the dbtables.xml configuration file. Eliminating strings results in a smaller overall database.
To modify a string field in the configuration file, use the <options> subtag in the <field> tag to overwrite the string with an empty value.
If INFO_String is removed, the following reports become unusable:
- Top Email Account Owners.xml
- Top Email recipients.xml
- Top Email senders.xml
- Top Newsgroups.xml
- Top Subscriber To Newsgroup.xml
- Top Peer-to-Peer (P2P) File Extensions.xml
- Top Session Initiation Protocol (SIP) Domains.xml
If ACCESS_String is removed, the following reports become unusable:
Aggregation of Usage Data
The aggregation process is run for each table as a database stored procedure. Aggregation of usage data significantly reduces memory requirements by freeing space previously used to store more granular data points. Aggregation is disabled by default.
The xUR (where x is a particular type of Usage RDR) table records are displayed over time. With little impact to the overall accuracy of the report, usage data can be aggregated for the following timeframes:
Adaptive Frequency Counts
Long-term trend reports are based on frequency counts, that is, how frequently a host was accessed. Performing frequency counts on an infinite data stream could be a complex computational task. To reduce the complexity of this task, the CM uses an adaptive frequency count method. In this method, the data for each of the most frequent events is aggregated and then stored. You can configure aggregation periods based on hour, day, or week.
Cisco SCE Features
Cisco SCE data classification features include:
- Signature support—Support for over 700 application signatures.
- Zero-day detection—Heuristic approaches for classification of application categories (VoIP, P2P, gaming).
- Protocol packs—Updates the latest protocol signatures to the Signature Engine every two months.
- External signature editor—Signature utility for creating L7 classification.
When a flow does not match a protocol signature, advanced classification mechanisms are used:
- Behavioral classification—Flows of certain application categories usually have a distinct behavioral pattern (sparse or dense, unidirectional or interactive).
- Classification based on recent history—Adjacent flows with similar source or destination are classified together because these flows usually belong to the same application.
- Multistage classification—Accurate classification requires several packets. Therefore, temporary classification is used when immediate policy decision is needed.
Raw Data Records (RDR) on Cisco SCE
SCE platforms running SCA BB generate and transmit Raw Data Records (RDRs) that contain information relevant to the service provider. RDRs contain a wide variety of information and statistics, depending on the configuration of the system. RDRs are transmitted using a Cisco proprietary protocol. This requires you to use the Cisco Service Control Management Suite (SCMS) Collection Manager or to develop software to process the RDRs.
The data in some RDRs can also be exported using the NetFlow reporting protocol. NetFlow reporting allows the SCA BB solution to be more easily integrated with your existing data collectors.
The following are the main categories of RDRs:
- Usage RDRs—Generated periodically. These RDRs contain the state of the usage counters, per service and per accounting scope. There are four types of usage RDRs:
–![]() Link Usage RDRs—Global usage per service, for the entire link.
Link Usage RDRs—Global usage per service, for the entire link.
–![]() Package Usage RDRs—Usage per group of subscribers, per service.
Package Usage RDRs—Usage per group of subscribers, per service.
–![]() Subscriber Usage RDRs—Usage per subscriber, per service. These RDRs are generated for all subscribers. The Cisco Service Control Management Suite (SCMS) Collection Manager (CM) uses these RDRs to generate top-subscriber reports and aggregated usage billing records.
Subscriber Usage RDRs—Usage per subscriber, per service. These RDRs are generated for all subscribers. The Cisco Service Control Management Suite (SCMS) Collection Manager (CM) uses these RDRs to generate top-subscriber reports and aggregated usage billing records.
–![]() Real-Time Subscriber Usage RDRs—Generated for selected subscribers only. The SCMS-CM uses these RDRs by to generate detailed subscriber activity reports.
Real-Time Subscriber Usage RDRs—Generated for selected subscribers only. The SCMS-CM uses these RDRs by to generate detailed subscriber activity reports.
–![]() Zone Usage RDRs—Generated for configured zones, for subscriber usage in that particular zone.
Zone Usage RDRs—Generated for configured zones, for subscriber usage in that particular zone.
- Media RDRs—Generated at the end of every Session Initiation Protocol (SIP), Skype, H.323, Push-to-talk (PTT), Skinny Call Control Protocol (SCCP or Skinny), and Media Gateway Control Protocol (MGCP) media flow.
- Transaction RDRs—Generated for a sample of the flows. These RDRs are used to create statistical histograms such as Top TCP Ports.
- Transaction Usage RDRs—Generated for every flow according to user-defined filters. These RDRs contain detailed Layer 7 information for browsing, streaming, and voice flows. They are used for flow-based billing.
- Real-Time Signaling RDRs—Generated to indicate specific network events such as flow start or end. These RDRs are used to signal external systems to allow real-time actions across the network.
- Malicious Traffic RDRs—Generated to indicate that the SCE platform has detected a traffic anomaly, such as a DDoS attack. These RDRs are used to detect attacks and attackers to mitigate them.
For details on various RDRs, see Cisco Service Control Application for Broadband Reference Guide and Cisco Service Control Application for Broadband User Guide.
Mobile Vendor Specific Attributes (VSA)
Vendor Specific Attributes (VSA) are RADIUS or Diameter attributes that are sent mostly in mobile environments. They can be captured from the traffic processed by the SCE and then reported to the billing server. They can also be sent to the Collection Manager in various RDRs to be used to generate a number of common mobile reports.
VSAs can be captured by either of the following entities:
• RADIUS Login Event Generator (LEG)
Only the VSAs that you select are captured. You can choose which attributes are relevant, and store and process only those attributes. You can select a maximum of 20 attributes from the list of available VSAs. The list of attributes to capture can be modified while the system is running.
For details on Mobile VSA, see the Cisco Service Control Mobile Solution Guide. Appendix B of the guide provides a list of supported Mobile VSAs. Chapter 6, Capturing and Reporting Subscriber Attributes of the guide provides details on capturing and reporting VSAs.
Cisco Insight Features
Cisco Insight Reporter is a software platform based on a web 2.0 user experience standard, designed to collect and present reports, charts, and statistics about the traffic data collected by Cisco SCE devices.
Cisco Insight Reporter is an independent component of the SCA solution, but still has some dependencies on the database schema of the deployed SCA Collection Managers and SCE devices. The Cisco Insight Reporter application should be installed on a dedicated high-end device. However, for small deployments or demos, it could share the same device hosting the Cisco Collection Manager and its database, where traffic data is stored.
Cisco Insight Reporter supports all the previous reports developed for earlier software releases.
Cisco Insight Reporting Tools
Cisco Insight Reporter provides a series of reporting tools that enables you to run interactive reports, save and share report definitions, schedule recurring reports, view and customize a dashboard, and share results. The Report Topics tab in Cisco Insight GUI provides various report topics available on the official Cisco Insight template.
The report topics are organized in various report groups. Table 1 provides details of the report groups.
For a list of all report topics and details on each topic, see the latest Cisco Insight Reporter User Guide.
Reports
Cisco Insight reports are based on concepts such as leading input switch and series comparison, time controller, related reports, drill-down, and personal dashboard. Cisco Insight provides enhanced reports including these:
Subscriber Flows Drill-Down Reports
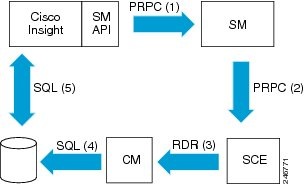
You can drill down through the reports that display the open subscriber flows, that is, display top services, then display subscribers per service, and then display detailed information about a specific subscriber. Figure 2 illustrates the data flow between components during a drill-down to flow-per-subscriber data.

Note![]() The FUR RDRs must be enabled on Cisco SCE to activate the Subscriber Flow drilldown report on Cisco Insight.
The FUR RDRs must be enabled on Cisco SCE to activate the Subscriber Flow drilldown report on Cisco Insight.
The drill-down follows this data flow:
Step 1![]() Upon drill-down to a specific subscriber, Cisco Insight triggers a login operation to the Subscriber Manager (SM) via proprietary remote procedure call (PRPC) over the Subscriber Manager application programming interface (API). The login operation sets the monitor property value.
Upon drill-down to a specific subscriber, Cisco Insight triggers a login operation to the Subscriber Manager (SM) via proprietary remote procedure call (PRPC) over the Subscriber Manager application programming interface (API). The login operation sets the monitor property value.
Step 2![]() The Cisco Service Control Subscriber Manager forwards this update to the Cisco SCE.
The Cisco Service Control Subscriber Manager forwards this update to the Cisco SCE.
Step 3![]() The Cisco SCE generates flow-related RDRs for the subscriber and sends them to the Cisco Service Control Collection Manager.
The Cisco SCE generates flow-related RDRs for the subscriber and sends them to the Cisco Service Control Collection Manager.
Step 4![]() The Cisco Service Control Collection Manager JDBC adapter inserts the flow-related RDRs into the FUR table of the external database.
The Cisco Service Control Collection Manager JDBC adapter inserts the flow-related RDRs into the FUR table of the external database.
Step 5![]() Cisco Insight polls the FUR table in the external database and displays the flow information (Figure 2).
Cisco Insight polls the FUR table in the external database and displays the flow information (Figure 2).
Figure 2 Data Flow of Drill-Down to Flow-Per-Subscriber Using Cisco Insight
Video and HTTP Trend Reports
The Cisco Service Control BI solution includes enhanced reports on Video and HTTP domains:
- Service-related reports—Video service distribution, top Flash video hosts
- Subscriber-related reports—Top video consumers, top browsing consumers
- Provider-related reports—Top video providers, top web hosts
- Trend reports—Changes over time
The SCE sends Video and HTTP TURs to the CM. The CM then routes these TURs to its RAG adapter. The RAG adapter:
- Aggregates these TURs to the domains at the first aggregation level.
- Periodically populates the top domains into a new table in the database schema.
A scheduled database server aggregation job periodically aggregates the first-level aggregation data into the second aggregation level. A reporter queries the database to generate the Video and HTTP trend reports.
Obtaining Documentation and Submitting a Service Request
For information on obtaining documentation, using the Cisco Bug Search Tool (BST), submitting a service request, and gathering additional information, see What’s New in Cisco Product Documentation at: http://www.cisco.com/c/en/us/td/docs/general/whatsnew/whatsnew.html.
Subscribe to What’s New in Cisco Product Documentation, which lists all new and revised Cisco technical documentation as an RSS feed and delivers content directly to your desktop using a reader application. The RSS feeds are a free service.
 Feedback