Monitor Host Resources
Use the Grafana dashboard for monitoring host resources.
Procedure
| Step 1 |
Access the Grafana dashboard using the following URL: Example: |
| Step 2 |
Log in using the credentials used during the installation.
|
| Step 3 |
Select Dashboards > Manage. |
| Step 4 |
Click the cee-data and then select Host Details. 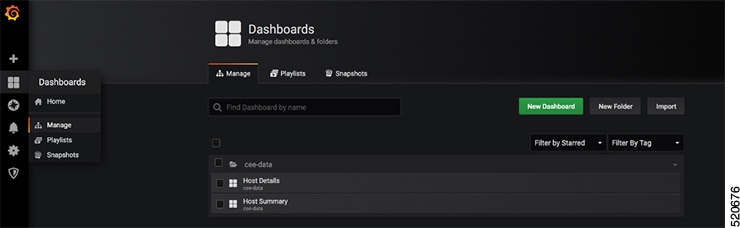 |
| Step 5 |
To view details of CPU, Memory, or Disk usage, select the Host on the top left corner of the screen.
|


 Feedback