Release 6.0: Cisco Vision Director Data Integration Guide
Bias-Free Language
The documentation set for this product strives to use bias-free language. For the purposes of this documentation set, bias-free is defined as language that does not imply discrimination based on age, disability, gender, racial identity, ethnic identity, sexual orientation, socioeconomic status, and intersectionality. Exceptions may be present in the documentation due to language that is hardcoded in the user interfaces of the product software, language used based on RFP documentation, or language that is used by a referenced third-party product. Learn more about how Cisco is using Inclusive Language.
- Updated:
- November 30, 2017
Chapter: Configuring Optional and Advanced Tasks for Data Integration
Configuring Optional and Advanced Tasks
for Data Integration
First Published: August 2, 2012
Last Update: November 15, 2017
This module describes some of the optional and advanced tasks that you can perform for Data Integration in Cisco Vision Director.
This module includes the following topics:
■![]() Modifying the Output Format of a Statistic
Modifying the Output Format of a Statistic
■![]() Modifying the Default Data Throttling Values and Registry Configuration
Modifying the Default Data Throttling Values and Registry Configuration
■![]() Deactivating the Data Integration Application From the Management Dashboard
Deactivating the Data Integration Application From the Management Dashboard
■![]() Viewing Sample Data Versus Real-Time Data
Viewing Sample Data Versus Real-Time Data
Working with Data Views
This section describes how to select and merge content from multiple data sources into a single data view for ingestion into Cisco Vision Director and prepare the content for presentation.
Prerequisites
Before you create a data view, be sure that the following requirements are met:
■![]() The data sources whose content elements you want to combine into a data view are added and configured. For more information, see Overview of Data Integration in Cisco Vision Director.
The data sources whose content elements you want to combine into a data view are added and configured. For more information, see Overview of Data Integration in Cisco Vision Director.
■![]() If you want to select specific elements of the data feed, use the Expression Editor to filter the elements that you want to include or exclude. For more information, see Modifying the Default XPath Expression.
If you want to select specific elements of the data feed, use the Expression Editor to filter the elements that you want to include or exclude. For more information, see Modifying the Default XPath Expression.
Data View Task List
This section includes the following tasks:
■![]() Creating a Data View (required)
Creating a Data View (required)
■![]() Adding Data Sources to the Data View (required)
Adding Data Sources to the Data View (required)
■![]() Enabling the Data View (required)
Enabling the Data View (required)
■![]() Configuring the Data View as a New Data Source (required)
Configuring the Data View as a New Data Source (required)
Creating a Data View
1.![]() From the Control Panel > Setup screen, click Data Integration. The Data Integration screen is displayed in the Data Sources panel view.
From the Control Panel > Setup screen, click Data Integration. The Data Integration screen is displayed in the Data Sources panel view.
3.![]() To create a new data view, click +Add in the Advanced panel. The New data view dialog box is displayed (Figure 1).
To create a new data view, click +Add in the Advanced panel. The New data view dialog box is displayed (Figure 1).
Figure 1 New Data View Dialog Box
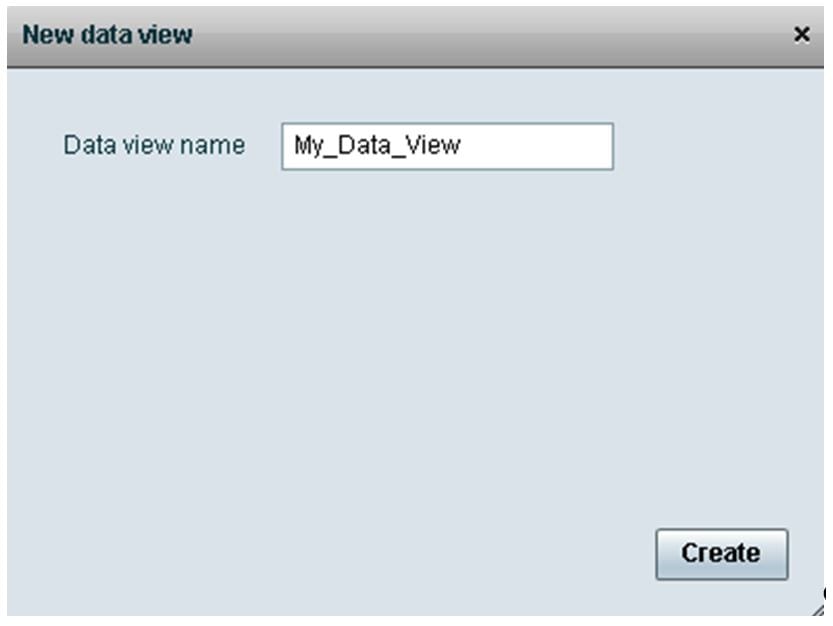
4.![]() In the Data view name box, type the name of the view that you want to create.
In the Data view name box, type the name of the view that you want to create.
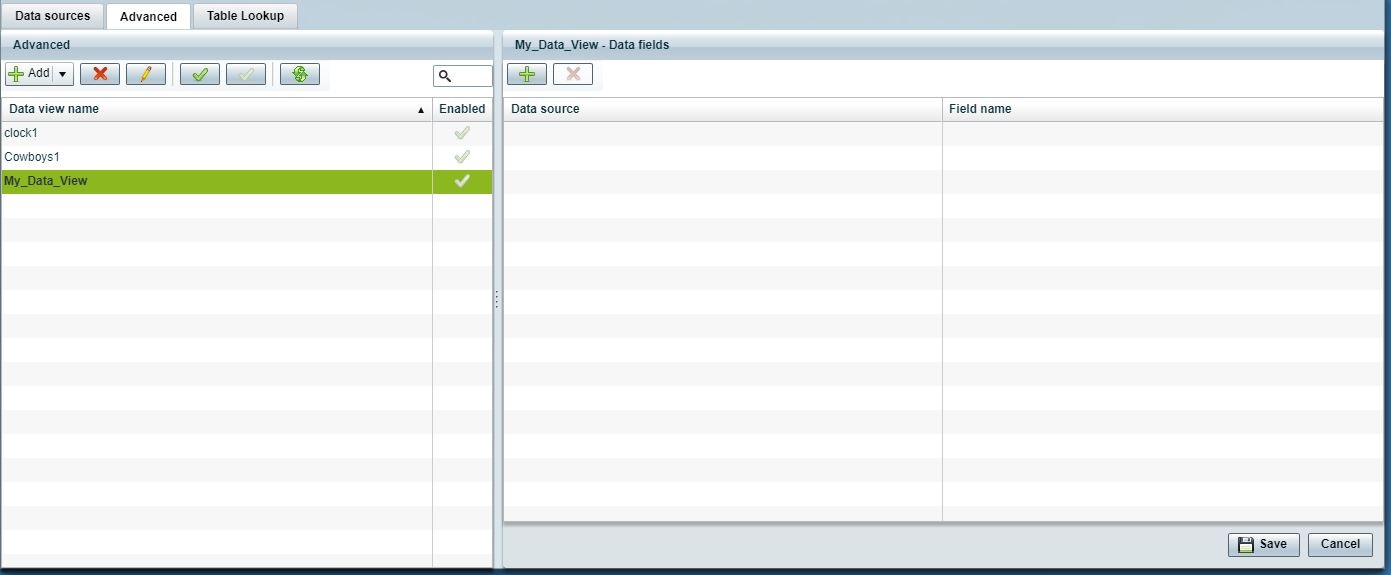
5.![]() Click Create. The new data view is added to the list of Data view names (Figure 2).
Click Create. The new data view is added to the list of Data view names (Figure 2).
Adding Data Sources to the Data View
Any data source type can be added to a data view.
To add data sources to the data view:
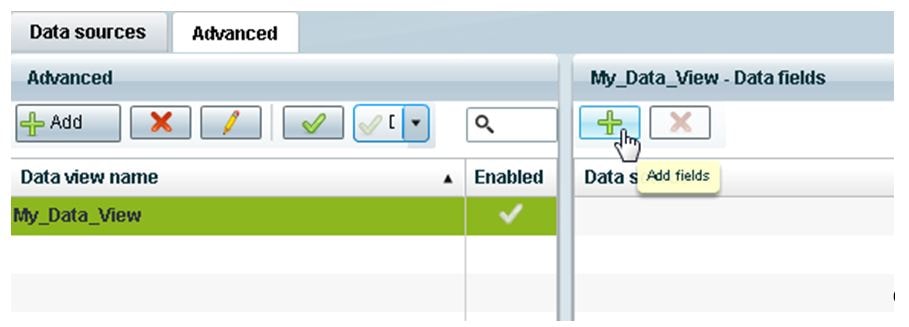
1.![]() To add a data source and its configured fields to the selected data view, click the plus (+) icon in the Data fields panel (Figure 3).
To add a data source and its configured fields to the selected data view, click the plus (+) icon in the Data fields panel (Figure 3).
Figure 3 Add Data Source Fields
A list of the available configured data sources is displayed in the Add or select data source panel ().
TIP: The example shows generic data sources, but any data source type can be added to a data view.
To add a data source to the data view, select a source name from the list and click <<. Repeat this step for as many data sources as you want to combine in the data view.
The sources that you added are displayed under the Data source column (Figure 4).
Figure 4 Data Sources Selected in Data View
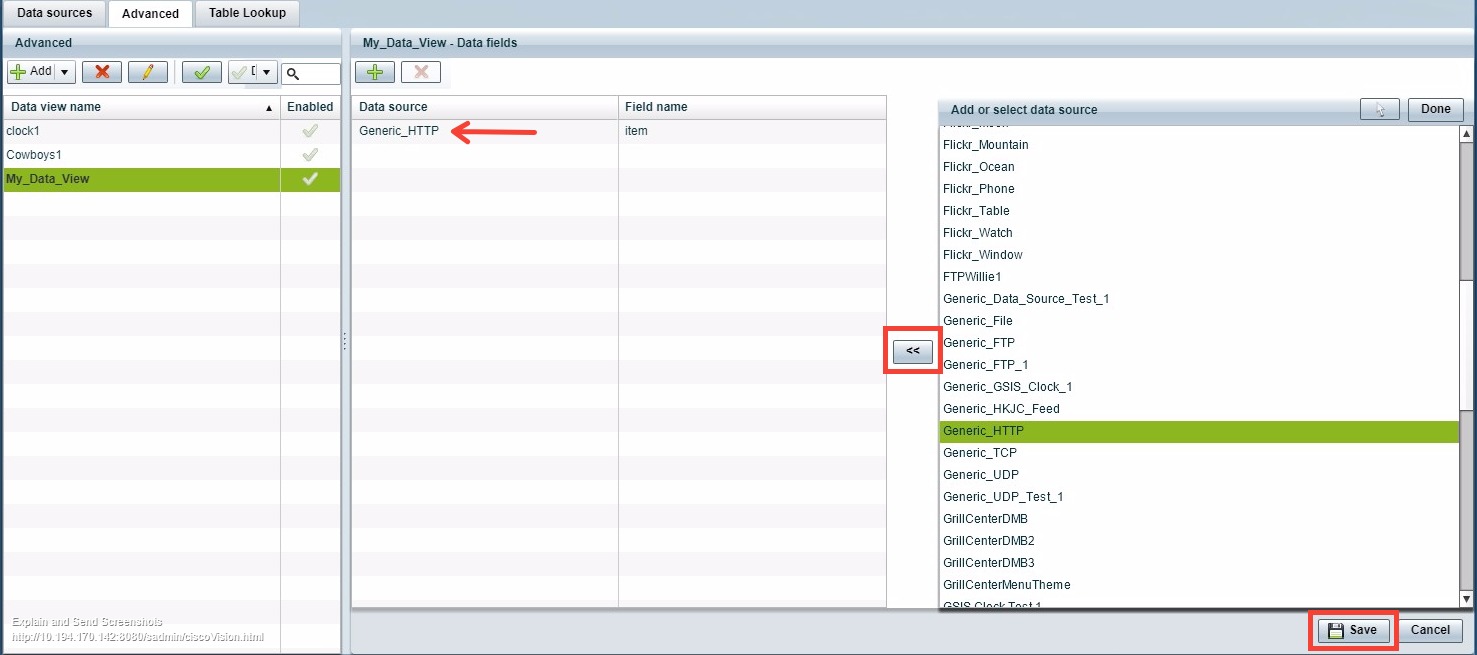
2.![]() After you have added all required data sources, click Done.
After you have added all required data sources, click Done.
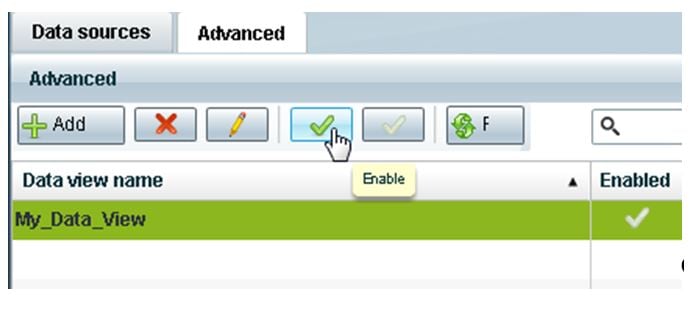
Enabling the Data View
Disabled data views are indicated by a gray checkmark in the Enabled column of the corresponding data view name. When a data view is enabled, the checkmark turns green.
1.![]() Select the data view name and click the checkmark icon (Figure 5).
Select the data view name and click the checkmark icon (Figure 5).
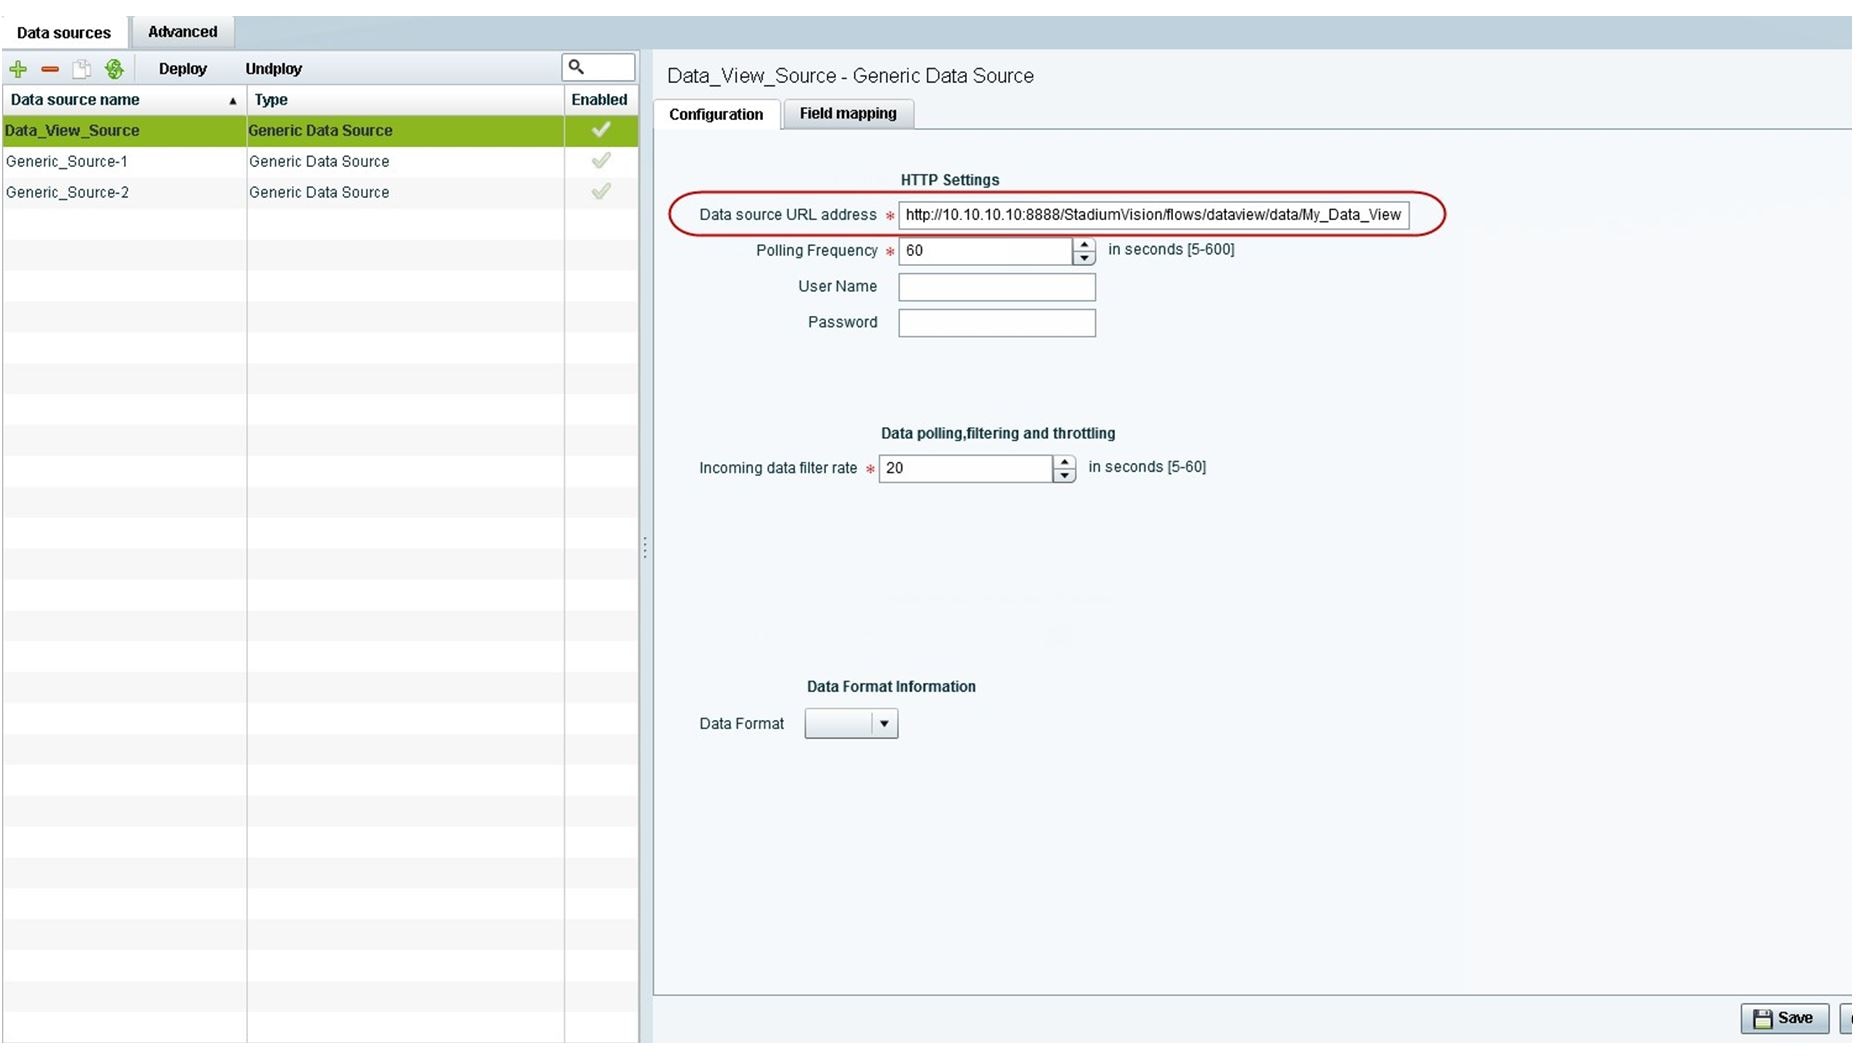
Configuring the Data View as a New Data Source
After you create a data view, you must configure it as a new data source to make the data available to the External Content Integration feature.
Prerequisites
Before you configure the data view as a new data source, be sure that the following requirements are met:
■![]() You have the internal URL that identifies the location of the view. The format of the URL is shown in the following example, where svd-ip-address is the IP address of the Cisco Vision Director server and dataview-name is the name of the data view that you created:
You have the internal URL that identifies the location of the view. The format of the URL is shown in the following example, where svd-ip-address is the IP address of the Cisco Vision Director server and dataview-name is the name of the data view that you created:
http://svd-ip-address:8888/StadiumVision/flows/dataview/data/dataview-name
In our example, the following URL would be used:
http://10.10.10.10:8888/StadiumVision/flows/dataview/data/My_Data_View
■![]() You have sample XML or JSON data for the combined data sources.
You have sample XML or JSON data for the combined data sources.
TIP : You can use the data view URL to get the sample XML data.
NOTE : The following procedure shows an example of creating a data view using the HTTP message type.
To configure the data view as a new data source:
1.![]() From the Data Integration screen, click Data Sources.
From the Data Integration screen, click Data Sources.
2.![]() Add a new Generic Data Source with the HTTP message type.
Add a new Generic Data Source with the HTTP message type.
3.![]() Type the internal URL to the configured data view (Figure 6).
Type the internal URL to the configured data view (Figure 6).
Figure 6 HTTP URL for Data View
6.![]() Provide the sample XML or JSON data.
Provide the sample XML or JSON data.
For more information, see XML or JSON Schema for Generic Data Sources.
7.![]() Select the input fields and map them for display.
Select the input fields and map them for display.
Fore more information, see Selecting Input Statistics and Mapping to Output Fields for Display.
For more information, see Enabling the Data Source Configuration.
9.![]() Verify the data integration.
Verify the data integration.
For more information, see Verifying the Integration.
What To Do Next
After you have defined, enabled and verified your data view as new data source, go to the Widgets tool to layout the content. For more information, see How to Design the Layout of External Content for Display.
Modifying the Output Format of a Statistic
You can use the default format and value of a mapped statistic for output using the default “Pass through input field” option, or you can modify its characteristics for display.
The following types of actions can be taken on input field data:
■![]() Changing the Output Field Name
Changing the Output Field Name
■![]() Adding a Prefix or Suffix String to a Field
Adding a Prefix or Suffix String to a Field
■![]() Modifying the Default XPath Expression
Modifying the Default XPath Expression
This editing can be done either when you first add a statistic to the Output fields panel (in the Add Output field dialog box), or later if you edit the statistic from the Output fields panel (in the Edit Output field dialog box) as shown in Figure 7.
Figure 7 Change Output Field Dialog Box
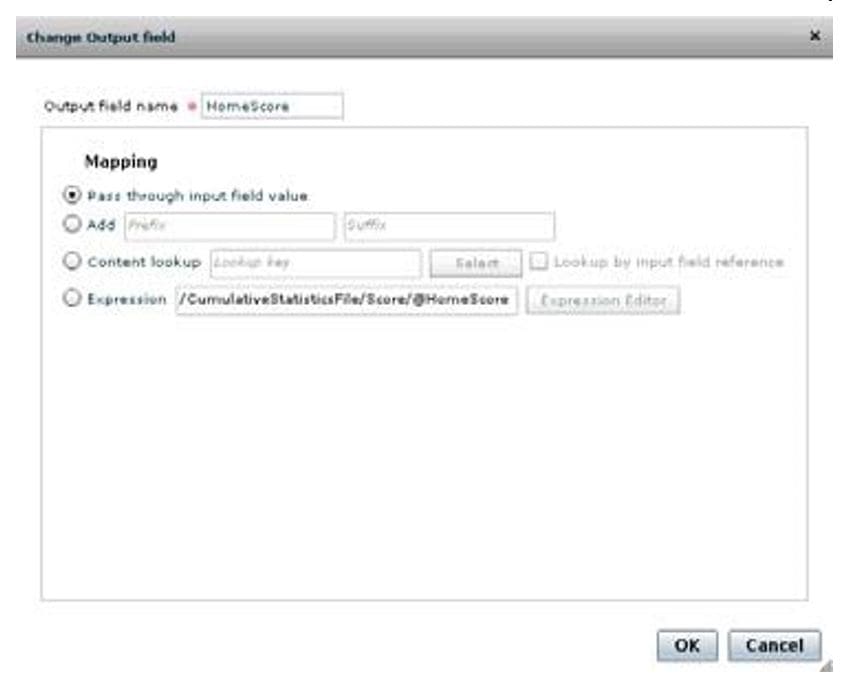
Changing the Output Field Name
To change the output field name:
1.![]() In the Output field name box of the Change Output field dialog box, type the new name of the field that you want to use.
In the Output field name box of the Change Output field dialog box, type the new name of the field that you want to use.
Adding a Prefix or Suffix String to a Field
You can add a character string as a prefix or suffix to the input field value. For example, if the default input value for an input field called Period1 was a numeric value “1,” you could specify “st” in the suffix box so that the input field value is appended with this string and appears in the output as “1st.”
To add a prefix or suffix string to an input field:
1.![]() In the Mapping section of the Change Output field dialog box, select the Add option.
In the Mapping section of the Change Output field dialog box, select the Add option.
–![]() To add a character string as a prefix to the input field value, type the string in the Prefix box.
To add a character string as a prefix to the input field value, type the string in the Prefix box.
–![]() To add a character string as a suffix to the input field value, type the string in Suffix box.
To add a character string as a suffix to the input field value, type the string in Suffix box.
Looking Up Content
You can find an image from the content library to display in the widget. An image can be located using the image name (such as “Image1.png”), either as part of the value of the input field or as an explicit reference in the text box. If you are locating the image as part of the input field, be sure to select the “Lookup by input field reference” checkbox.
1.![]() In the Mapping section of the Change Output field dialog box, select the Content lookup option.
In the Mapping section of the Change Output field dialog box, select the Content lookup option.
–![]() To specify the explicit filename, either type the filename in the Lookup key box or click Select to browse for it.
To specify the explicit filename, either type the filename in the Lookup key box or click Select to browse for it.
–![]() Click the “Lookup by input field reference” checkbox if you want the image to be located as part of the input field data.
Click the “Lookup by input field reference” checkbox if you want the image to be located as part of the input field data.
Modifying the Default XPath Expression
Currently, the two functions supported in the External Content Integration feature are “lookup” and “concat.”
TIP: For information about XPath expressions, see the following URL:
http://www.w3schools.com/xml/xpath_intro.asp
To modify the default XPath expression:
1.![]() In the Mapping section of the Change Output field dialog box, select the Expression option. Click Expression Editor.
In the Mapping section of the Change Output field dialog box, select the Expression option. Click Expression Editor.
2.![]() The Expression Editor dialog box displays.
The Expression Editor dialog box displays.
3.![]() In the text editor box where the expression for the input field function is displayed, modify the expression using standard XPath expression syntax.
In the text editor box where the expression for the input field function is displayed, modify the expression using standard XPath expression syntax.
Choosing Specific Items From a Feed
Use the position() XPath predicate to include or exclude specific items from a given feed. The following expression shows the default syntax for an RSS feed using the title element:
/rss/channel/item/title/text()
To modify this expression to select only the third and fourth data elements from the feed, modify the expression to add the following position predicate:
/rss/channel/item[position()>2 and position()<5]/title/text()
To modify the expression to include the second, third and fourth data elements from the feed, use the following position predicate:
/rss/channel/item[position()>=2 and position()<5]/title/text()
Modifying the Default Data Throttling Values and Registry Configuration
Beginning in Cisco Vision Director Release 3.1, certain data throttling values for External Content Integration are configurable as registry keys in the Management Dashboard (Table 1).
CAUTION: Configuration of data throttling can be required to maintain optimum DMP performance to support External Content Integration in Cisco Vision Director. Be sure that if you plan to modify the data throttling values, you understand that DMP performance could be severely impacted, and that you make changes only when no events are running in the venue and during an adequate maintenance window for the system.
The actual performance impact is dependent on a combination of factors including the registry values that are set, the number of data sources, and the amount of content / widgets / datasources visible on the DMP display.
Table 1 describes the global registry keys that apply to all data sources configured for Data Integration beginning in Cisco Vision Director Release 3.1.
Disabling the Data Source Configuration
To disable the data source configuration:
1.![]() In the left pane, select the data source.
In the left pane, select the data source.
2.![]() Click Undeploy. A message box appears asking you to restart the application.
Click Undeploy. A message box appears asking you to restart the application.
3.![]() If you have completed all of the changes that you want to make on the Configuration tab, restart the application.
If you have completed all of the changes that you want to make on the Configuration tab, restart the application.
For more information, see Restarting the Data Integration Application.
Deactivating the Data Integration Application From the Management Dashboard
By default, the Data Integration Application is deactivated in Cisco Vision Director.
If your site is not going to connect to any external servers, then you can deactivate it to disable the functionality of the application system-wide in Cisco Vision Director.
To deactivate the Data Integration application:
1.![]() Log into Cisco Vision Director as an administrator.
Log into Cisco Vision Director as an administrator.
2.![]() From the Cisco Vision Director Main Menu, click the Gear icon and select Management Dashboard.
From the Cisco Vision Director Main Menu, click the Gear icon and select Management Dashboard.
3.![]() Using the Management Dashboard drawers, go to Tools > Settings > Data Integration.
Using the Management Dashboard drawers, go to Tools > Settings > Data Integration.
4.![]() Select Deactivate Application.
Select Deactivate Application.
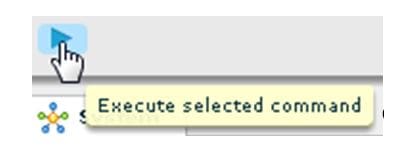
5.![]() Click the Play button to run the command.
Click the Play button to run the command.
6.![]() When the confirmation message box appears, click OK to run the command.
When the confirmation message box appears, click OK to run the command.
7.![]() After the processing has completed, select Restart Application and click the Play button.
After the processing has completed, select Restart Application and click the Play button.
8.![]() When the confirmation message box appears, click OK to run the command.
When the confirmation message box appears, click OK to run the command.
Viewing Sample Data Versus Real-Time Data
The Data Integration feature supports viewing of both sample data and real-time data in the Field Mapping tab of the user interface. Figure 8 shows where each of these View data options are specified.
Figure 8 Selection of Sample Data v. Real-Time Data for Data Integration
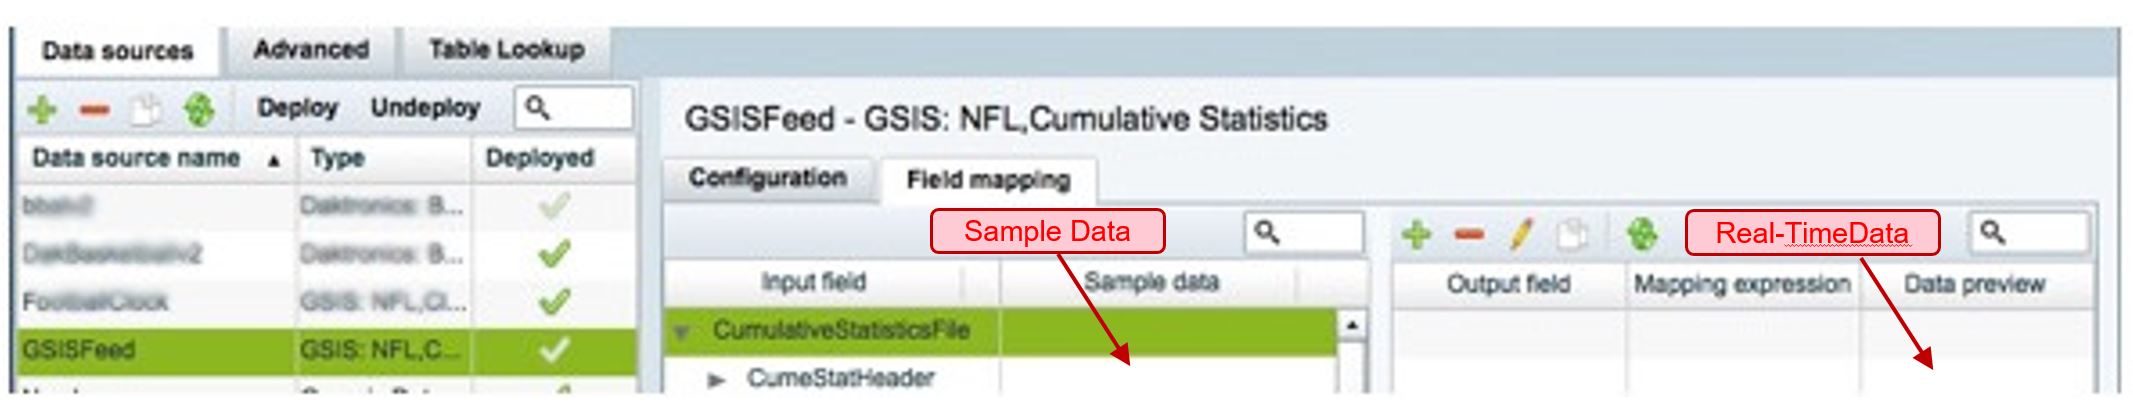
The Data Integration feature ships with sample data for the different statistics that are available for selection. The user interface automatically displays these sample values for the statistics in the Sample data column of the Field mapping tab.
Figure 9 shows the sample data for the different statistics that are available from the NFL Game Clock data source.
Figure 9 Sample Data for the NFL Game Clock Data Source
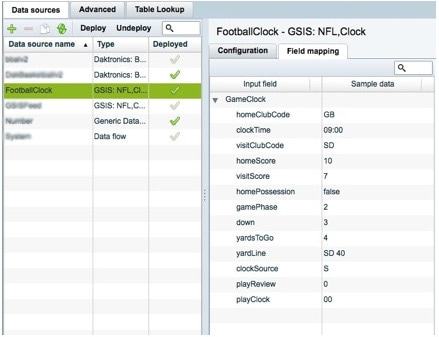
Notice that the View data option is not selected. You also can select the View data box on the Field mapping tab when you want to see the collective sample data for all of the statistics nested under a selected Input field.
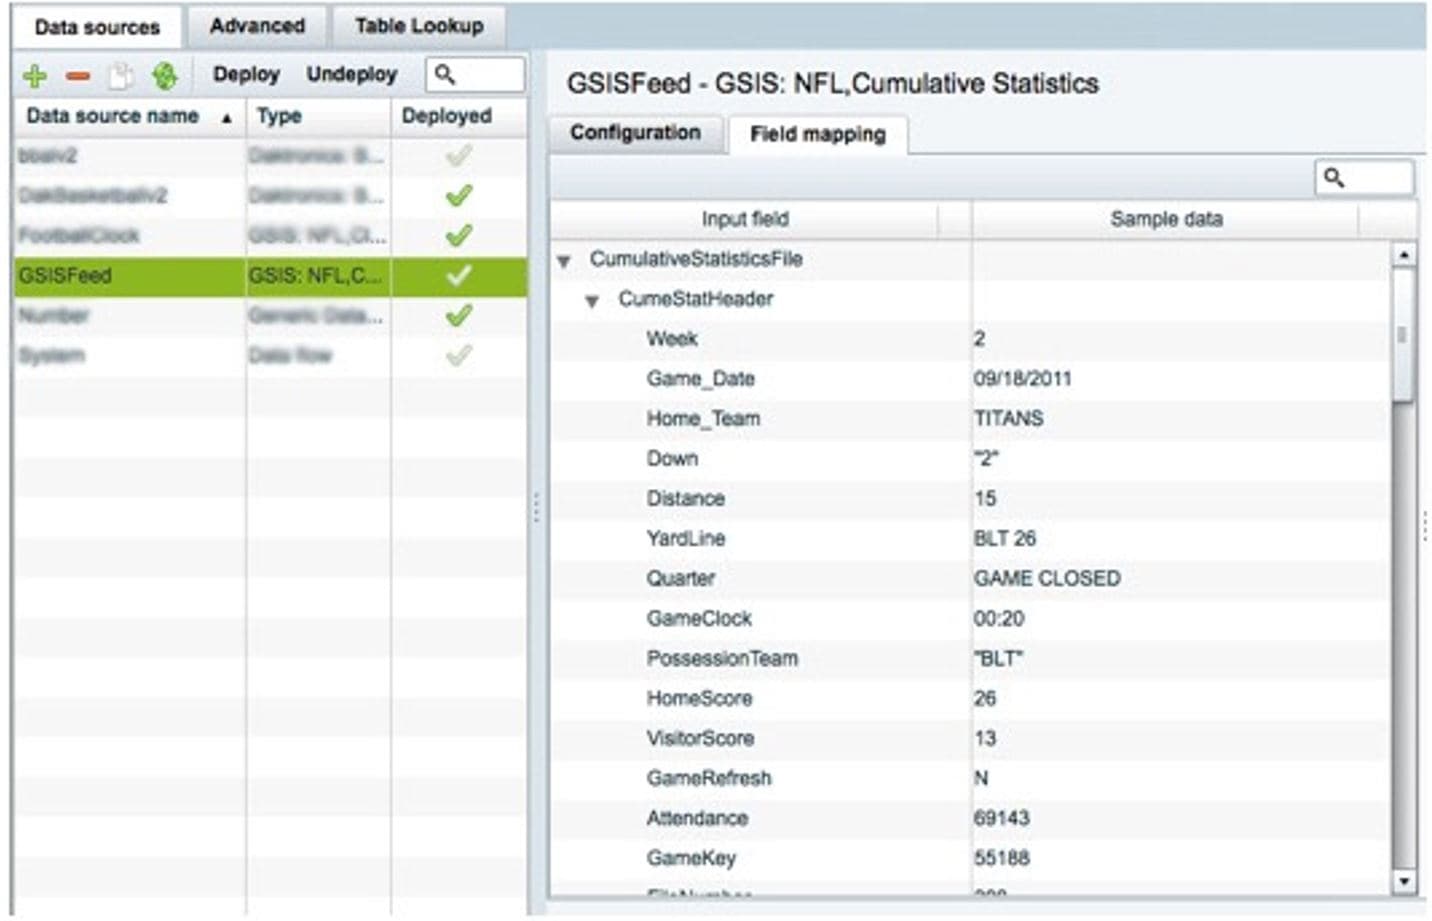
Figure 10 shows an example of the display of sample data using the View data option for the CumeStatHeader Input field of the CumulativeStatisticsFile for the NFL GSIS Statistics data source.
Figure 10 Sample Data for the CumeStatHeader Input Field
To see real-time data in the interface for the selected statistics, select the View data checkbox on the right side of the Field mapping tab in the Output fields panel as shown in Figure 8. For more information, see Verifying Receipt of Real-Time Data.
 Feedback