Introduction
This document describes how to troubleshoot Cisco XDR Analytics for Cisco eXtended Detection and Response (XDR) / Network Visibility Module (NVM)
Prerequisites
Active XDR Analytics portal with XDR integration
Requirements
Running XDR Analytics account with single XDR integration
Components Used
- XDR Analytics
- XDR
- NVM Sensor
- Secure Client (Version 5.0+)
The information in this document was created from the devices in a specific lab environment. All of the devices used in this document started with a cleared (default) configuration. If your network is live, ensure that you understand the potential impact of any command.
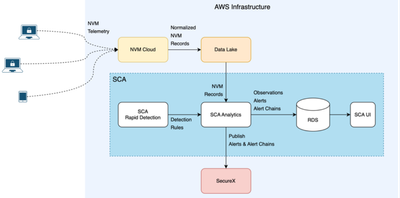
XDR Analytics NVM flows
XDR Analytics now consumes NVM telemetry
The telemetry is generated by the NVM component in Cisco Secure Client.
NVM provide enhanced network visibility, including user behaviors, network communications, and processes, thereby reducing incident investigation time and filling gaps in endpoint visibility
https://docs.xdr.security.cisco.com/Content/Help-Resources/nvm-resources.htm
NVM data flows – XDR Analytics
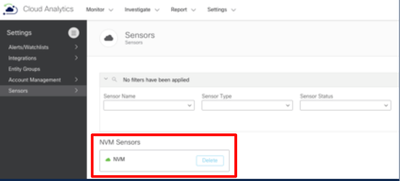
NVM Sensor Status

Warning: XDR Analytics Portal must have at most a single XDR Tenant/Organization associated with it.
NVM Org ID
NVM Data Lake Provisioning Status
Debugging
- Debugging response codes:
|
Response Code
|
Action Required
|
|
DataLake provisioned successfully
|
Validate NVM flows via Event Viewer
|
|
Unable to provision data lake, no XDR organization detected
|
Use the XDR one-click integration to connect XDR and XDR Analytics
|
|
Unable to provision datalake, Multiple XDR organizations detected
|
Contact TAC for Assistance
|
- If any of these steps fail, run the Secure Client Diagnostics And Reporting Tool (DART) from the Secure Client interface to diagnose the problem (Always request DART be run as administrator)
Collect DART Bundle for Secure Client
Observations & Alerts
NVM Alerts
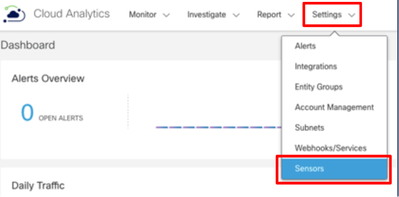
- Login to XDR Analytics portal
- Settings > AlertsTelemetry > Cisco NVM
-
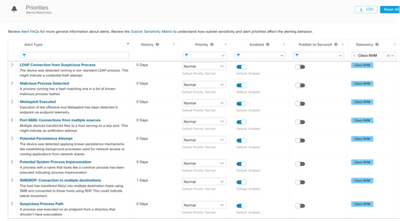
Telemetry > Cisco NVM
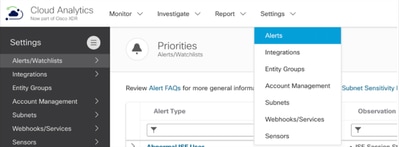
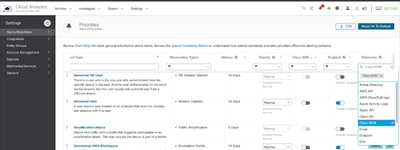
NVM Alert Settings
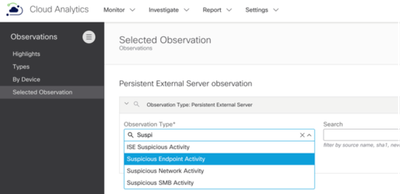
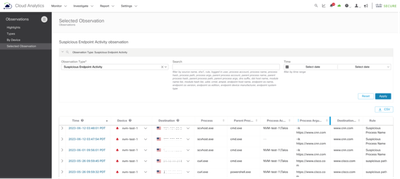
NVM Observations
– Suspicious Endpoint Activity
- XDR Analytics portal
- Monitor > Observations
- Selected Observation
- Filter Suspicious Endpoint Activity
NVM Detection Caveats
- NVM only captures processes & flow data that have an associated network connection
- NVM is configured to report flow data only at the end of flow by default
Conclusion
These steps help you navigating through XDR Analytics to enable Observations and Alerts using NVM information and troubleshooting the workflow.


 Feedback