Introduction
This document describes how to perform a packet capture on a Cisco Telemetry Broker (CTB) Broker node.
Prerequisites
Requirements
Cisco recommends that you have knowledge of these topics:
- Basic Linux administration
- Basic Cisco Telemetry Broker architecture
- SSH basic knowledge
- Command Line Interface (CLI) access as
admin and root is needed to perform the packet capture.
Components Used
The information in this document is based on CTB Broker node running version 2.3.3.
The information in this document was created from the devices in a specific lab environment. All of the devices used in this document started with a cleared (default) configuration. If your network is live, ensure that you understand the potential impact of any command.
Configure
The CTB Broker Node has a tool called ctb-pcap that is used to perform a network capture from the telemetry interface of the broker node. Note that this tool is not available at the CTB Manager Node.
- Before you use the command
ctb-pcap, ensure that you first switch to the root user with the command sudo su. This tool is available to the root user only.
ctb-pcap --help at the CLI of the Broker node. This image displays the full list of the options:- If you are attempting to perform a network capture on an HA Pair of Brokers, ensure that you are attempting the ctb-pcap from the active CTB Broker.
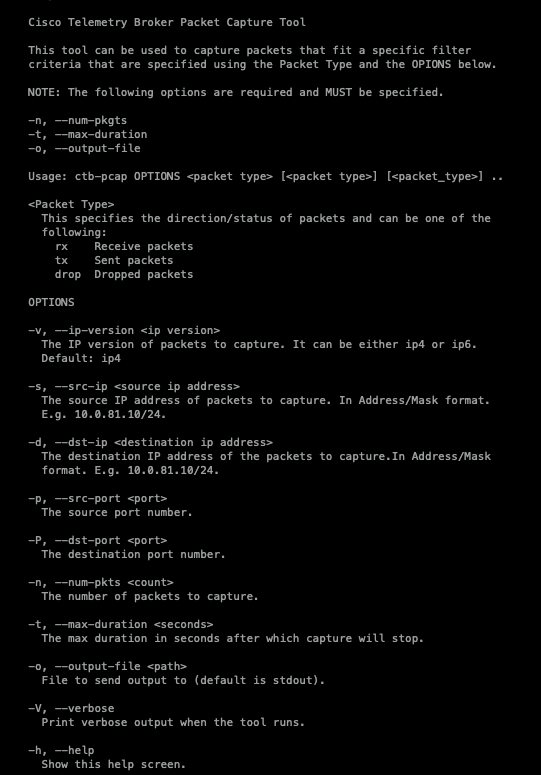
As the output indicates, the number of captured packets, the duration in seconds, and the packet capture output file name are required. Moreover, the packet type, either received, sent, or dropped packets, must be stated in the command.
There is another dependency that is not listed as well: when attempting to capture the Source Port (-p) or Destination Port (-P), the Transport Protocol (-T) option is also required.
You can use the next syntax as the basis of the packet capture command, which already specifies the number of captured packets, the duration and the file name of the packet capture, as well as the verbose option and packet type:
ctb-pcap -V -n [number_pkts] -t [duration] -o [filename] [rx/tx/drop]
Examples
1. Capture all rx traffic without filter:
sudo ctb-pcap -n 10000 -t 30 -o rx-no-filter.pcap -V rx
2. Capture rx for ipv4 src subnet (use ip/32 for single src):
sudo ctb-pcap -n 10000 -t 30 -o rx-ipv4-src-subnet.pcap -s 10.0.81.0/24 -V rx
3. Capture rx for ipv6 src ip:
sudo ctb-pcap -n 10000 -t 30 -o rx-ipv6-srcip.pcap -s fc00:f53b:82e4::1000 -v ip6 -V rx
4. Capture rx for ipv4 udp
sudo ctb-pcap -n 10000 -t 30 -o rx-ipv4-udp.pcap -T udp -V rx
5. Capture tx for ipv4 tcp
sudo ctb-pcap -n 10000 -t 30 -o tx-ipv4-tcp.pcap -T tcp -V tx
6. Capture rx for ipv6 udp
sudo ctb-pcap -n 10000 -t 30 -o rx-ipv6-udp.pcap -T udp -v ip6 -V rx
7. Capture rx for ipv6 tcp
sudo ctb-pcap -n 10000 -t 30 -o rx-ipv6-tcp.pcap -T tcp -v ip6 -V rx
8. Capture rx for ipv4 udp dstport
sudo ctb-pcap -n 10000 -t 30 -o rx-ipv4-udp-dstport.pcap -T udp -P 2055 -V rx
9. Capture tx for ipv4 tcp dstport
sudo ctb-pcap -n 10000 -t 30 -o tx-ipv4-tcp-dstport.pcap -T tcp -P 443 -V tx
10. Capture rx for ipv6 udp dstport
sudo ctb-pcap -n 10000 -t 30 -o rx-ipv6-udp-dstport.pcap -v ip6 -T udp -P 2055 -V rx
11. Capture rx for ipv6 tcp dstport
sudo ctb-pcap -n 10000 -t 30 -o rx-ipv6-tcp-dstport.pcap -v ip6 -T tcp -P 443 -V rx
12. Capture rx for ipv4 srcip and udp dstport
sudo ctb-pcap -n 10000 -t 30 -o rx-ipv4-srcip-udp-dstport.pcap -s 10.0.81.171/32 -T udp -P 2055 -V rx
13. Capture rx for ipv4 srcip and tcp dstport
sudo ctb-pcap -n 10000 -t 30 -o rx-ipv4-srcip-tcp-dstport.pcap -s 10.0.81.171/32 -T tcp -P 443 -V rx
14. Capture rx for ipv6 srcip and udp dstport
sudo ctb-pcap -n 10000 -t 30 -o rx-ipv6-srcip-udp-dstport.pcap -s fc00:f53b:82e4::1000 -v ip6 -T udp -P 2055 -V rx
15. Capture rx for ipv6 srcip and tcp dstport
sudo ctb-pcap -n 10000 -t 30 -o rx-ipv6-srcip-tcp-dstport.pcap -s fc00:f53b:82e4::1000 -v ip6 -T tcp -P 443 -V rx
Enter the command at the CLI of the Broker Node and the packet capture begins. When the packet capture finishes, the file is automatically saved to /var/lib/titan/pcap/ directory.
Here is an example of the verbose output from the packet capture command:
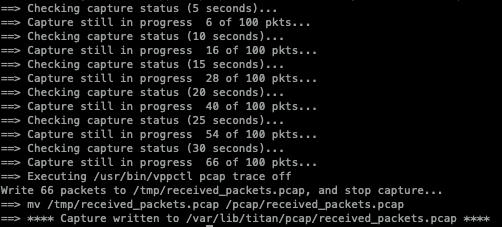 Verbose output from the example command
Note that for the duration and number of packet options, the first one stops the packet capture. (For example, if a total of 100 packets have been captured even though the thirty of the duration have not been completed, the packet capture is stopped. In this example, the duration of thirty seconds was reached first, so only 66 packets were captured.)
After the packet capture has been generated, use SCP or SFTP to transfer the file to your local machine. If you use SFTP, enter the admin credentials to connect to the appliance.
You can also use> sudo tcpdump -nnnr </lavar/lib/titan/pcap/<pcap_filename> in order to replay the pcap to the console. This is useful if you just want to quickly see if the capture packets have any data in them

Related Information
 Feedback