Introduction
This document describes how to use the built-in Agent Troubleshooting Tool PowerShell script to resolve common Windows agent issues.
Prerequisites
Requirements
PowerShell version 4.0 or a higher version is needed to run this Agent Troubleshooting Tool PowerShell script.
Components Used
The information in this document is based on these software and hardware versions:
- Secure Workload (Tetration) 3.10.1.1
The information in this document was created from the devices in a specific lab environment. All of the devices used in this document started with a cleared (default) configuration. If your network is live, ensure that you understand the potential impact of any command.
Background Information
The Agent Troubleshooting Tool script comes with several options that allow you to check the overall health of your agents, known issues with agent registration, known issues with agent upgrades, check the overall enforcement health, and collect logs for further analysis.

Note: The Agent Troubleshooting Tool comes packaged with the agent beginning in version 3.9. For versions earlier than 3.9, it is not included by default. If you are using a version prior to 3.9, you can copy the script from a Windows machine with the 3.9 agent installed and paste it into (C:\Program Files\Cisco Tetration) to use the troubleshooting tool.
Steps To Run The Script
To run the Agent troubleshooting tool script, follow these steps:
1. Open PowerShell as an administrator.
2. Navigate to the CSW installation directory (default location: C:\ Program Files \Cisco Tetration).
3. Run the script using this command:
.\AgentTroubleshootingTool.psl
List of Parameters Available in this Agent Troubleshooting Tool Script
The Agent troubleshooting tool comes with several options that allow you to troubleshoot different aspects of your agents.
Here are the available options:
-agentHealth: run agent Health Report
-agentRegistration: check for issues in Agent Registration
-agentUpgrade: check for issues with agent Upgrade
-enforcementHealth: check for issues with Enforcement
-collectLogs: collect Logs for debugging
-collectDebugLogs: collect logs with loglevel:5 enabled. This includes logs collected using the parameter -collectLogs as well
-all: run all parameters except -collectDebugLogs
To use any of these options, simply run the script with the appropriate parameter.
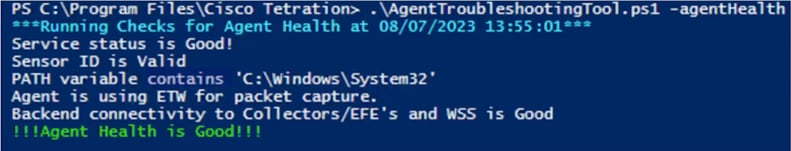
For example, to check the health of your agents, run the script with the -agentHealth parameter:
.\AgentTroubleshootingTool.ps1 -agentHealth
Parameter Details -agentHealth
Under the -agentHealth parameter, you are checking these things:
- Services TetSensor and TetEnforcer are in a running state.
- Sensor ID is valid
- PATH variable contains 'C:\ Windows\System32'
- The agent is using ETW or NPCAP. If the OS is 2008R2, then you are checking NPCAP Health.
Backend connectivity with our collectors/EFEs and WSS is good.
Here is an example of the script output when run the script with the -agentHealth parameter
.\AgentTroubleshootingTool.ps1 -agentHealth
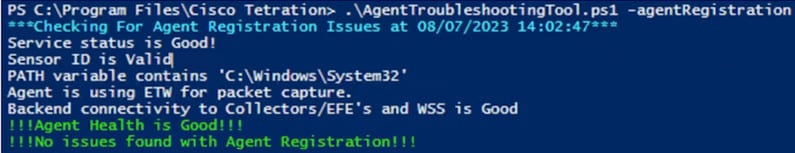
Parameter Details -agentRegistration
Under the -agentRegistration parameter, you are checking these things:
- It includes the report collected using the parameter -agentHealth.
- Registration errors are based on error codes, for example, 401/403, and others.
There is also an option provided to re-register the agent with the cluster if it is deleted from the UI by mistake.
Here is an example of the script output when you run the script with the -agentRegistration parameter.
.\AgentTroubleshootingTool.ps1 -agentRegistration
Parameter Details -agentUpgrade
Under the -agentUpgrade parameter, you are checking these things:
- Required certificates are available in the store.
- The MSI cache is available under the C: \ Windows \Installer folder.
If no known issues are found, but the agent upgrade is still failing, then you provide the option to collect debug logs for further troubleshooting.
Here is an example of the script output when you run with the -agentUpgrade parameter
.\AgentTroubleshootingTool.ps1 -agentUpgrade

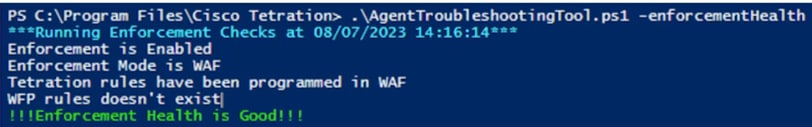
Parameter Details -enforcementHealth
Under the -enforcementHealth parameter, you are checking these things:
- Enforcement is enabled or disabled.
- Which Mode of Enforcement is Enabled.
- CSW rules have been programmed in WAF, or WFP filters have been programmed.
- CSW WFP filters do not exist (when mode is WAF).
- CSW WAF rules do not exist (when mode is WFP).
Steps 4 and 5 are to identify issues when Enforcement Mode was switched.
Here is an example of the script output when you run the script with the -enforcementHealth parameter.
.\AgentTroubleshootingTool.ps1 -enforcementHealth
Parameter Details -collectLogs
The script collects logs for debugging purposes when run with the -collectLogs parameter.
Collected logs can be saved under the path C:\ Program Files \Cisco Tetration\logs\logs\Troubleshoot_Logs
Here is an example of the script output when you run the script with the -collectLogs parameter.
.\AgentTroubleshootingTool.ps1 -collectLogs

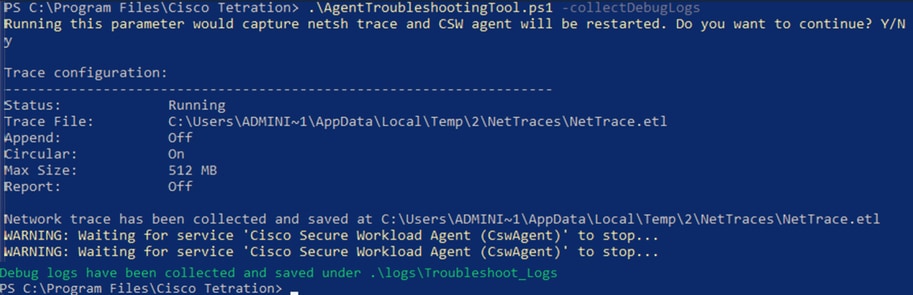
Parameter Details -collectDebugLogs
The script collects logs with loglevel:5 enabled for debugging purposes when you run with the -collectDebugLogs parameter.
Running the script with this parameter would capture the netsh trace, and the CSW agent can be restarted.
Collected logs can be saved under the path C:\ Program Files \Cisco Tetration\logs\logs\Troubleshoot_Logs
Here is an example of the script output when you run the script with the -collectDebugLogs parameter.
.\AgentTroubleshootingTool.ps1 -collectDebugLogs

Warning: The Agent Troubleshooting Tool displays errors in red color and warnings in yellow color. If you are unable to resolve the common issues flagged by the Agent Troubleshooting Tool, please collect debug logs using the Agent Troubleshooting Tool and generate a Secure Workload Agent log bundle and contact Cisco TAC for assistance.
Generate the Secure Workload Agent Log Bundle
In order to collect the log bundle, the Secure Workload agent must be active.
- For the 3.6.x version, navigate to the left navigation panel, chooseManage > Agent, and clickAgent List.
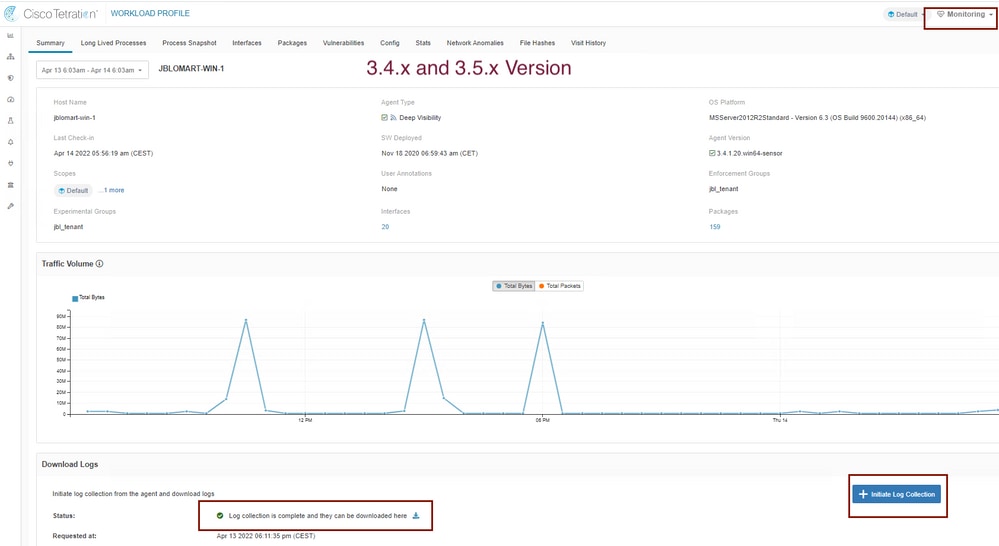
- For the 3.4.x and 3.5.x versions, navigate toMonitoring from the top right drop-down menu and choose Agent List.
Utilize the filter option to search for the agent, and click theagent. It takes you to the workload profile of the agent. Here you can find details about the agent configuration,
status, and so on.
At the left side navigation panel of the workload profile page (3.6.x), choose Download Logs (in the 3.4.x and 3.5.x and follow the summary tab). Click Initiate Log Collection to initiate the log collection from the Tetration Agent. It can take a while to complete the log collection. Once the log collection is complete, click theDownload hereoption to download the logs. Scroll down to get an option to upload the file to the case number.
Refer to this image to create the Secure Workload Agent Log Bundle for agents running on 3.4.x and 3.5.x versions.
Refer to this image to create the Secure Workload Agent Log Bundle starting from 3.6.x version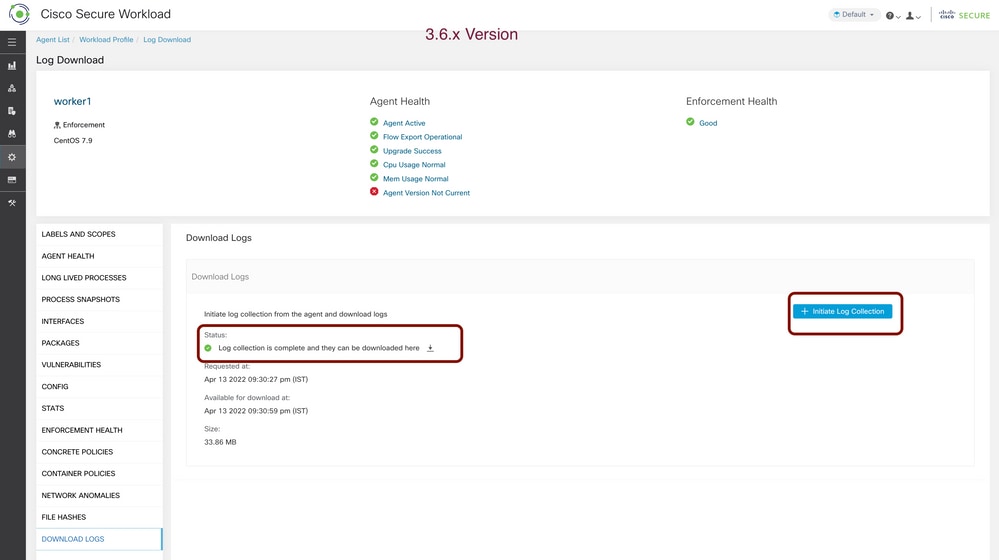
 Feedback