From the navigation pane, choose Troubleshoot > Cluster Status.
The cluster status shows the status of all the servers in the Cisco Secure Workload rack. A functioning server can display a State of Commissioned and a Status of Active as shown here.
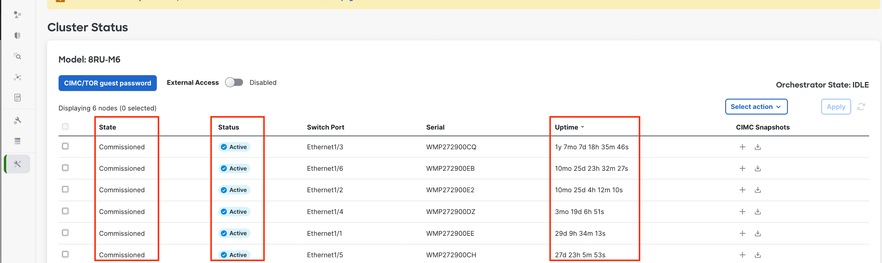

Caution: If you notice any node marked as inactive on the cluster status page, generate a CIMC snapshot and raise a TAC case, including the snapshot.
If the status appears as Inactive, it usually means the server is either turned off or can be down due to a hardware, cable, or connectivity issue.
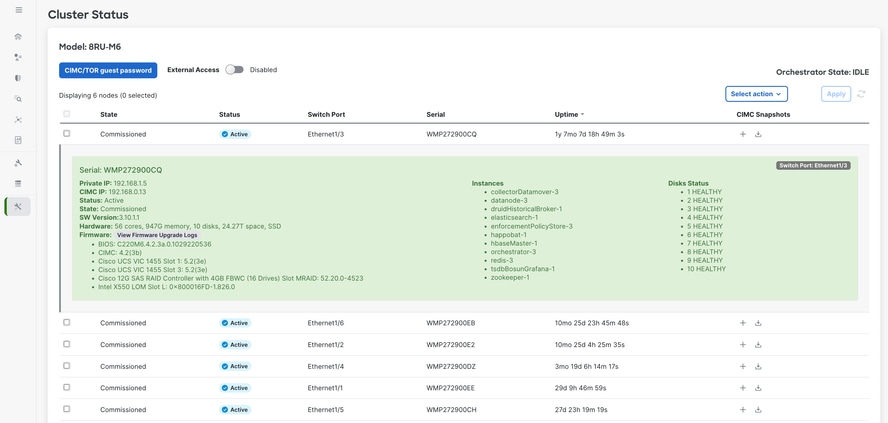
When you click a server in the list, you see more details, such as
• The virtual machines (instances) running on that physical server
• The server's private IP address within the cluster
• The CIMC (management) IP address
• The current firmware versions for the BIOS, CIMC, VIC Card, LOM card, and RAID controller
Service Status
The Service Status page is located in the left navigation pane under
page displays the health of all services that are used in your CiscoSecure Workloadcluster along with their dependencies.
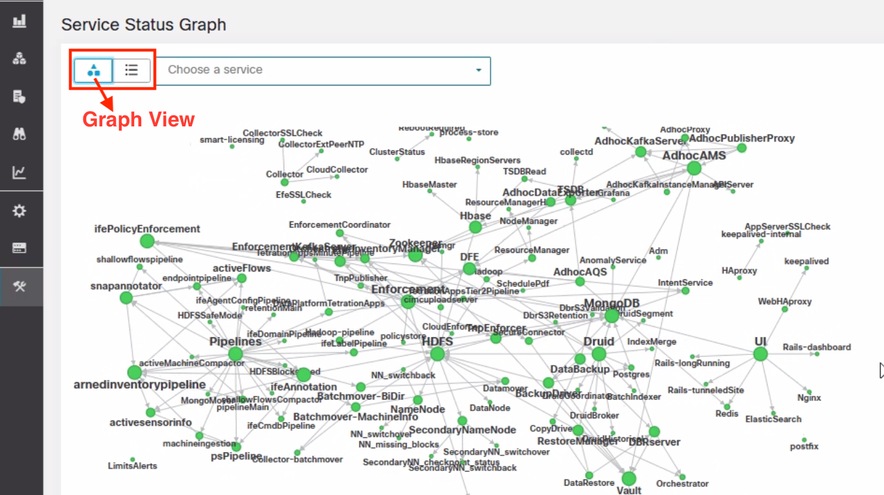
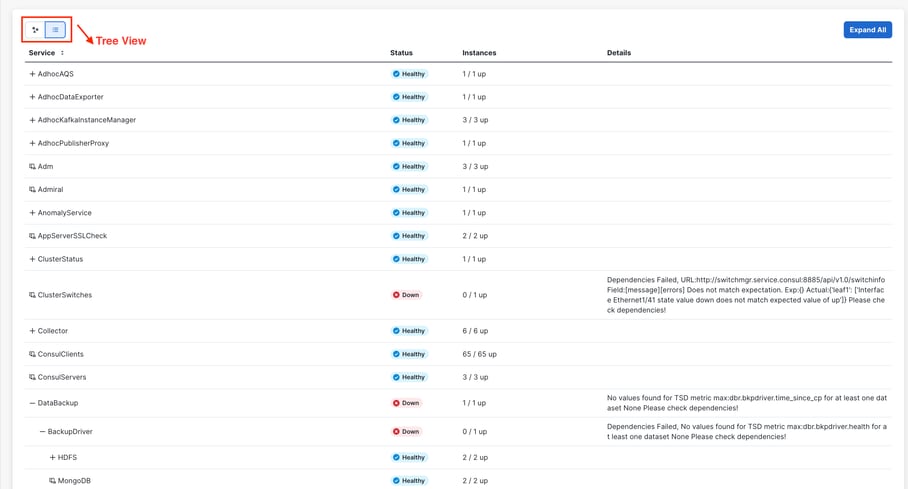
The graph view shows the health of the service, each node in the graph shows the health of the service, and an edge represents dependency on other services. Unhealthy services are marked either red when the service is unavailable, and orange when the service is degraded but available. A green color or sky blue color indicates that the service is healthy. For more debug information on these nodes, use tree view which has theExpand Allbutton to show all child nodes in the dependency tree. Down, indicates that the service is not functional, and Unhealthy, indicates that the service is not fully functional.

Note: Starting with patch version 3.10.2.11, the service status page appears in sky blue. A green color or sky blue color indicates that the service is healthy.
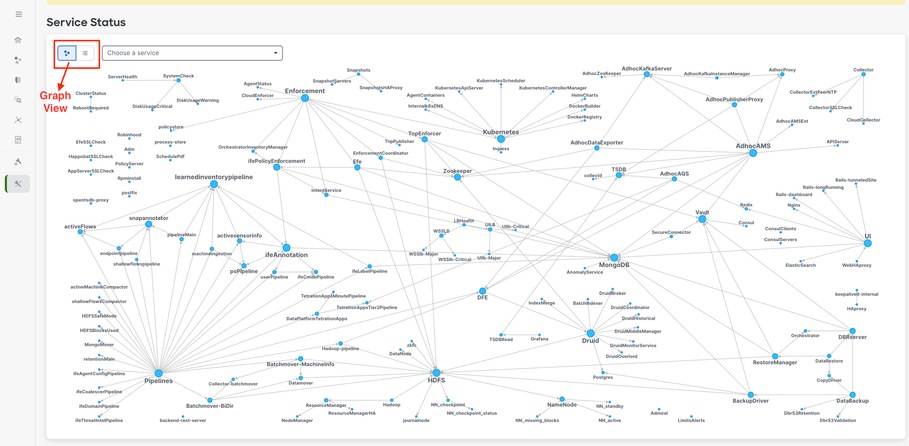
By default, the Service Status page shows the cluster functions and dependencies in a graphical view. If the icons are all green or sky blue, no error is detected.
If there is a service that displays in red or orange, the tree view shows the list of services and allows you to drill down on the dependencies of the service as well as on other details the Service Status function has detected. This dependency error information is particularly important to note and capture when opening a case with the TAC.
Caution: If you see that any of the services are unhealthy and showing red in color, contact the Technical Assistance Center (TAC) for support in resolving these issues. Quick engagement with TAC can help restore full functionality.
Hawkeye (Charts)
Hawkeye dashboards offer visibility into the health of the secure workload cluster, as well as metrics and insights to assist with troubleshooting
The Hawkeye (Charts) page is located in the left navigation pane under
When you click Hawkeye (Charts), a new browser tab automatically opens, displaying the Hawkeye dashboard as shown here.
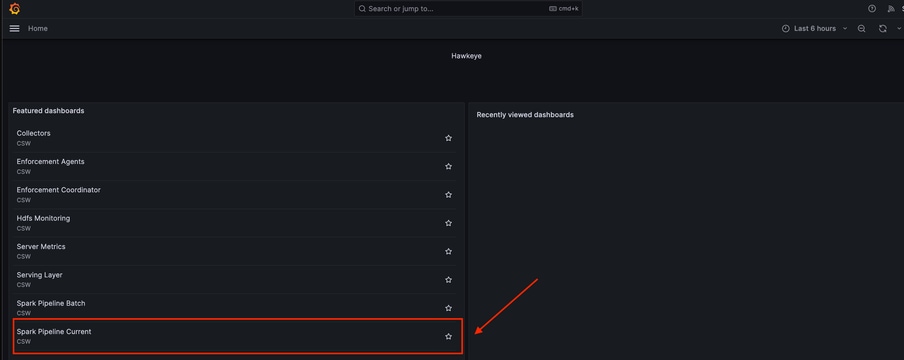
From the Hawkeye dashboard, click the Spark Pipeline Current tab to monitor the secure workload cluster's health.
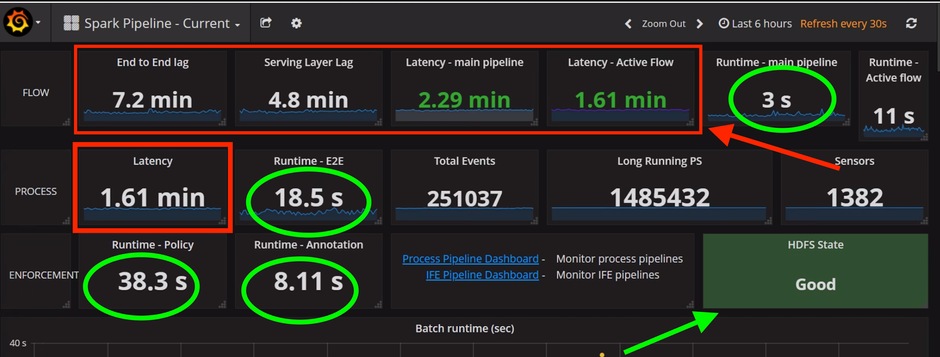
On the Spark Pipeline Current page, verify that the End-to-End Lag, Serving Layer Lag, Main Pipeline Latency, and Active Flow Latency values are all under 10 minutes.
Also, confirm that the runtime values are less than 1 minute and are presented in seconds and the HDFS state is Good, as illustrated next.
Caution: If you observe any latency values, including end-to-end lag or service layer lag, exceeding 6 hours without showing a gradual decrease, please reach out to the Technical Assistance Center (TAC).
Upgrade Prechecks
Prior to and after maintenance tasks, use the upgrade precheck to run cluster health checks; this process ensures that services, configurations, and hardware components are all in proper working order
-
Navigate toUpgrade Precheck.
Navigate to theTetrationUIand follow these steps:
Wait a few minutes for the output of the upgrade prechecks. If everything is successful as shown in this image, then you can proceed with the next actions of the cluster maintenance activities.
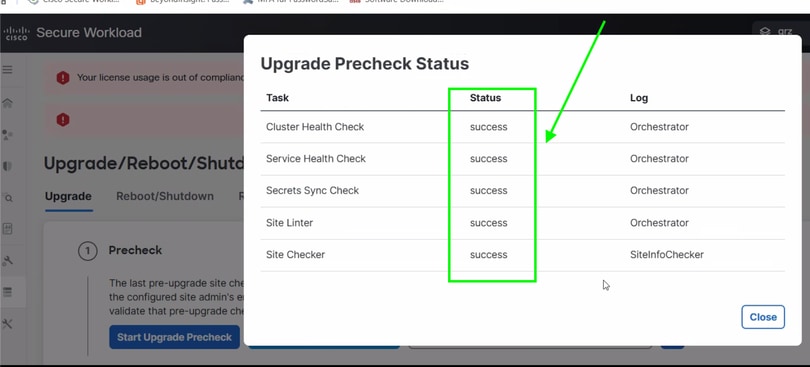
Caution: If any upgrade prechecks are unsuccessful, please contact the Technical Assistance Center (TAC) for assistance.
|
 Feedback