Introduction
This document describes how to configure the Secure Analytics Response Management feature to send events via syslog to a 3rd party such as Splunk.
Prerequisites
Requirements
Cisco recommends that you have knowledge of these topics:
- Secure Network Analytics Response Management.
- Splunk Syslog
Components Used
The information in this document was created from the devices in a specific lab environment. All of the devices used in this document started with a cleared (default) configuration. If your network is live, ensure that you understand the potential impact of any command.
- Secure Network Analytics (SNA) deployment that contains at least one Manager appliance and one Flow Collector appliance.
- Splunk server installed and accessible over 443 port.
Configure syslog on SNA over UDP 514 or custom defined port

Tip:Ensure that UDP/514,TCP/6514 or any custom port you choose for syslog is permitted on any firewalls or intermediate devices between SNA and Splunk.
1.SNA Response Management
The Response Management component of Secure Analytics (SA) can be used to configure Rules, Actions, and syslog Destinations.
These options must be configured to send/forward Secure Analytics alarms to other destinations.
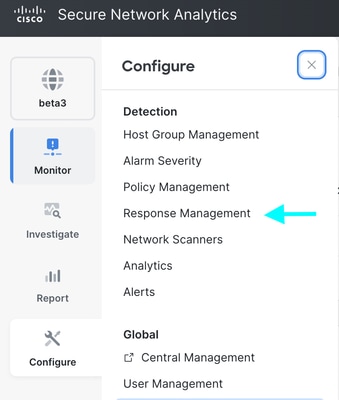
Step1: Log into the SA Manager appliance and navigate to Configure > Detection Response Management.
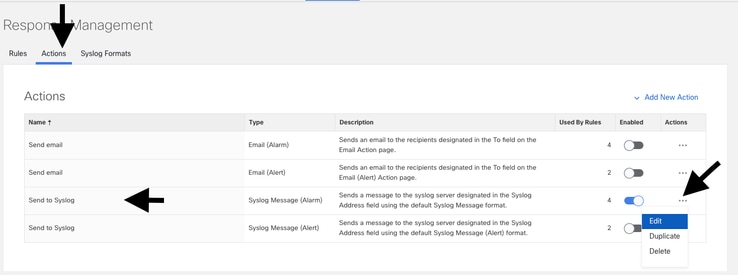
Step 2: On the new page navigate to Actions tab, locate the default Send to Syslog line item and click the ellipsis (...) in the Action column, and then Edit.
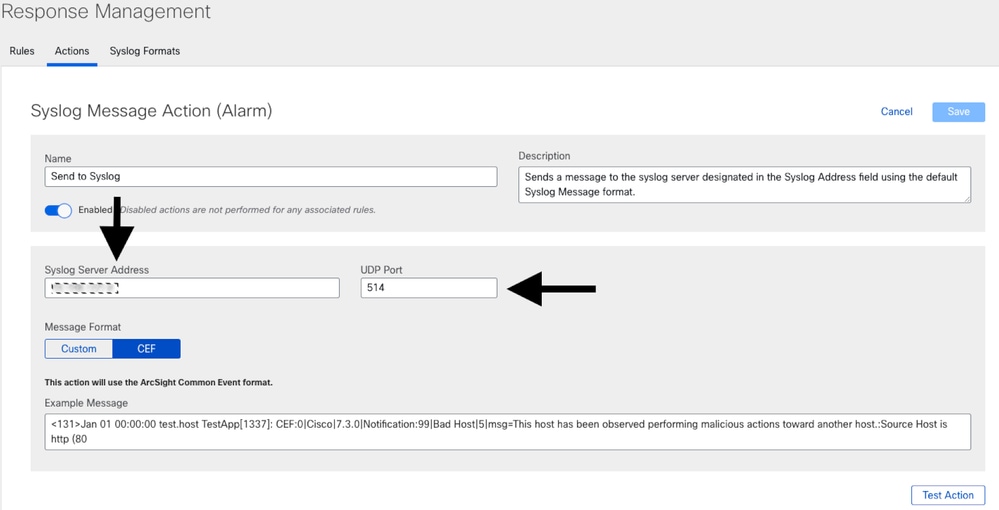
Step 3: Enter the desired destination address in the Syslog Server Address field, and the desired destination receiving port in the UDP Port field. In the Message Format select CEF.
Step 4: When completed, click the blue Save button in the upper right corner.
Tip: The default UDP port for syslog is 514
2.Configuring Splunk to Receive SNA Syslogs over UDP port
After applying your changes on Secure Network Analytics Manager Web UI , you must configure data input in Splunk.
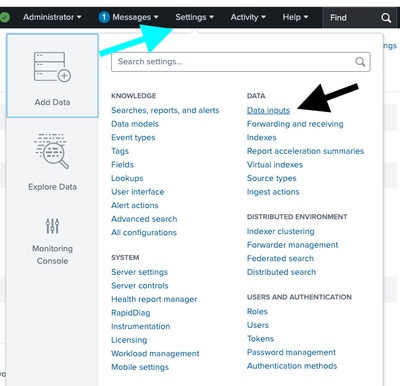
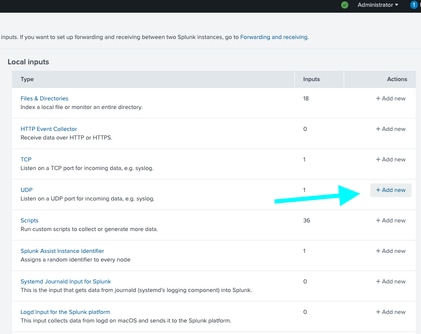
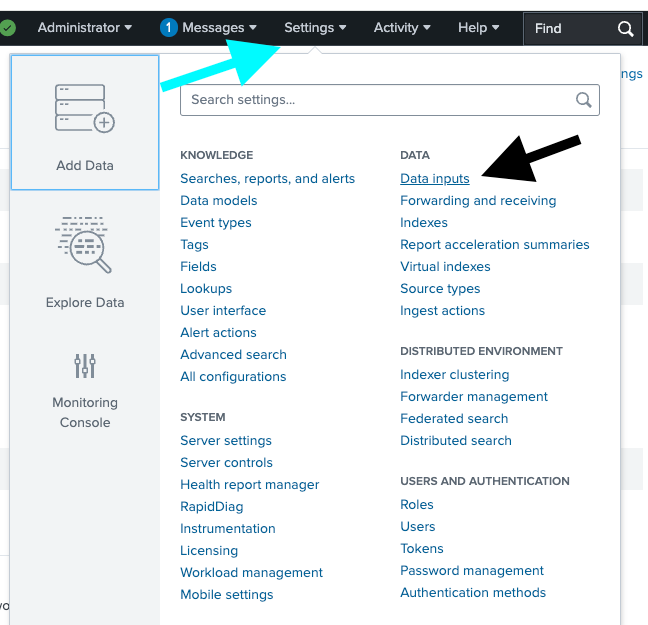
Step 1: Log into Splunk and navigate to Settings > Add Data > DATA Data Inputs.
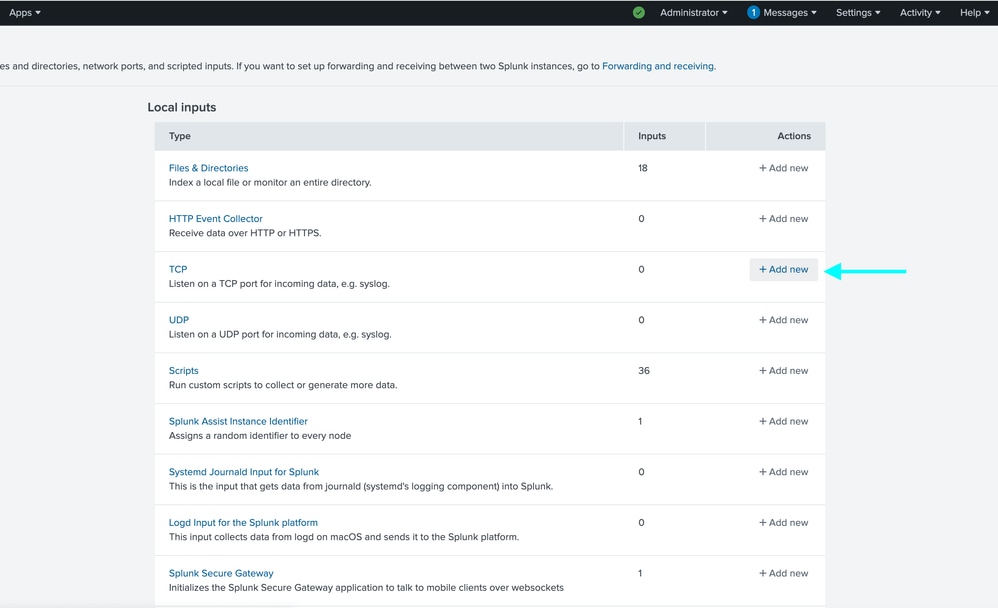
Step 2: Locate the UDP line and select +Add new.
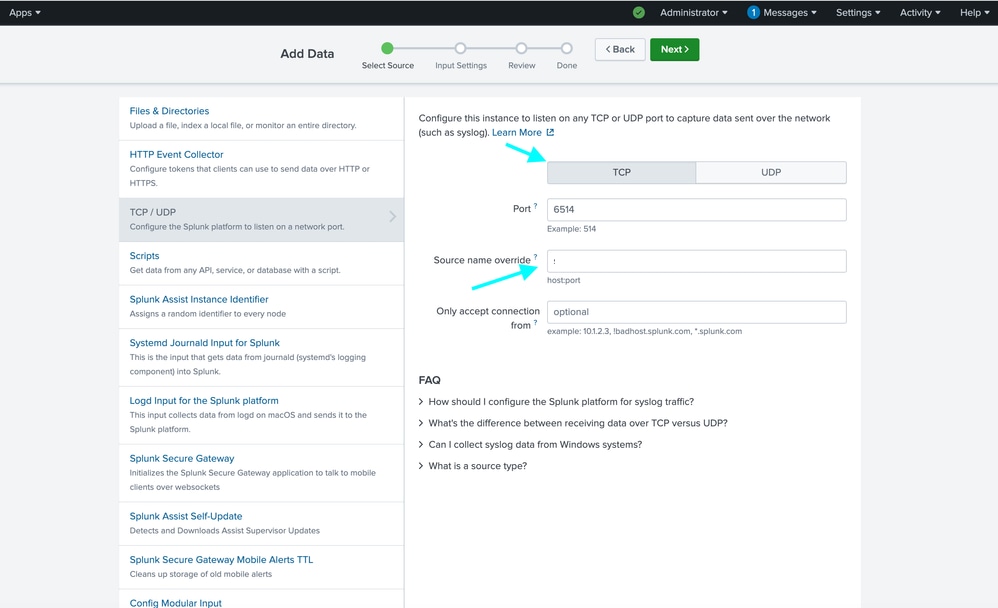
Step 3: On the new page select UDP, enter the receiving port such as 514 in the Port field.
Step 4: In the Source name override field, enter desired name of source.
Step 5: When complete, click the green Next > button on the top of the window.

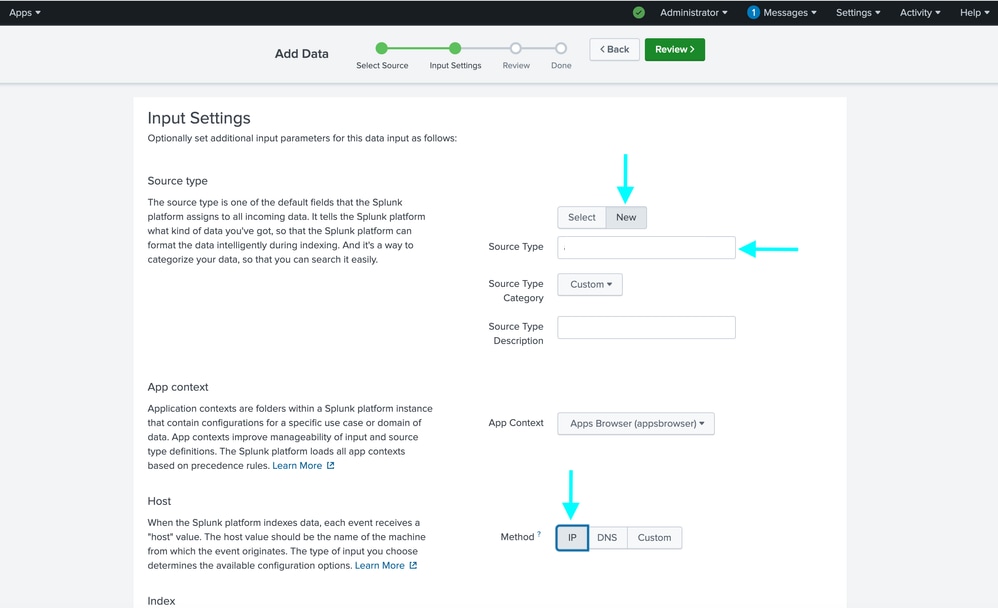
Step 6: On the next page, switch to New option locate the Source Type field and enter desired source .
Step 7: Select IP for the Method
Step 8: Click the green Review > button on the top of the screen.

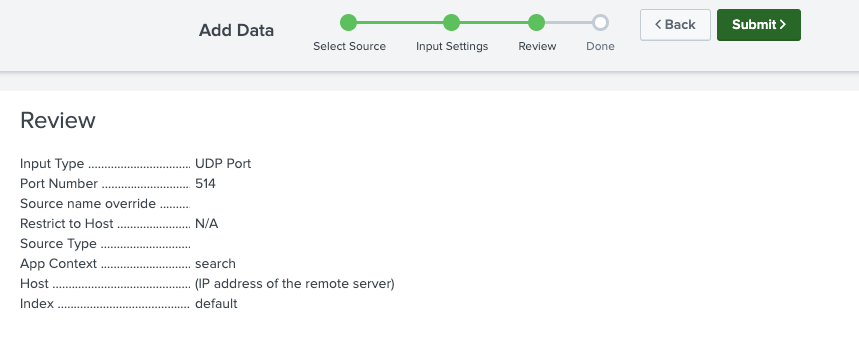
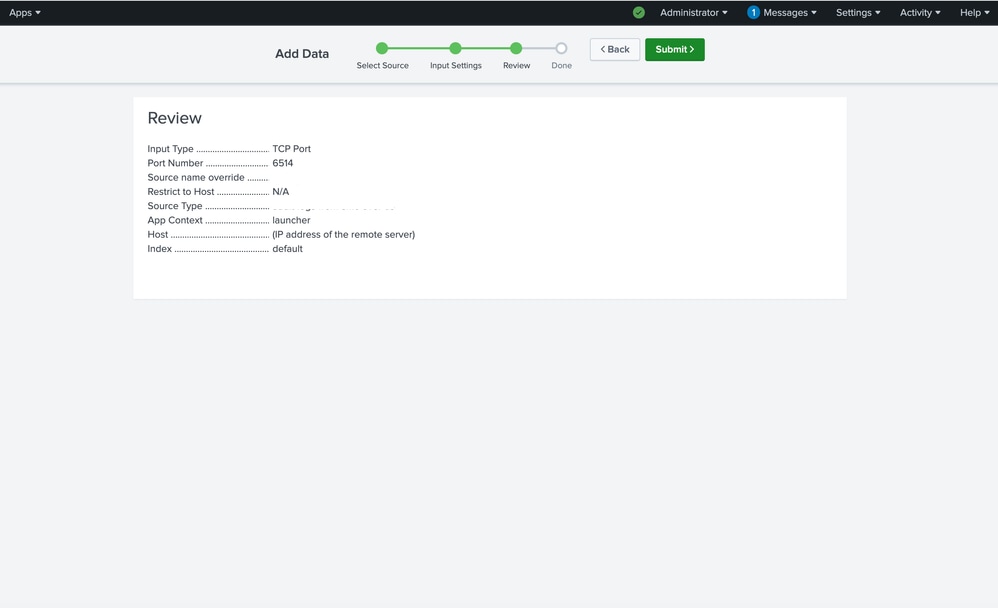
Step 9: On the next window, review your settings and edit if needed.
Step 10: Once validated, click the green Submit > button on the top of the window.
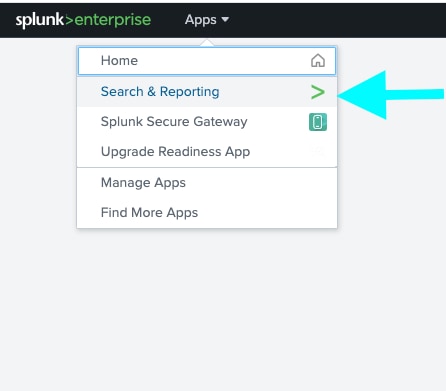
Step 11: Navigate to Apps > Search & Reporting in the Web UI.
Step 12: On the Search page, use the filter source="As_configured" sourcetype="As_configured" to find logs that have been received.
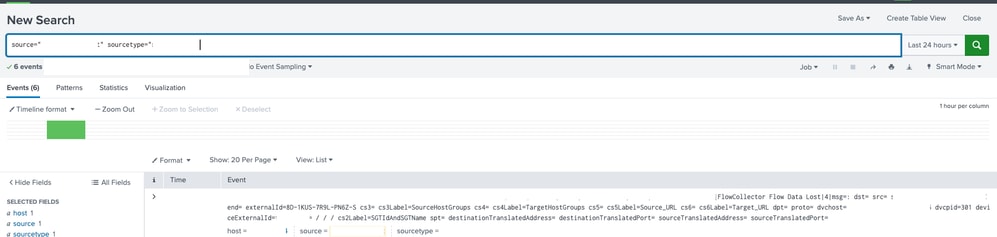

Note: For source see Step 4
For source_type see Step 6
Configure syslog on SNA over TCP port 6514 or custom defined port
1.Configuring Splunk to Receive SNA Audit Logs over TCP port
Step 1: In the Splunk UI, navigate to Settings > Add Data > DATA Data Inputs.
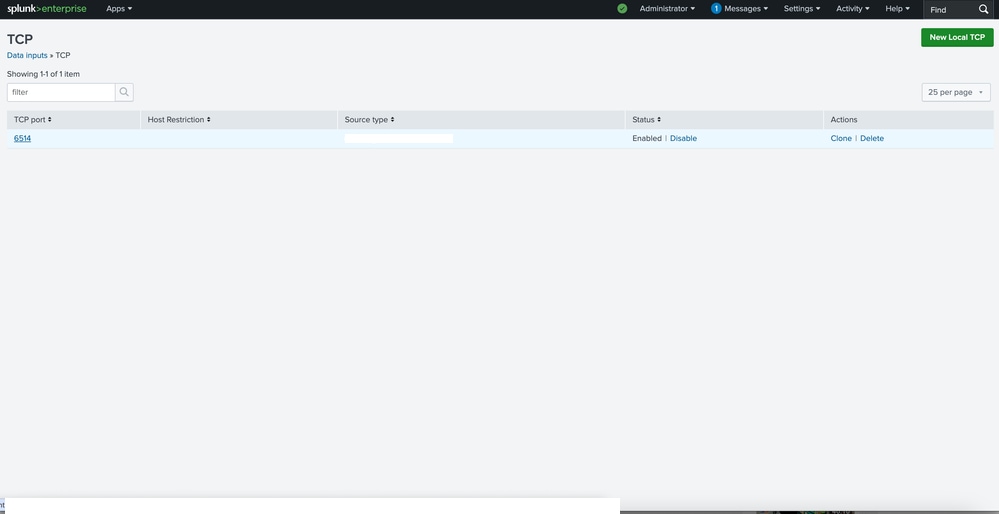
Step 2: Locate the TCP line and select + Add new.
Step 3: In the new window select TCP, enter the desired receiving port, in the example image port 6514, and enter "desired name" in the Source name override field.
Note: TCP 6514 is default port for syslog over TLS
Step 4: When complete, click the green Next > button on the top of the window.
Step 5: In the new window select New in the Source type section, enter desired name in the Source Type field.
Step 6: Select IP for the Method in the Host section.
Step 7: When complete select the green Review > button on the top of the window.
Step 8: On the next window, review your settings and edit if needed. Once validated click the green Submit > button on the top of the window.
2.Generate Certificate for Splunk
Step 1: Using a machine that has openssl installed, run the sudo openssl req -x509 -newkey rsa:4096 -keyout server_key.pem -out server_cert.pem -sha256 -days 3650 -subj /CN=10.106.127.4 command, replacing the example IP of 10.106.127.4 with the IP of the Splunk device. You are prompted twice to input a user defined pass phrase. In the examples, the commands are being ran from the command line of the Splunk machine.
user@examplehost: sudo openssl req -x509 -newkey rsa:4096 -keyout server_key.pem -out server_cert.pem -sha256 -days 3650 -subj /CN=10.106.127.4
..+...+..+.+...+..+............+...............+.+.....+.+......+..+.+...........+...+++++++++++++++++++++++++++++++++++++++++++++++++++++++++++++++++*..+.........+++++++++++++++++++++++++++++++++++++++++++++++++++++++++++++++++*..+......+..............+...+.+......+........+............................+..+...+....+...............+........+......+.+...+...+........+......+...+.+.....+...................+...........+......+.+.....+.........+....+.........+......+......+.....+.+........+............+.......+........+..........+........+....+..+....+......+.....+.............+.....+.......+........+......+.........+...+....+...+..+..........+.....+......+...+.........+.+.........+.....+......+.........+...............+............+....+.....+.+...+...+............+...............+.....+.+..............+.+.........+...+...+.........+.....+.+.....................+...+...........+.......+.....+...............+.........+....+......+...+...+.....+..........+..+................+.....................+.........+..+...+....+......+.................+...+.......+..+...............+......+.+.....+..........+.....+......+....+......+........+.......+....................+++++++++++++++++++++++++++++++++++++++++++++++++++++++++++++++++
....+.......+..+...+...+.+......+...+.........+............+.....+....+..+...+....+...+...+.........+...+..+.......+........+............+.+.....+....+.........+..+.........+....+..+....+........+...+.......+...+...+..+...+.+...+..+....+.....+.......+........+......+.+..+......+....+......+++++++++++++++++++++++++++++++++++++++++++++++++++++++++++++++++*.......+...+.....+++++++++++++++++++++++++++++++++++++++++++++++++++++++++++++++++*.......+.+......+..............+.........+.....................+.......+.....+....+..............+.........+.......+...+.......................+....+...+..+.+.........+.........+......+...........+...+...............+.........+.+......+.........+.....................+.....+.........+.......+...............+........+.+....................+.+..+.+....................+.+...........+...+.+...+.....+.............+...+..+...+....+++++++++++++++++++++++++++++++++++++++++++++++++++++++++++++++++
Enter PEM pass phrase:
Verifying - Enter PEM pass phrase:
-----
user@examplehost:
When the command completes, two files are generated. The server_cert.pem and server_key.pem files.
user@examplehost: ll server*
-rw-r--r-- 1 root root 1814 Dec 20 19:02 server_cert.pem
-rw------- 1 root root 3414 Dec 20 19:02 server_key.pem
user@examplehost:
Step 2: Switch to root user.
user@examplehost:~$ sudo su
[sudo] password for examplehost:
Step 3: Copy the newly generated certificate to the /opt/splunk/etc/auth/ .
user@examplehost:~# cat /home/examplehost/server_cert.pem > /opt/splunk/etc/auth/splunkweb.cer
Step 4: Append the spunkweb.cet file with private key.
user@examplehost:~# cat /home/examplehost/server_key.pem >> /opt/splunk/etc/auth/splunkweb.cer
Step 5: Change the ownership of splunk certificate.
user@examplehost:~# chown 10777:10777/opt/splunk/etc/auth/splunkweb.cer
Step 6: Change the permission for splunk certificate.
user@examplehost:~# chmod 600/opt/splunk/etc/auth/splunkweb.cer
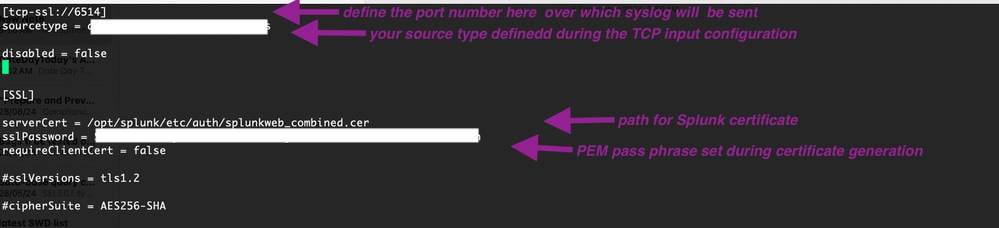
Step 7: create a new input.conf file.
user@examplehost:~# vim /opt/splunk/etc/system/local/inputs
Step 8: Verify the syslogs using search.


3.Configure Audit Log Destination on SNA
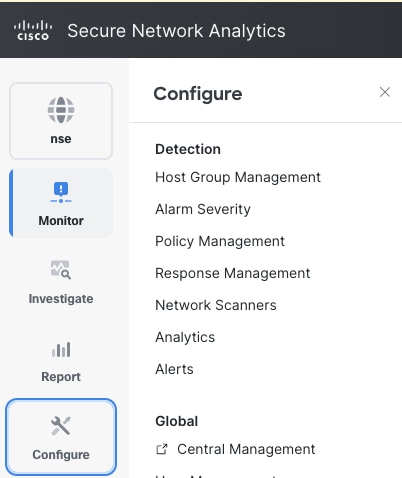
Step 1: Log in to SMC UI navigate to Configure > Central Management.
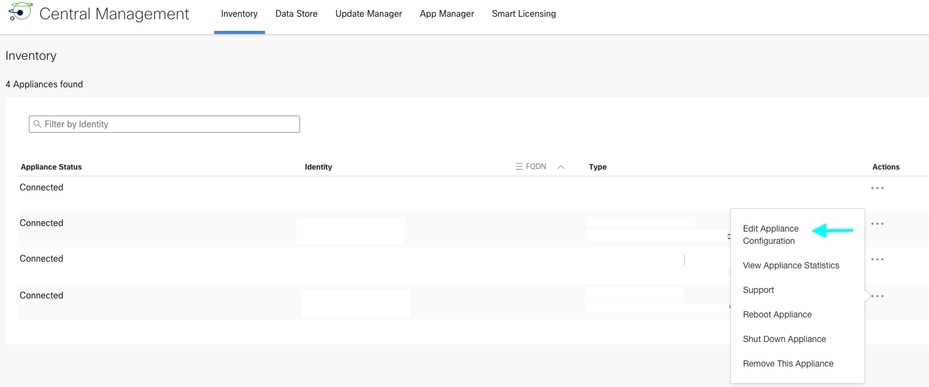
Step 2: Click ellipsis icon of your desired SNA appliance select Edit Appliance Configuration.
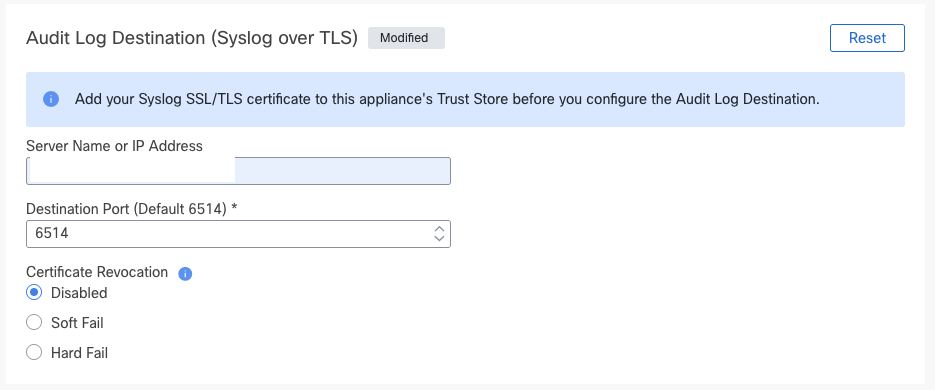
Step 3: Navigate to Network Services Tab and enter Audit Log Destination (Syslog over TLS) details.
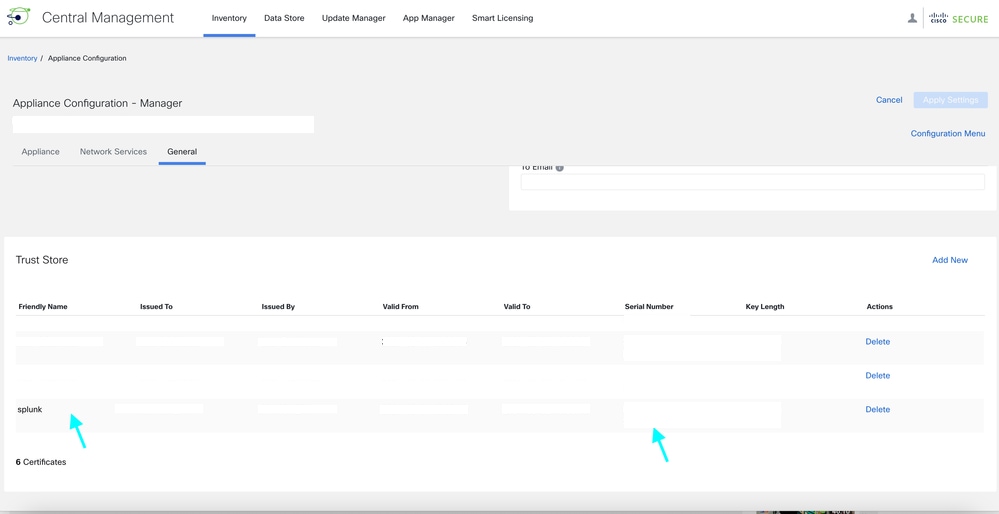
Step 4: Navigate to General tab, scroll down to the bottom Click Add new to upload the Splunk certificate created earlier named as server_cert.pem.
Step 5: Click Apply settings.

Troubleshoot
There could be complete gibberish showing up on search.

Solution :
Map the input to its correct source type.


 Feedback