Introduction
This document describes how to configure the Cisco Secure FTD to send security events to the Security Cloud Control (SCC) using the Secure Event Connector (SEC).
Prerequisites
Requirements
Cisco recommends that you have knowledge of these topics:
- Cisco Secure Firewall Threat Defense (FTD)
- Linux Command Line Interface (CLI)
Components Used
The information in this document is based on these software and hardware versions:
- Cisco Secure FTD 7.6
- Ubuntu Server version 24.04
The information in this document was created from the devices in a specific lab environment. All of the devices used in this document started with a cleared (default) configuration. If your network is live, ensure that you understand the potential impact of any command.
Configure
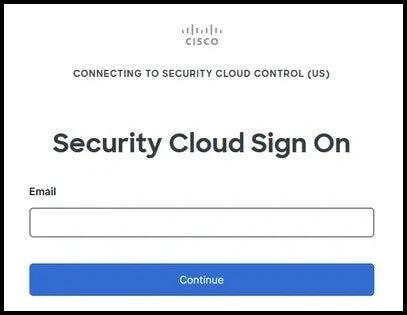
Step 1. Login to the SCC cloud portal:
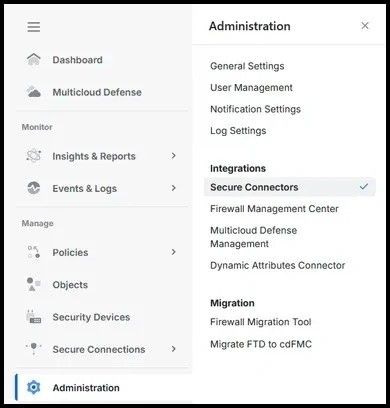
Step 2. From the left hand side menu, choose Administration and Secure Connectors:
Step 3. On the top right hand side, click the plus icon in order to onboard a new connector and choose Secure Event Connector:

Step 4. Use the steps to install and bootstrap the connector depending on the desired option between 'Using our VM', 'Using your own VM' or 'To an Existing SDC or SEC VM':
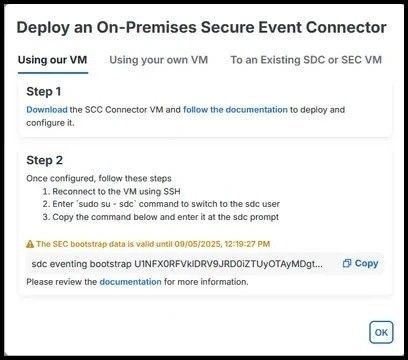
Step 5. A similar message is seen when the bootstrap is performed successfully:

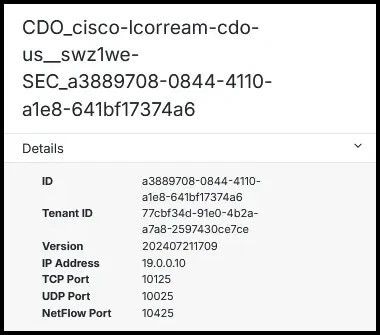
Step 6. Once the connector is deployed and bootstrapped, port information is visible in the SCC portal:
Step 7. On the Cisco Secure Firewall Management Center (FMC), navigate to Policies and then to Access Control. Choose the policy corresponding to the device(s) being onboarded.
Step 8. Choose More and then Logging:

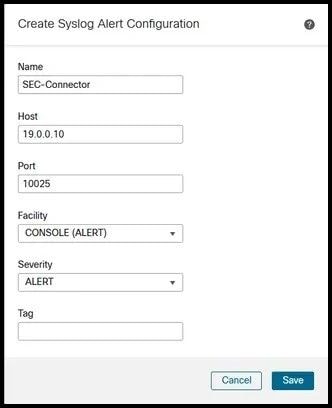
Step 9. Enable the Send using specific syslog alert option and add a new Syslog Alert. Use the Internet Protocol (IP) address and port information obtained from the SEC connector in the SCC portal:
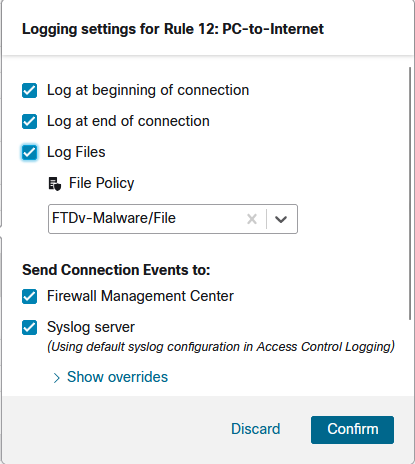
Step 10. Back in the Access Control Policy, modify the individual rules in order to send the events to the Syslog server:
Step 11. Deploy the changes made to the FTD in order to allow the firewall to start logging the events.
Verify
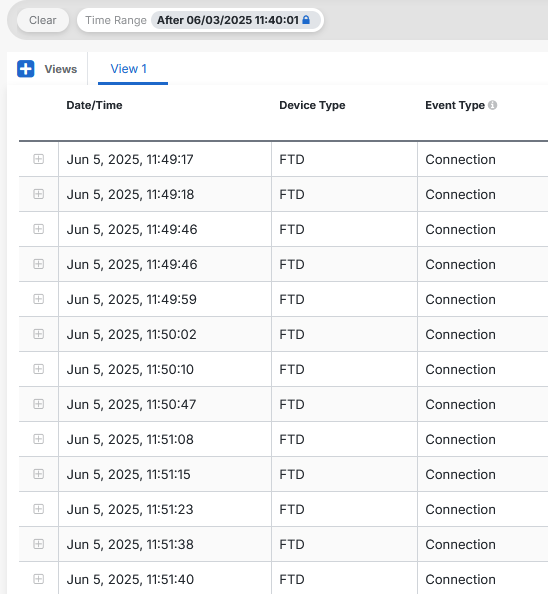
In order to verify that the changes were executed successfully and that event logging is taking place, navigate to Events & Logs and Event Logging in the SCC portal and confirm that events are visible:
Troubleshoot
On FTD, run a packet capture on the device using the management interface matching the traffic navigating to the SEC in order to capture the syslog traffic:
> capture-traffic

Please choose domain to capture traffic from:
  0 - eth0
  1 - Global

Selection? 0

Warning: Blanket capture may cause high CPU usage and reduced throughput, use selective filtering to reduce the impact.
Please specify tcpdump options desired.
(or enter '?' for a list of supported options)
Options: host 19.0.0.10 port 10025
Starting traffic capture, press ctrl + c to exit (Maximum 1,000,000 packets will be captured)
HS_PACKET_BUFFER_SIZE is set to 4.
tcpdump: can't parse filter expression: syntax error
Exiting.

> capture-traffic

Please choose domain to capture traffic from:
  0 - eth0
  1 - Global

Selection? 0

Warning: Blanket capture may cause high CPU usage and reduced throughput, use selective filtering to reduce the impact.
Please specify tcpdump options desired.
(or enter '?' for a list of supported options)
Options: host 19.0.0.10 and port 10025
Starting traffic capture, press ctrl + c to exit (Maximum 1,000,000 packets will be captured)
HS_PACKET_BUFFER_SIZE is set to 4.
10:43:00.191655 IP firepower.56533 > 19.0.0.10.10025: UDP, length 876
10:43:01.195318 IP firepower.56533 > 19.0.0.10.10025: UDP, length 1192
10:43:03.206738 IP firepower.56533 > 19.0.0.10.10025: UDP, length 809
10:43:08.242948 IP firepower.56533 > 19.0.0.10.10025: UDP, length 1170
From the SEC virtual machine, ensure that the virtual machine has internet connectivity. Run the command sdc troubleshoot, in order to generate a troubleshooting bundle which can be used to check the lar.log file for further diagnosis.


 Feedback