Introduction
This document describes troubleshooting steps for high Cloud Query Latency and Failure Rates on the Secure Endpoint Private Cloud Device.
Prerequisites
Requirements
Cisco recommends that you have knowledge of these topics:
- Secure Endpoint Private Cloud Device
- Basic Network Troubleshooting
Components Used
The information in this document is based on these software versions:
- Secure Endpoint Private Cloud 4.2.4_202410290303
The information in this document was created from the devices in a specific lab environment. All of the devices used in this document started with a cleared (default) configuration. If your network is live, ensure that you understand the potential impact of any command.
Background
The Secure Endpoint (SE) Private Cloud device tracks three key Cisco Cloud metrics:
- Cisco Cloud Query Latency – Measures the latency (in milliseconds) for both upstream and downstream communication between the device and the Cisco Cloud.
- Cisco Cloud Query Failure Rate – Displays the percentage of disposition queries that have failed.
- Cisco Cloud Query Total – Represents the number of queries per second the device is handling.
These metrics are available in the SE Private Cloud Administration Portal under Key Metrics.

Note: These metrics apply only to the Cloud Proxy mode of deployment, where the SE Private Cloud device functions as a proxy for cloud queries between your connectors and the Cisco Cloud.
Troubleshoot
A high Cloud Query Latency Rate can indicate that your network link is operating at or near capacity, which can also lead to an increased Cloud Query Failure Rate.
Here is an example of values requiring attention:
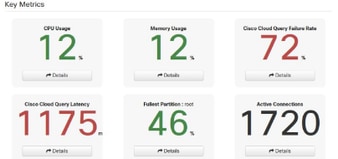 Values that need attention
Clicking "Details" provides a graphical representation of the metrics across various time ranges, enabling in-depth analysis.
Basic Troubleshooting Steps:
1. Ensure that the SE Private Cloud device has a stable network connection. Verify that no firewall rules are blocking traffic to Cisco Cloud services and that connectivity is permitted for all required IP addresses. Use this command to verify connectivity:
amp-ctl check –v connectivity
2. Monitor CPU, memory, and disk usage on the SE Private Cloud device. High resource usage can impact query processing speeds.
3. Measure the available Internet bandwidth and assess whether network congestion is contributing to delays. Additionally, check if any QoS devices are imposing restrictions or prioritizing other traffic, which can impact performance.
4. Analyze Cloud Query Volume by checking the Cisco Cloud Query Total metric to determine if a sudden spike in queries is overwhelming the system.
5. Verify that the nearest Cisco Cloud is being used to optimize latency. This configuration can be found in the SE Private Cloud Administration Portal under Configuration → Cisco Cloud → Cisco Cloud Configuration.
6. Perform a packet capture on the SE Private Cloud device while executing the Test Upstream Connection option. This option is available in the SE Private Cloud Administration Portal under Configuration → Cisco Cloud → Test Upstream Connection. Verify whether the test completes successfully. Repeat the test every two minutes for several iterations. Allow the packet capture to run for 10 minutes to collect sufficient data. Analyze the capture to assess network latency and identify potential issues.

Tip: If you are experiencing a 100% Cloud Query Failure Rate you can also re-register by clicking the green button to see if this corrects the problem.
If the issue persists after these troubleshooting steps, collect logs and metrics and reach out to Cisco TAC for further assistance.
 Feedback