Introduction
This document describes a comprehensive guide on how to effectively identify and troubleshoot packet drops in Cisco NCS55XX platforms.
Prerequisites
Requirements
There are no specific requirements for this document.
Components Used
This document applies to all NCS 5500 platforms utilizing Jericho1 or Jericho2 ASIC architectures.
The information in this document was created from the devices in a specific lab environment. All of the devices used in this document started with a cleared (default) configuration. If your network is live, ensure that you understand the potential impact of any command.
Background Information
Packet Drops
Packet drop refers to the situation where data packets traversing the network are intentionally or unintentionally discarded by the device, preventing them from reaching their intended destination.
Drop Location
For Debugging any kind of packet drop, you need to perform these steps:
1. Find out which Router in the topology is dropping packets.
2. Look for inputs packet counter or drop counter incrementing on interface.
Example show interface <>

Note: Commands were executed on an NCS 5500 within a controlled lab environment for testing and validation purposes.
RP/0/RP0/CPU0:NCS-5500#show interfaces TenGigE0/0/0/14
TenGigE0/0/0/14 is up, line protocol is up
Interface state transitions: 3
Hardware is TenGigE, address is fce4.f6ad.b038 (bia fce4.f6ad.b038)
loopback not set,
Last link flapped 2w2d
ARP type ARPA, ARP timeout 04:00:00
Last input 00:00:00, output 00:00:17
Last clearing of "show interface" counters never
5 minute input rate 0 bits/sec, 0 packets/sec
5 minute output rate 0 bits/sec, 0 packets/sec
49129 packets input, 4286647 bytes, 153 total input drops     <<  drops
0 drops for unrecognized upper-level protocol
Received 0 broadcast packets, 49129 multicast packets
0 runts, 0 giants, 0 throttles, 0 parity
0 input errors, 0 CRC, 0 frame, 0 overrun, 0 ignored, 0 abort
47637 packets output, 6144913 bytes, 0 total output drops
Output 4 broadcast packets, 47633 multicast packets
845 output errors, 0 underruns, 0 applique, 0 resets        <<<<  errors
0 output buffer failures, 0 output buffers swapped out
3 carrier transitions
RP/0/RP0/CPU0:NCS-5500#

Tip: For bundle interfaces and sub-interfaces, ensure you run this command on the bundle interface, sub-interfaces, and the corresponding physical interfaces.
3. Once it is confirmed that a drop or error counter is increasing, the next step is to identify the Network Processing Unit (NPU) associated with the affected interface.
Example: show controllers npu voq-usage interface all instance all location <>
RP/0/RP0/CPU0:NCS-5500#show controllers npu voq-usage interface all instance all location 0/0/cpu0
-------------------------------------------------------------------
Node ID: 0/0/CPU0
Intf         Intf     NPU NPU  PP   Sys   VOQ   Flow   VOQ    Port
name         handle    #  core Port Port  base  base   port   speed
             (hex)                                     type
----------------------------------------------------------------------
Hu0/0/0/5    8         0   0    1     1   1272   8360 local   100G
Hu0/1/0/2    2000088   0   1   17   857   1528   7464 remote  100G
Te0/0/0/14   1088      2   1   17   297   1728   6568 local    10G  << NPU2, PP Port:17
<SNIP>
4. Capture packets on the NPU hosting the interface. Locate the PP port in the output, ensuring it matches the PP port identified in step 1.
Example: show controllers fia diagshell <NPU_NUMBER> "diag last" location <LC_LOCATION>
RP/0/RP0/CPU0:NCS-5500#show controllers fia diagshell 2 "diag last" location 0/0/CPU0
Node ID: 0/0/CPU0
R/S/I: 0/0/2

Core 0:
Last packet information: is_valid=0 tm_port=253
pp_port=240 src_syst_port=253 port_header_type=tm packet_size=0
Packet start, offset in bytes:
00: 4e415000 00134e41 50000001 8100e602 876f00fd 0606c00e 00000000 000180c2
20: 00000efc e4f6adb0 3888cc02 0704fce4 f6adb487 04100554 656e4769 6745302f
40: 302f302f 31340602 00780a0a 4e43532d 35353038 2d410c10 20372e39 2e322c20
60: 4e43532d 35353030 08000e04 00100010 100c0501 0a130101 02000000 d8001018
Core 1:
Last packet information: is_valid=1 tm_port=17
pp_port=17 src_syst_port=297 port_header_type=eth packet_size=83        << pp_port: 17
Packet start, offset in bytes:
00: 0180c200 000e40a6 b79e2552 88cc0207 0440a6b7 9e255204 070340a6 b79e2552
20: 06020079 fe190080 c2098000 00000064 00000000 00000002 00000000 000000fe
40: 060080c2 0b8800fe 080080c2 0c006189 06000000 00000000 00000000 00000000
60: 00000000 00000000 00000000 00000000 00000000 00000000 00000000 00000000
RP/0/RP0/CPU0:NCS-5500#
Tip: You can decode the hexadecimal data using a Packet Decoder tool to thoroughly analyze and interpret network traffic.
5. Check NPU stats: Identify the NPU number associated with your outgoing or incoming interface, then execute this command to examine the data path counters
Example: show controllers fia diagshell <NPU_NUMBER> "diag counter g c" location <LC_Location>
Note: Carefully monitor if any highlighted counters are incrementing.
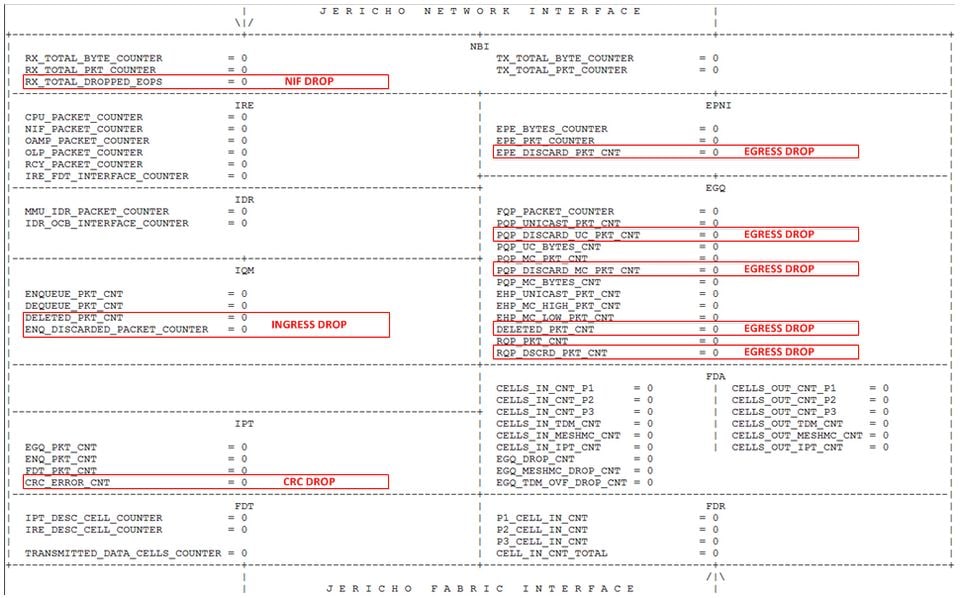
6. Review the statistics from each processing stage of the NPU:
Example: show controller npu stats counters-all instance <NPU_NUMBER> loc <LC_Location>
RP/0/RP0/CPU0:NCS-5500#show controllers npu stats counters-all instance 2 location 0/0/CPU0
FIA Statistics Rack: 0, Slot: 1, Asic instance: 0
Per Block Statistics:

Ingress:
NBI RX:
  RX_TOTAL_BYTE_COUNTER          = 987134
  RX_TOTAL_PKT_COUNTER           = 7117

IRE:
  CPU_PACKET_COUNTER             = 0
  NIF_PACKET_COUNTER             = 7117
  OAMP_PACKET_COUNTER            = 16976
  OLP_PACKET_COUNTER             = 0
  RCY_PACKET_COUNTER             = 23081
  IRE_FDT_INTRFACE_CNT           = 0

IDR:
  MMU_IDR_PACKET_COUNTER         = 3037
  IDR_OCB_PACKET_COUNTER         = 0

IQM:
  ENQUEUE_PKT_CNT                = 52073
  DEQUEUE_PKT_CNT                = 52073
  DELETED_PKT_CNT                = 0
  ENQ_DISCARDED_PACKET_COUNTER   = 0

IPT:
  EGQ_PKT_CNT                    = 35207
  ENQ_PKT_CNT                    = 52073
  FDT_PKT_CNT                    = 16976
  CFG_EVENT_CNT                  = 49036
  CFG_BYTE_CNT                   = 5313772

FDT:
  IPT_DESC_CELL_COUNTER          = 16976
  IRE_DESC_CELL_COUNTER          = 0
  TRANSMITTED_DATA_CELLS_COUNTER = 16976


Egress:
FDR:
  P1_CELL_IN_CNT                 = 17538
  P2_CELL_IN_CNT                 = 0
  P3_CELL_IN_CNT                 = 0
  CELL_IN_CNT_TOTAL              = 17538

FDA:
  CELLS_IN_CNT_P1                = 17538
  CELLS_IN_CNT_P2                = 0
  CELLS_IN_CNT_P3                = 0
  CELLS_IN_TDM_CNT               = 0
  CELLS_IN_MESHMC_CNT            = 0
  CELLS_IN_IPT_CNT               = 35317
  CELLS_OUT_CNT_P1               = 17538
  CELLS_OUT_CNT_P2               = 0
  CELLS_OUT_CNT_P3               = 0
  CELLS_OUT_TDM_CNT              = 0
  CELLS_OUT_MESHMC_CNT           = 0
  CELLS_OUT_IPT_CNT              = 35317
  EGQ_DROP_CNT                   = 0
  EGQ_MESHMC_DROP_CNT            = 0

EGQ:
  FQP_PACKET_COUNTER             = 52635
  PQP_UNICAST_PKT_CNT            = 52635
  PQP_DSCRD_UC_PKT_CNT           = 0
  PQP_UC_BYTES_CNT               = 5750183
  PQP_MC_PKT_CNT                 = 0
  PQP_DSCRD_MC_PKT_CNT           = 0
  PQP_MC_BYTES_CNT               = 0
  EHP_UNICAST_PKT_CNT            = 52635
  EHP_MC_HIGH_PKT_CNT            = 0
  EHP_MC_LOW_PKT_CNT             = 0
  DELETED_PKT_CNT                = 0
  EHP_MC_HIGH_DSCRD_CNT          = 0
  EHP_MC_LOW_DSCRD_CNT           = 0
  ERPP_LAG_PRUNING_DSCRD_CNT     = 0
  ERPP_PMF_DISCARDS_CNT          = 0
  ERPP_VLAN_MBR_DSCRD_CNT        = 0

EPNI:
  EPE_BYTES_COUNTER              = 5459532
  EPE_PKT_COUNTER                = 52635
  EPE_DSCRD_PKT_CNT              = 0

NBI TX:
  TX_TOTAL_BYTE_COUNTER          = 2315363
  TX_TOTAL_PKT_COUNTER           = 15053
RP/0/RP0/CPU0:NCS-5500#
7. Refer to the trap statistics to determine if a packet has been dropped or redirected to the CPU.
Example: show controllers npu stats traps-all instance <NPU_NUMBER> loc <LC_Location>
RP/0/RP0/CPU0:NCS-5500#show controllers npu stats  traps-all instance 2 location 0/0/CPU0


Trap Type                                     NPU  Trap TrapStats   Policer Packet               Packet

                                              ID    ID      ID              Accepted             Dropped
============================================================================================================================
RxTrapMimDiscardMacsaDrop (IRB)               2    1    0x1         32045   0                    0
RxTrapMimDiscardMacsaSnoop(dot1x)             2    3    0x3         32020   0                    53    <<< Drop
RxTrapMimSaMove(CFM_DOWM_MEP_DMM)             2    6    0x6         32039   0                    0
<SNIP>
RP/0/RP0/CPU0:NCS-5500#
8. For packets that are not marked as dropped in the trap counters, review the SPP counters to check for any potential drops.
Example:show spp node-counters loc <LC/RP location>
RP/0/RP0/CPU0:NCS-5500#show spp node-counters location 0/0/CPU0
socket/rx
                ether raw pkts:         4098990
-------------------------------
socket/tx
                       ce pkts:          923918
-------------------------------
fretta/classify
 forwarded NPU packet to NetIO:         3536836
 forwarded CPU packet to NetIO:          102051
  forwarded NPU packet to SPIO:          360025
      dropped in classify node:            1638 <<<
  lnx l2 drop in classify node:            1637
              port-mapper drop:               1
              <SNIP>
-------------------------------
client/inject
        pkts injected into spp:          923728
  NetIO->NPU injected into spp:          461604
  NetIO->CPU injected into spp:          102132
                         <SNIP>
                          LACP:          128529
                          LLDP:          231463
-------------------------------
cfm_off_tx_node
              Hostname updated:               1
-------------------------------
pkt_classrx
      Other punt traffic to XR:         3998476
            LPTS: ICMPv4 to XR:             119
             LPTS: ARP request:             127
              Total Pkts to XR:         3998912
   Total Pkts punted to RP Lnx:             190
               LPTS: ARP reply:             190
      Total Pkts to both dests:             190
-------------------------------
client/punt
              punted to client:         3998861
no client found - send to defa:              51
-------------------------------
RP/0/RP0/CPU0:NCS-5500#
9. If no traps are observed incrementing, proceed to examine the Virtual Output Queue (VOQ) statistics.
Example:
show controllers npu voq-usage interface <interface> instance <NPU_NUMBER> loc <LC_Location>
show controllers npu stats voq base <voq-base> instance <NPU_NUMBER> location <LC_Location>
RP/0/RP0/CPU0:NCS-5500#show controllers npu voq-usage interface tenGigE 0/0/0/14 instance 2 location 0/0/CPU0
-----------------------------------------------------------------
Node ID: 0/0/CPU0
Intf         Intf     NPU NPU  PP   Sys   VOQ   Flow   VOQ    Port
name         handle    #  core Port Port  base  base   port   speed
             (hex)                                     type
----------------------------------------------------------------------
Te0/0/0/14   1088      2   1   17   297   1728   6568 local    10G
RP/0/RP0/CPU0:NCS-5500#

RP/0/RP0/CPU0:NCS-5500#show controllers npu stats voq base 1728 instance 2 loc 0/0/cpu0
Fri Jun 13 01:45:30.348 UTC

Location        =     0/0/CPU0
Asic Instance     =            2
VOQ Base          =         1728
       ReceivedPkts    ReceivedBytes   DroppedPkts     DroppedBytes
-------------------------------------------------------------------
Core-0:
TC_0 = 0               0               0               0
TC_1 = 0               0               0               0
TC_2 = 0               0               0               0
TC_3 = 0               0               0               0
TC_4 = 0               0               0               0
TC_5 = 0               0               0               0
TC_6 = 0               0               0               0
TC_7 = 47929           7570783         0               0
<SNIP>
RP/0/RP0/CPU0:NCS-5500#
Information Required to Open a Case with TAC
Tip: Run the commands mentioned multiple times at regular intervals to actively monitor and identify if any counters, such as errors, drops, or overruns, are incrementing.
Please gather all the commands mentioned in this document, along with the these additional commands for comprehensive troubleshooting:
show drops all ongoing location <LC_Location>

Caution: For certain versions of Jericho1, the command used is show drops-all ongoing location <LC_Location>
show tech -support
show captured packets ingress location <LC_Location>
Related Information
NCS 5500: Life of a Packet(Transit, Punt/Inject, Ping Path)
Cisco Technical Support & Downloads
 Feedback