Introduction
This document describes how to configure Agent Availability Alerts in AppDynamics and troubleshoot issues.
Prerequisites
Requirements
- Java/Machine/Database Agent reporting availability metrics to controller.
- Permissions to create HeathRule and Policies.
- AppDynamics Controller (SaaS or On-Prem).
Components Used
The information in this document was created from the devices in a specific lab environment. All of the devices used in this document started with a cleared (default) configuration. If your network is live, ensure that you understand the potential impact of any command.
Background Information
In a digital-first landscape, uninterrupted application performance is essential — not just for user satisfaction, but for business continuity and reputation. AppDynamics delivers powerful observability by collecting critical telemetry from every corner of your stack. But what happens when the very agents responsible for this visibility go dark? Without timely detection of agent outages, your observability is compromised, leaving you blind to emerging issues and potential outages.
Problem Statement
When AppDynamics agents (App Agents or Machine Agents) stop reporting, you lose real-time insight into application health, performance, and infrastructure status. This blind spot can result from agent crashes, improper configurations, network failures, or resource exhaustion. The consequences are significant:
- Loss of Observability: Gaps in monitoring data eliminate your ability to proactively detect, diagnose, and resolve performance or availability issues, leaving critical blind spots in your environment.
- Slower Incident Response: Without timely alerts, outages or degradations can persist unnoticed until they impact end users, resulting in longer downtime and increased mean time to resolution.
- Compliance and Audit Vulnerabilities: Incomplete monitoring records can undermine regulatory compliance and make it difficult to demonstrate audit readiness, exposing the organization to potential penalties.
- Business and Customer Impact: Undetected outages or performance issues can degrade the user experience, diminish trust, negatively impact organization reputation, and lead to direct revenue loss.
Agent Visibility Importance
1. Preserving End-to-End Visibility:
Agent availability alerts ensure you are immediately notified when an agent stops reporting, allowing you to restore monitoring before critical gaps emerge. This is foundational for maintaining end-to-end observability across distributed systems.
2. Proactive Incident Management:
Automated alerts enable teams to react to monitoring gaps before they escalate into business-impacting outages. Early detection means faster remediation and minimized downtime.
3. Supporting Compliance and Governance:
Continuous monitoring is often required for regulatory compliance. Agent availability alerts help you maintain complete monitoring records and demonstrate adherence to operational standards.
4. Scaling with Confidence:
As environments grow in size and complexity, manual agent checks become impractical. Automated agent availability alerts ensure observability at scale, flagging gaps across all nodes and services.
5. Reducing False Positives:
AppDynamics allows you to fine-tune health rules and use qualifiers (like SUM or value over a time window) to avoid unnecessary alerts from transient disconnects or brief network issues. This ensures you are only alerted when real gaps in observability occur.
Configure
Setting up agent availability alerts in AppDynamics involves three main steps: creating a health rule, defining an action, and linking them with a policy.
Step 1: Create a Health Rule
- Go to the AppDynamics Controller UI.
- Navigate to Alert & Respond and select Health Rules.
- Click the + button to add a new health rule.
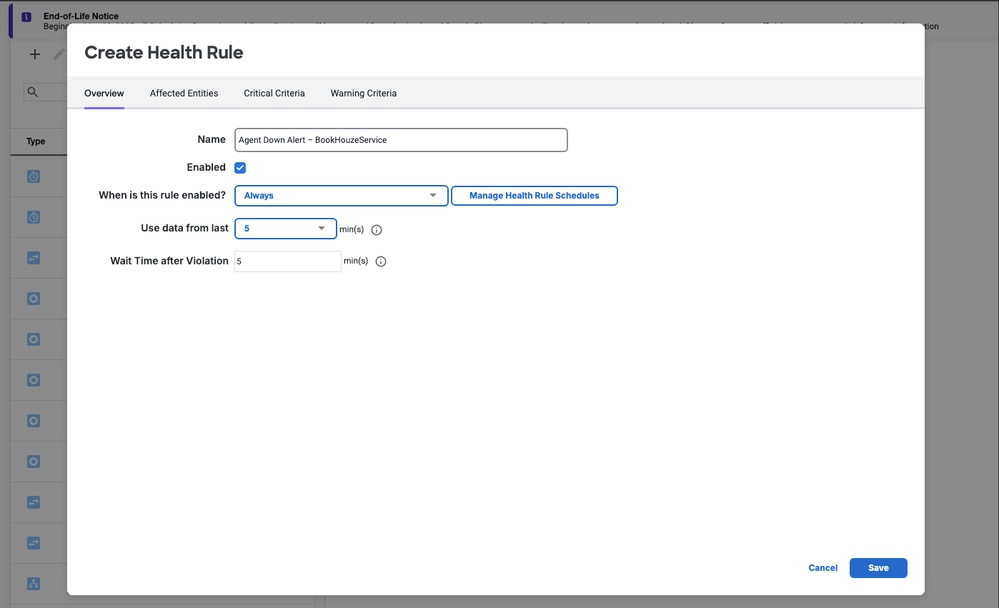
- Name your rule (such as Agent Down Alert – BookHouzeService):
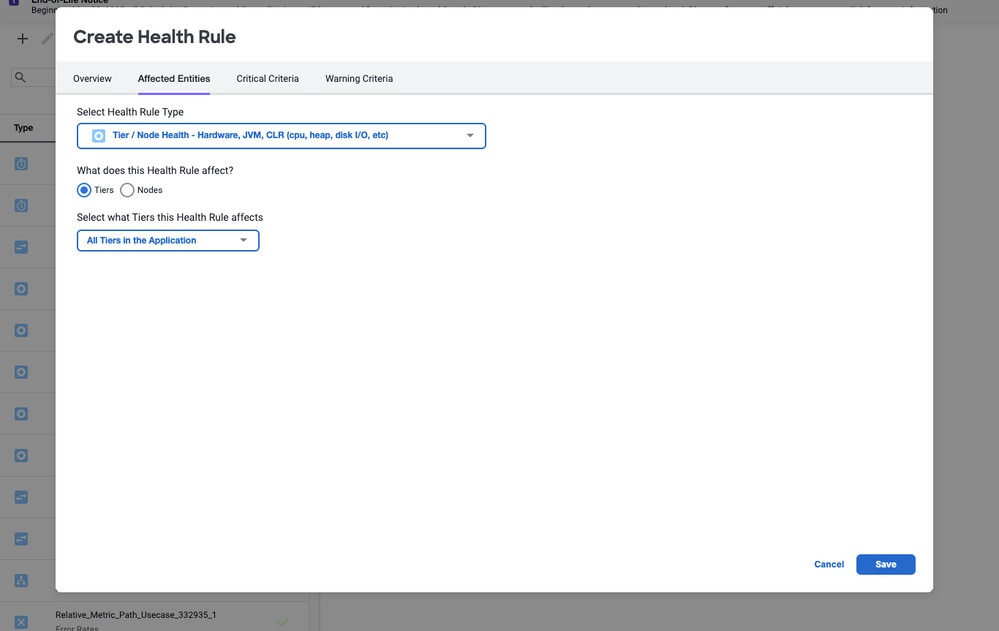
- In the Affected Entities section, select the nodes or tiers you want to monitor:
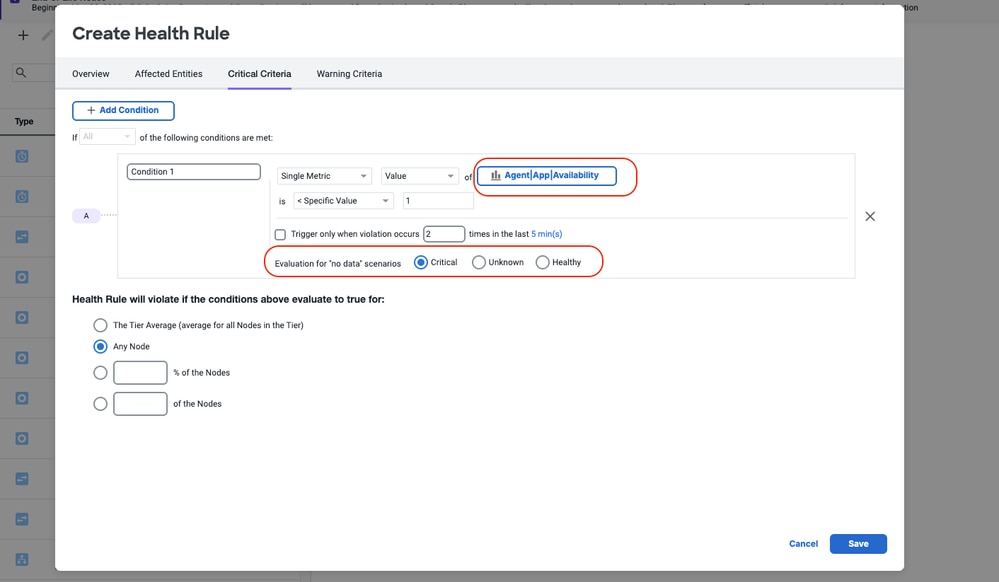
- In the Critical Criteria section, set the metric path:
- For App Agent: Agent|App|Availability
- For Machine Agent: Hardware Resources|Machine|Availability
- For Database Agent: DB|KPI|DB Availability
(Utilize Metrics Browser to explore and verify these paths)
- Set the condition to trigger when the value is less than 1 (< 1). This means the alert fires if the agent is not reporting.
- Ensure the Evaluate to true on no data option is checked as Critical to catch cases where the agent stops sending metrics entirely.

Tip: If your application experiences idle periods (no traffic), the agent could unload and appear down. Consider adjusting your application is idle timeout settings or fine-tuning the health rule evaluation window to avoid false positives.
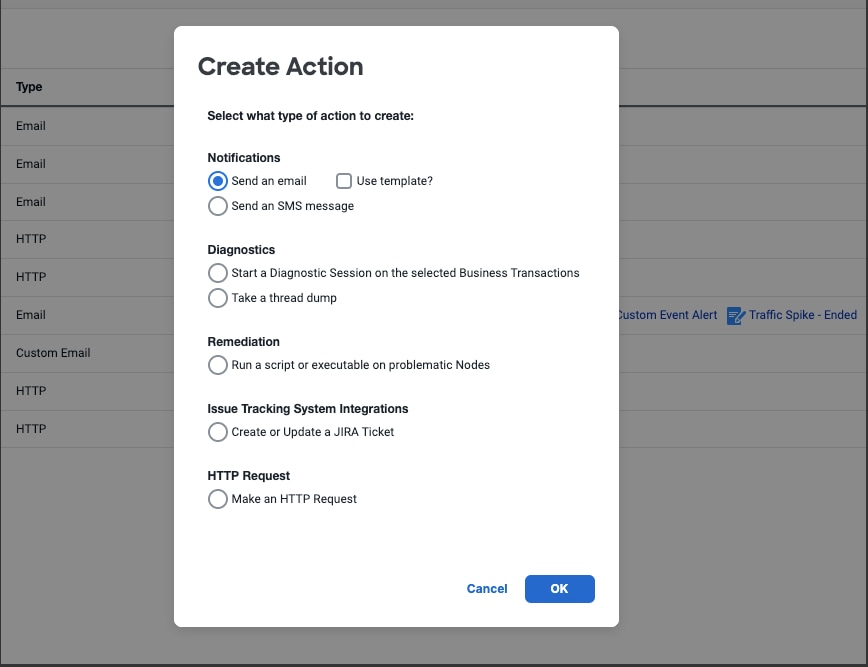
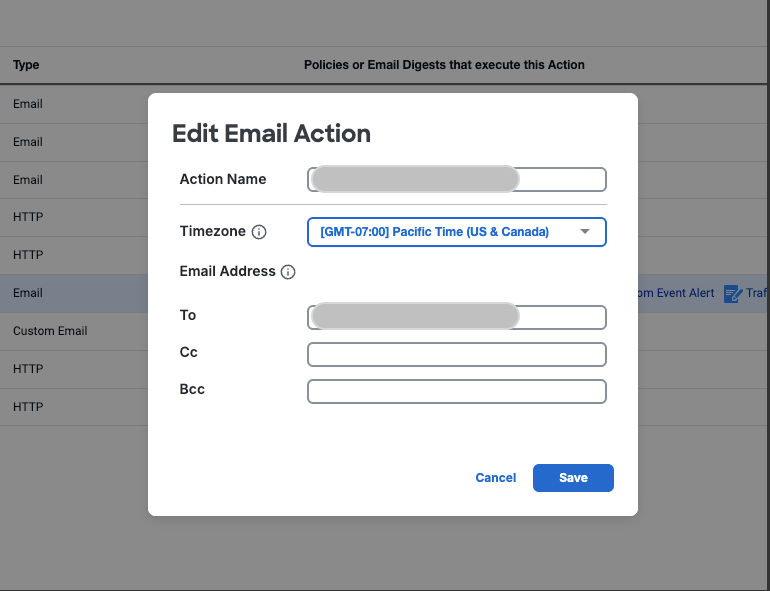
Step 2: Create an Action
- Go to Alert & Respond > Actions.
- Create an action, such as sending an email notification or invoking a webhook.
- Specify the recipients or integration endpoints for your alert.
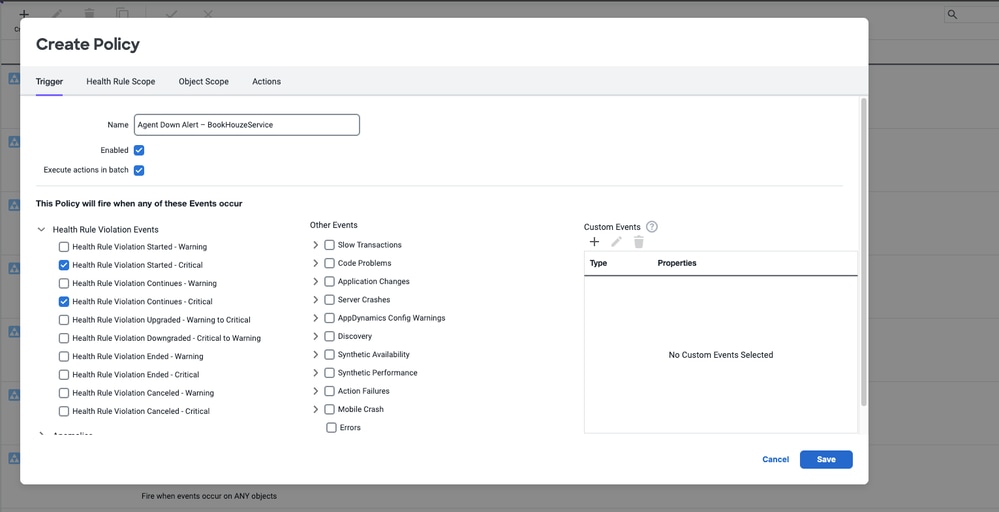
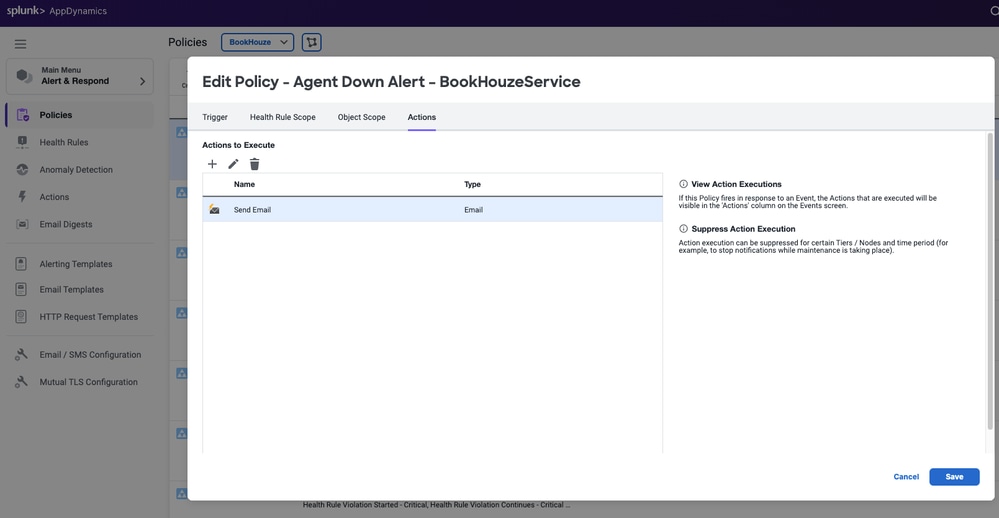
Step 3: Create a Policy
- Go to Alert & Respond > Policies.
- Create a new policy and select the health rule you created:
- Assign the action to this policy:
Now, whenever an agent stops reporting, AppDynamics automatically notifies your team, allowing for rapid investigation and remediation.
Verify
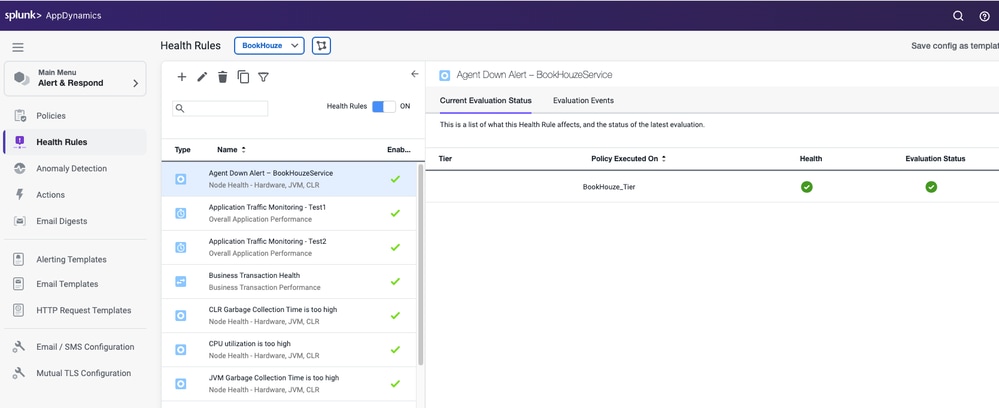
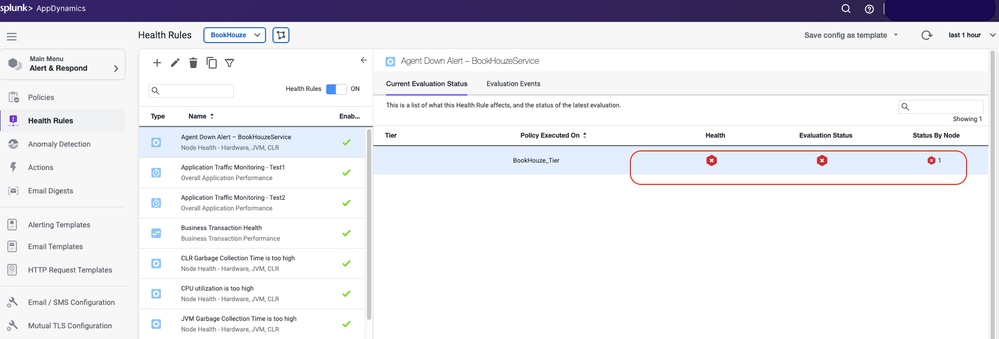
Step 1: Check Health Rule Evaluation Status
- Navigate to Health Rules:
Go to Alert & Respond > Health Rules in the AppDynamics Controller.
- Locate Your Rule:
Find your Agent Availability Health Rule in the list.
- Status Indicator:
Look for the status icon or evaluation summary next to your rule. A green checkmark or OK status indicates that it is being evaluated; a warning or error indicate that there is a configuration issue.
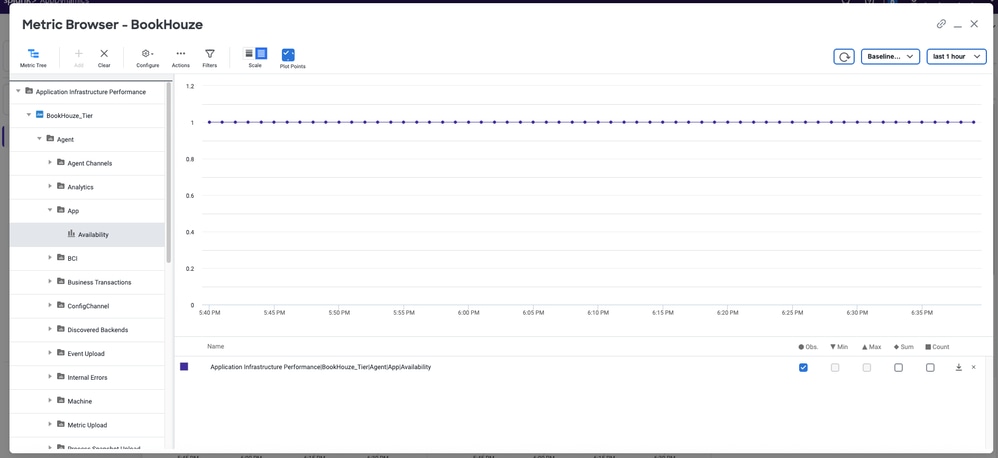
Step 2: Use the Metric Browser
- Open Metric Browser:
Go to Monitor > Metric Browser.
- Find the Availability Metric:
Drill down to Agent|App|Availability or Agent|Machine|Availability for your target node or tier.
Step 3: Simulate an Agent Down Scenario
- Stop the Agent:
Temporarily stop the AppDynamics agent service on a test node.
- Wait for Evaluation:
Allow enough time for the health rule evaluation window to pass.
- Check for Alert:
See if the health rule violation appears in the UI and if your configured action (such as email, webhook) is triggered. 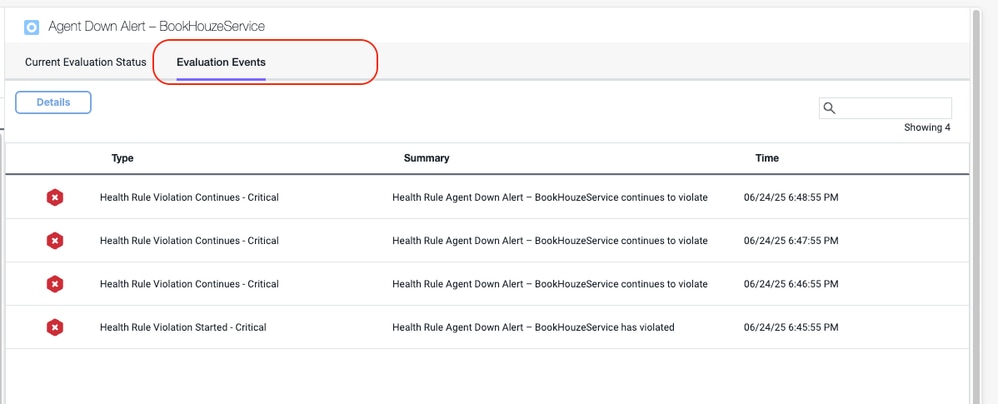
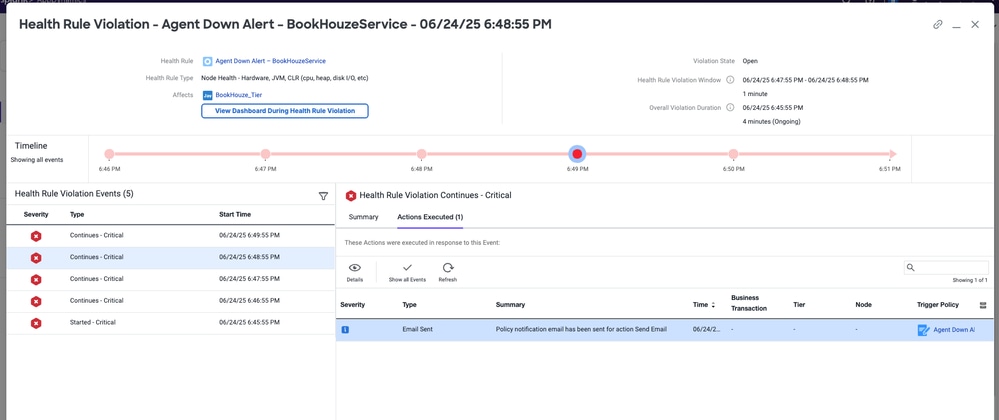
Step 4: Review Alert & Respond Dashboard
- Navigate to Alert & Respond > Actions and Policies:
Confirm that the action and policy linked to your health rule show recent activity or trigger logs.
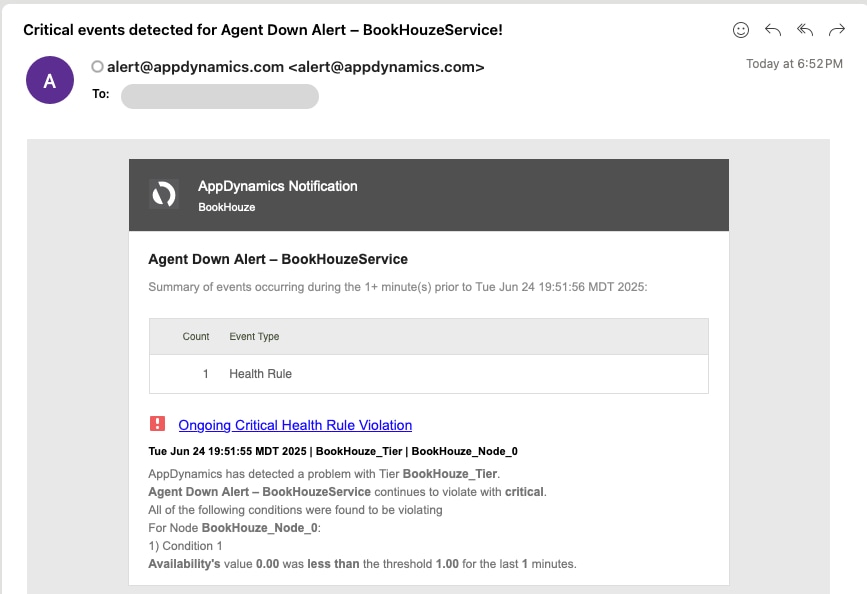
Step 5: Check Notification Delivery
- Verify email/webhook:
Ensure you receive the alert in your inbox or endpoint.
- Review alert content:
The alert message must reference the correct health rule and affected node/tier.

Validate Checklist:
√ Health Rule status is OK or actively evaluating.
√ Recent health rule evaluations and (if applicable) violations are visible in the UI.
√ Metric Browser shows real-time data for the availability metric.
√ Simulated agent down scenario triggers a health rule violation and alert.
√ The alert is received via the configured notification channel.
These validation steps help ensure your Agent Availability Alert is not only properly configured but also actively monitored and ready to notify you the moment an agent goes offline. This simple routine can prevent unexpected monitoring blind spots and strengthen your overall observability strategy.
Troubleshoot
Even with the best setup, sometimes alerts do not fire when you expect them to. Here is a practical checklist to help you troubleshoot if your Agent Availability Alerts are not working in AppDynamics:
| Category |
Troubleshooting Steps |
|
Check the Health Rule Configuration
|
- Metric Path: Double-check that you are using the correct metric path (Agent|App|Availability or Agent|Machine|Availability).
- Condition Logic: Make sure the alert condition is set to trigger when the value is less than 1 (< 1).
- Evaluation Window: If your evaluation window is too short or too long, it can cause missed or delayed alerts. Adjust as needed.
- Evaluate to true on no data: Ensure this option is enabled so the rule triggers even if the agent stops sending data entirely.
|
|
Verify the Action and Policy
|
- Action Configuration: Confirm that your action (such as email, webhook) is correctly set up and points to the right recipients or endpoints.
- Policy Linkage: Make sure your health rule is actually linked to the action via a policy.
- Policy Status: Check that the policy is enabled and not paused or disabled.
|
|
Test the Alert End-to-End
|
- Simulate an Agent Down: Stop or disconnect an agent to see if the health rule triggers and the alert is sent.
- Check Notification Channels: Verify that your email, sms, or webhook endpoints are working and not blocked by spam filters or firewalls.
|
|
Review AppDynamics Logs and Dashboards
|
- Controller Logs: Look for errors or warnings in the AppDynamics Controller logs related to alerting or health rules.
- Alert & Respond Dashboard: Use the AppDynamics UI to review recent health rule violations and actions triggered.
|
|
Check Agent and Network Health
|
- Agent Status: Ensure the agent is actually down or not reporting. Sometimes the agent is running but not sending data due to network issues.
- Network Connectivity: Make sure there is no network partition or firewall blocking communication between the agent and the controller.
|
|
Common Pitfalls
|
- Application Pool Idle Timeouts: For web apps, idle timeouts can cause agents to unload. Adjust settings or extend the evaluation window to avoid false negatives.
- Multiple Controllers: If you have multiple AppDynamics controllers, verify you are checking the right one.
|
Pro Tip: Keep a test health rule and policy in a non-production environment so you can safely experiment and verify alerting behavior after any configuration changes or upgrades.
These troubleshooting steps help you quickly identify and resolve most issues with Agent Availability Alerts in AppDynamics — ensuring your monitoring remains reliable and your team stays ahead of outages.
Conclusion
Agent availability alerts are a cornerstone of reliable observability in AppDynamics. By proactively detecting and responding to agent outages, you maintain continuous visibility, accelerate incident response, and safeguard your business against the risks of undetected outages. In a world where every second of downtime counts, these alerts empower teams to stay ahead of outages and deliver the resilient digital experiences users expect.
Need Further Assistance
If you have a question or are experiencing issues, please reach out to AppDynamics Support and include details such as error messages, configuration information, or relevant logs to help expedite troubleshooting.
Related Information
 Feedback