Securing Cloud-Native Applications - Azure Design Guide
Available Languages
Bias-Free Language
The documentation set for this product strives to use bias-free language. For the purposes of this documentation set, bias-free is defined as language that does not imply discrimination based on age, disability, gender, racial identity, ethnic identity, sexual orientation, socioeconomic status, and intersectionality. Exceptions may be present in the documentation due to language that is hardcoded in the user interfaces of the product software, language used based on RFP documentation, or language that is used by a referenced third-party product. Learn more about how Cisco is using Inclusive Language.
Over the last decade, most businesses have undergone digitization at a massive scale. During this period of time, the biggest bottleneck to a more widespread digitization was the ability to scale and lack of any standard approach to architect an agile and decoupled application. As applications grew bigger, it became increasingly challenging to update current features and release newer ones without breaking the existing functionalities. There was no doubt about the merits of digitization, but the challenge was in scaling it quickly and in a cost and resource efficient manner.
Therefore, the evolution of applications and the ecosystem for application development was the need of the hour. This necessity was addressed to an extent by the advent of public cloud infrastructures. Public cloud service providers solved a lot of these problems, for example, while provisioning a replacement server took weeks in traditional environments, it took seconds in the cloud.
However, the public cloud in its nascent stage still didn’t fully solve issues like velocity of application development, decoupling applications from underlying hardware, reducing dependencies between different components of the application itself and efficient consumption of the hardware resources. And therefore, public cloud services which started as Infrastructure as a Service (IaaS) model very quickly branched into other models such as Platform as a Service (PaaS) to Container and Function as a service (CaaS and FaaS) and Software as a Service (SaaS) models, to address a range of these issues.
With this shift, we are also observing a fundamental transformation in the way we used to secure our applications. Traditional security posture is not sufficient to secure the modern-day applications, at the same time it’s also unable to keep up with the velocity of application development.
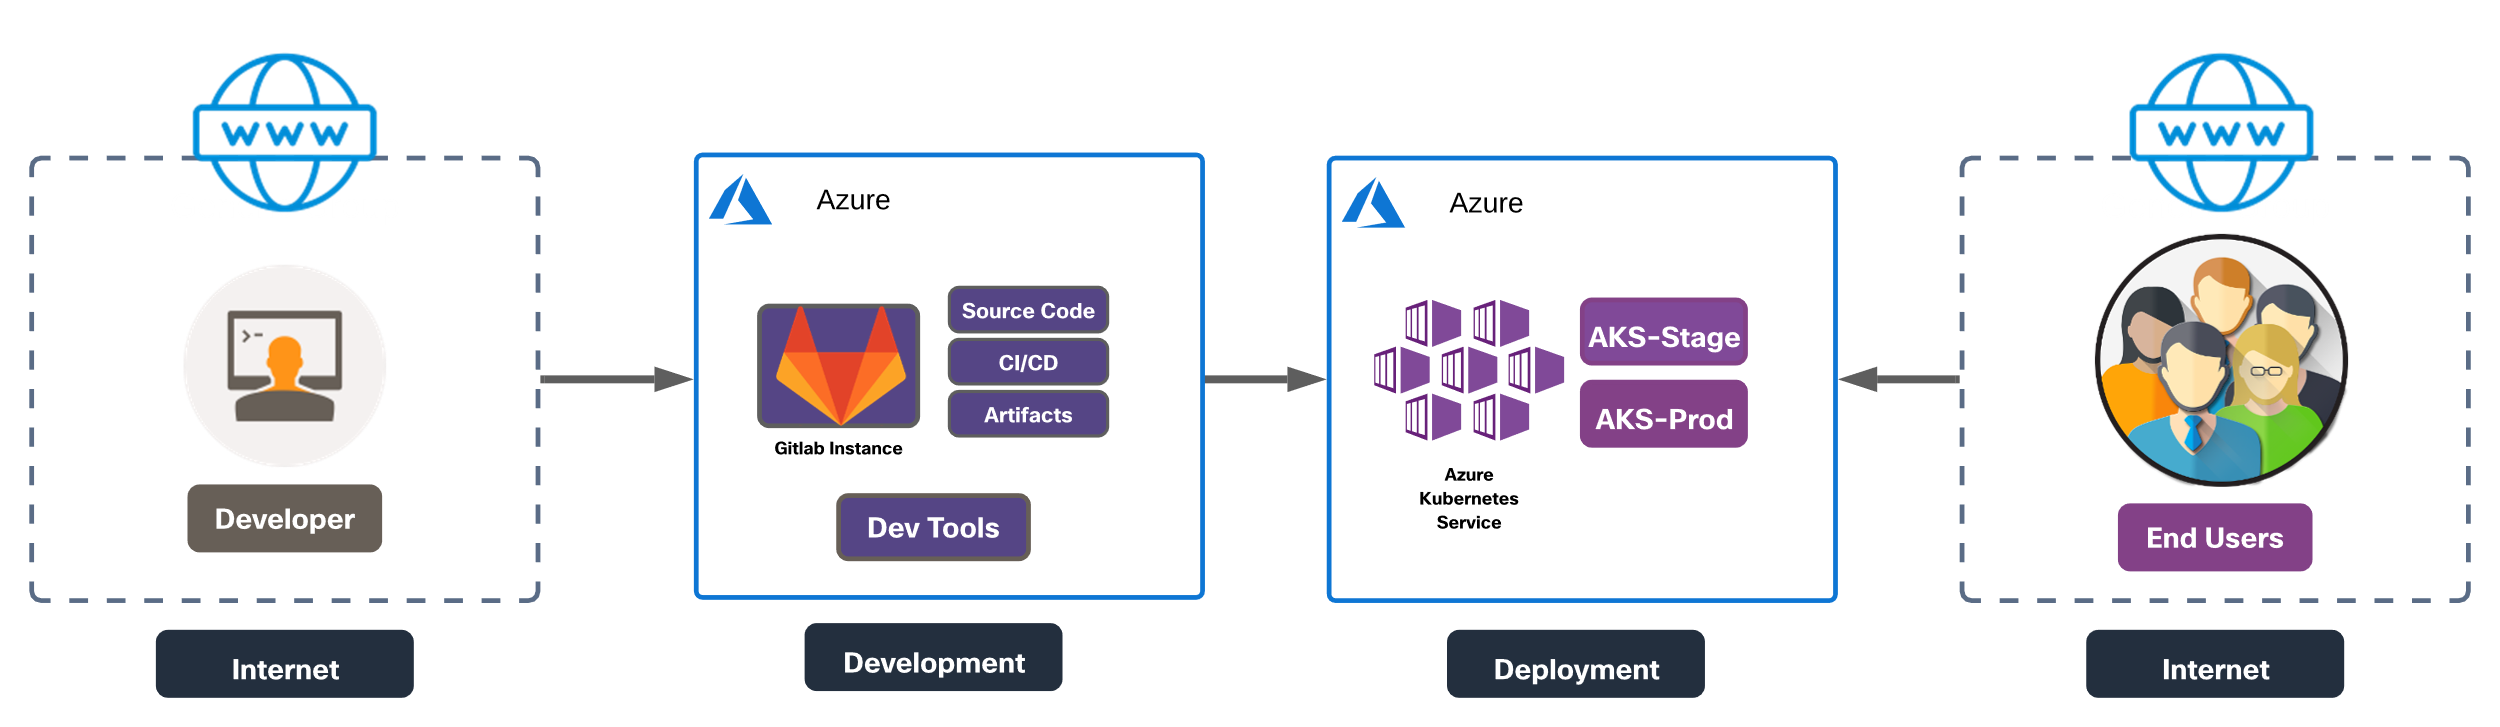
In this design guide, we will explore an end-to-end architecture of a cloud native application ecosystem. We will identify critical business flows, attack surfaces and corresponding security controls required for a given cloud native application environment. This guide is focused on Microsoft Azure as cloud service provider. The document will also cover detailed design implementation steps to achieve a Cisco Validated Design (CVD) for a cloud native application in Azure.
An application that is architected to take advantage of the cloud capabilities to minimize the complexity in application development and maintenance, and enabling rapid releases, essentially qualifies as a cloud native application. As far as the cloud native architecture is concerned, it does not matter where the application is deployed, the application could be in a public cloud, private cloud or even in a hybrid or multi cloud mode. What matters the most is the approach to achieve a truly decoupled, agile and highly automated ecosystem by leveraging various cloud offerings.
Cloud Native Computing Foundation (CNCF) sums it up as – “the techniques that enable loosely coupled systems that are resilient, manageable, and observable. Combined with robust automation, they allow engineers to make high-impact changes frequently and predictably with minimal toil. Containers, service meshes, microservices, immutable infrastructure, and declarative APIs exemplify this approach”.
To put things in perspective, as per the annual CNCF survey, over a period of 5 years between 2016 and 2020, containers have become the norm. Container usage in production environments has gone up from 23% in their first survey in 2016 to 92% in 2020, this includes a 300% increase over last 3 years. Moreover, 82% respondents are using automated CI/CD pipelines in production. On similar lines, Gartner predicts that 75% of global organizations will run containerized applications in production by 2022, this number was a little under 30% by mid 2020.
This steep upward trend in such a short time tells us a clear story that the businesses are finding real value in cloud native technologies.
How does this change the traditional security approach?
The traditional security approach was designed for very rigid environments, where there was a clear demarcation of what is trusted and what is not. Application components were tightly coupled with the underlying hardware in data center making them fairly immobile. Because of this nature of traditional application architecture and surrounding ecosystem, a traditional application security posture is also very static and applied at fixed points in the network. This opens up the attack surface at a lot of different points making it susceptible to not only insider threats but also external attacks. The cloud native approach has really blurred these network boundaries. The decoupled microservices are highly dynamic and scalable in nature and are continuously changing, making the static security policy approach a big bottleneck when it comes to keeping up with the release velocity. On the other end of the spectrum, the microservice architecture approach has enabled distributed deployments of same applications across a range of infrastructure spanning from on-premises to multi-cloud environments. This has opened a whole set of other security challenges in terms enforcing consistent security posture and threat landscape between various distributed application components.
Some of the key principles that should be followed for developing a security approach for modern day applications are:
● Zero Trust – There is no trust boundary, every entity in the ecosystem needs to protect itself independently. Each entity will have its unique security requirement
● Defense in depth – Security must be layered
● Dynamic - Security must adapt to the application as it changes and moves. Security enforcement must be agnostic of how and where the application is deployed
● Velocity – A shift in focus to the applications themselves and delivering security controls that align with the dynamic nature of applications, at the speed that the business demands
● Automation – Threat mitigation has to be automated and orchestrated to adapt to the fast-paced application development environment
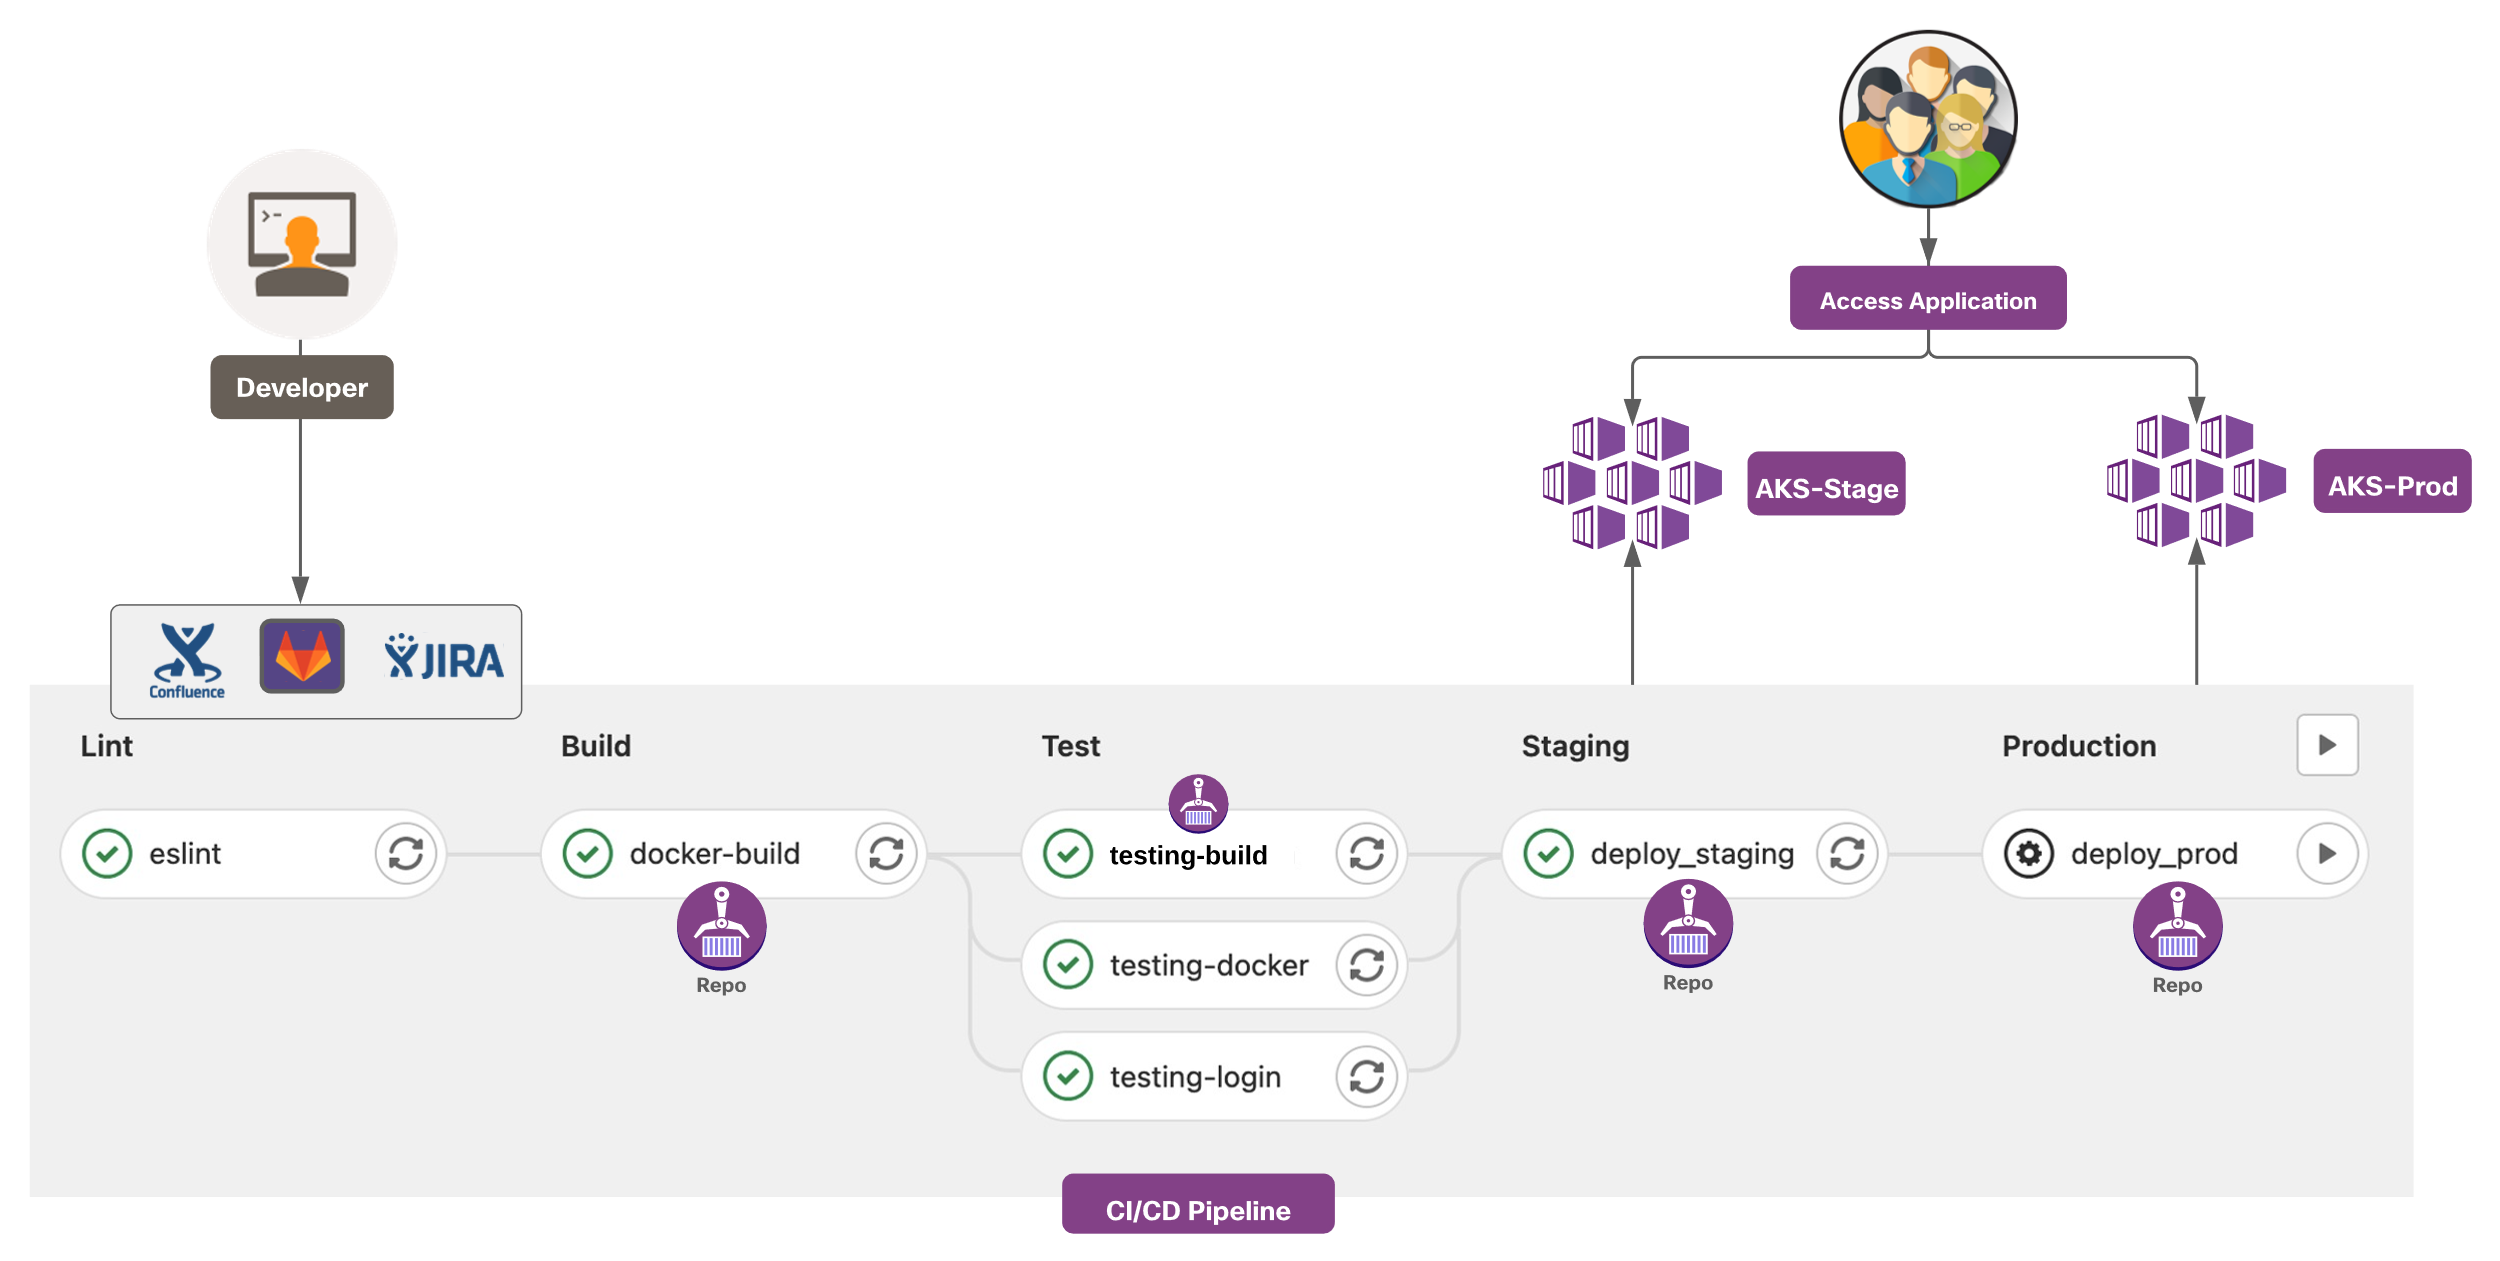
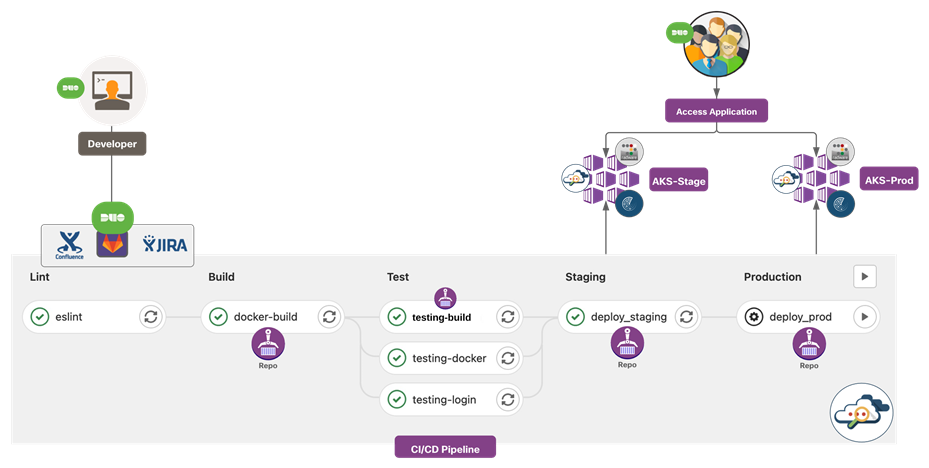
In software development lifecycle, an application goes through a series of stages to be finally available to an end user to consume. These series of stages, once a developer triggers the commit, would typically include building an image, testing it and eventually merging the code to the main branch. Once the changes are merged, the new version of the application is released to the repository. The final stage is when this newly released application is deployed and made available to the end users. This entire process has numerous challenges. Large development teams working together parallelly on the same application components, encounter merge conflicts and dependency issues, slowing down the overall velocity of feature release. To complicate this further, security is just an afterthought and basically bolted on top of the deployed application once it’s in the production environment. This security approach only tried to mitigate the damage that has likely already been done during the application development phase.
Modern day software development is undergoing a change to overcome these challenges. New commits to an application are continuously built, tested and merged via an automated process. This phase is commonly referred to as Continuous Integration or ‘CI’. The next phase is Continuous Delivery and Continuous Deployment i.e., ‘CD’. This phase includes further automated testing of the built image, uploading the image to the artifactory and then finally deploying the newly released version of application to live production environment in an automated manner as well, greatly reducing any overhead for operations team.
Given this modern CI/CD methodology, there are obvious flaws in a traditional security approach which need to be rectified. Security must be an intrinsic part of the development and testing process and not an afterthought. The good news is that the automation of the development pipeline has really facilitated this ‘left shift’ in security. The 2019 State of DevOps Report research shows that the high performance development teams have made security a part of their development lifecycle, instead of testing for security concerns at final stage of application delivery. This saves them a lot of manual work and resources needed for threat mitigation and they can instead focus on delivering quality features.
This design guide covers the following components:
● Cisco Secure Access by Duo (Duo Network Gateway)
● Cisco Secure Cloud Analytics (Stealthwatch Cloud)
● Cisco Secure Workload (Tetration)
● Radware Kubernetes Web Application Firewall (KWAF)
This design guide does not cover the following components or topics:
● Cisco AppDynamics
● Cisco Secure Application
SAFE uses the concept of business flows to simplify the identification of threats. This enables the selection of very specific capabilities necessary to secure them.
The solution in this document addresses the following business flows for a cloud native application architecture that we discussed in the previous sections.
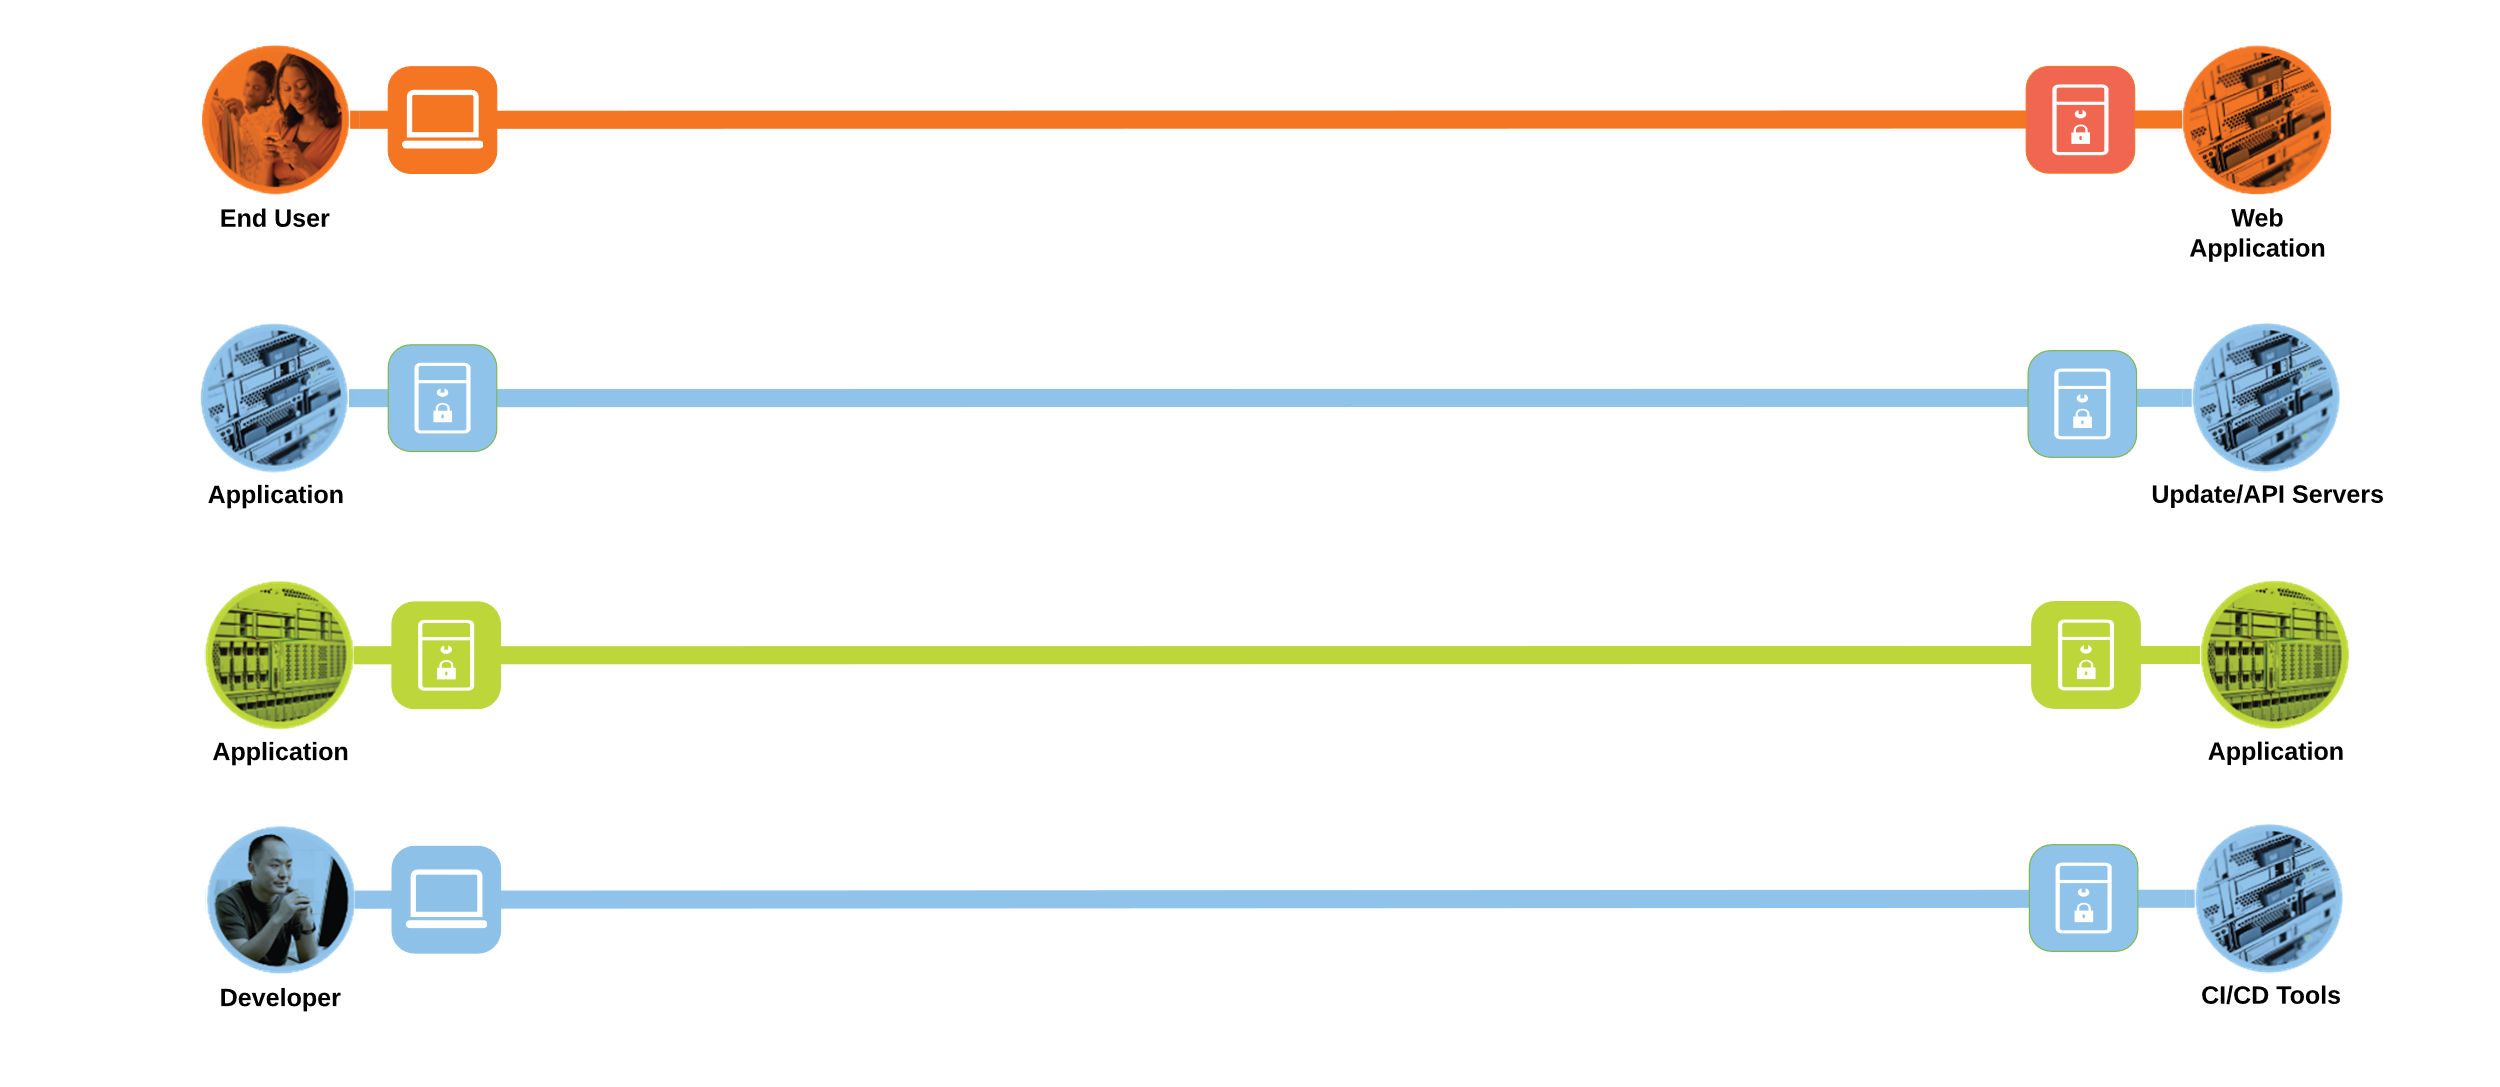
● End user or customer browsing a web application. The end user is located out on the Internet and the web application is hosted on an Azure Kubernetes Service (AKS) cluster
● Application workloads downloading updates/resources or making API calls to servers outside the Azure cloud i.e., the Internet. Modern applications heavily rely on API frameworks and other resources available through public networks
● Application to application or the east/west communication within the application. For example- the frontend microservice will make HTTP/API calls to another microservice or a SQL query connection to backend database
● Development team members use their client machines for accessing the source code, artifacts, CI/CD tools or performing other management activities
The secure cloud native design protects systems by applying security controls to the attack surface found in the public cloud. The attack surface in public cloud spans the business flows used by humans, devices, and the network. Threats include rogue identity, web vulnerabilities, infections, data exfiltration and other advanced persistent threats allowing hackers the ability to take control of the devices and networks.
The attack surface for each of the business flows discussed in previous section are shown as below.
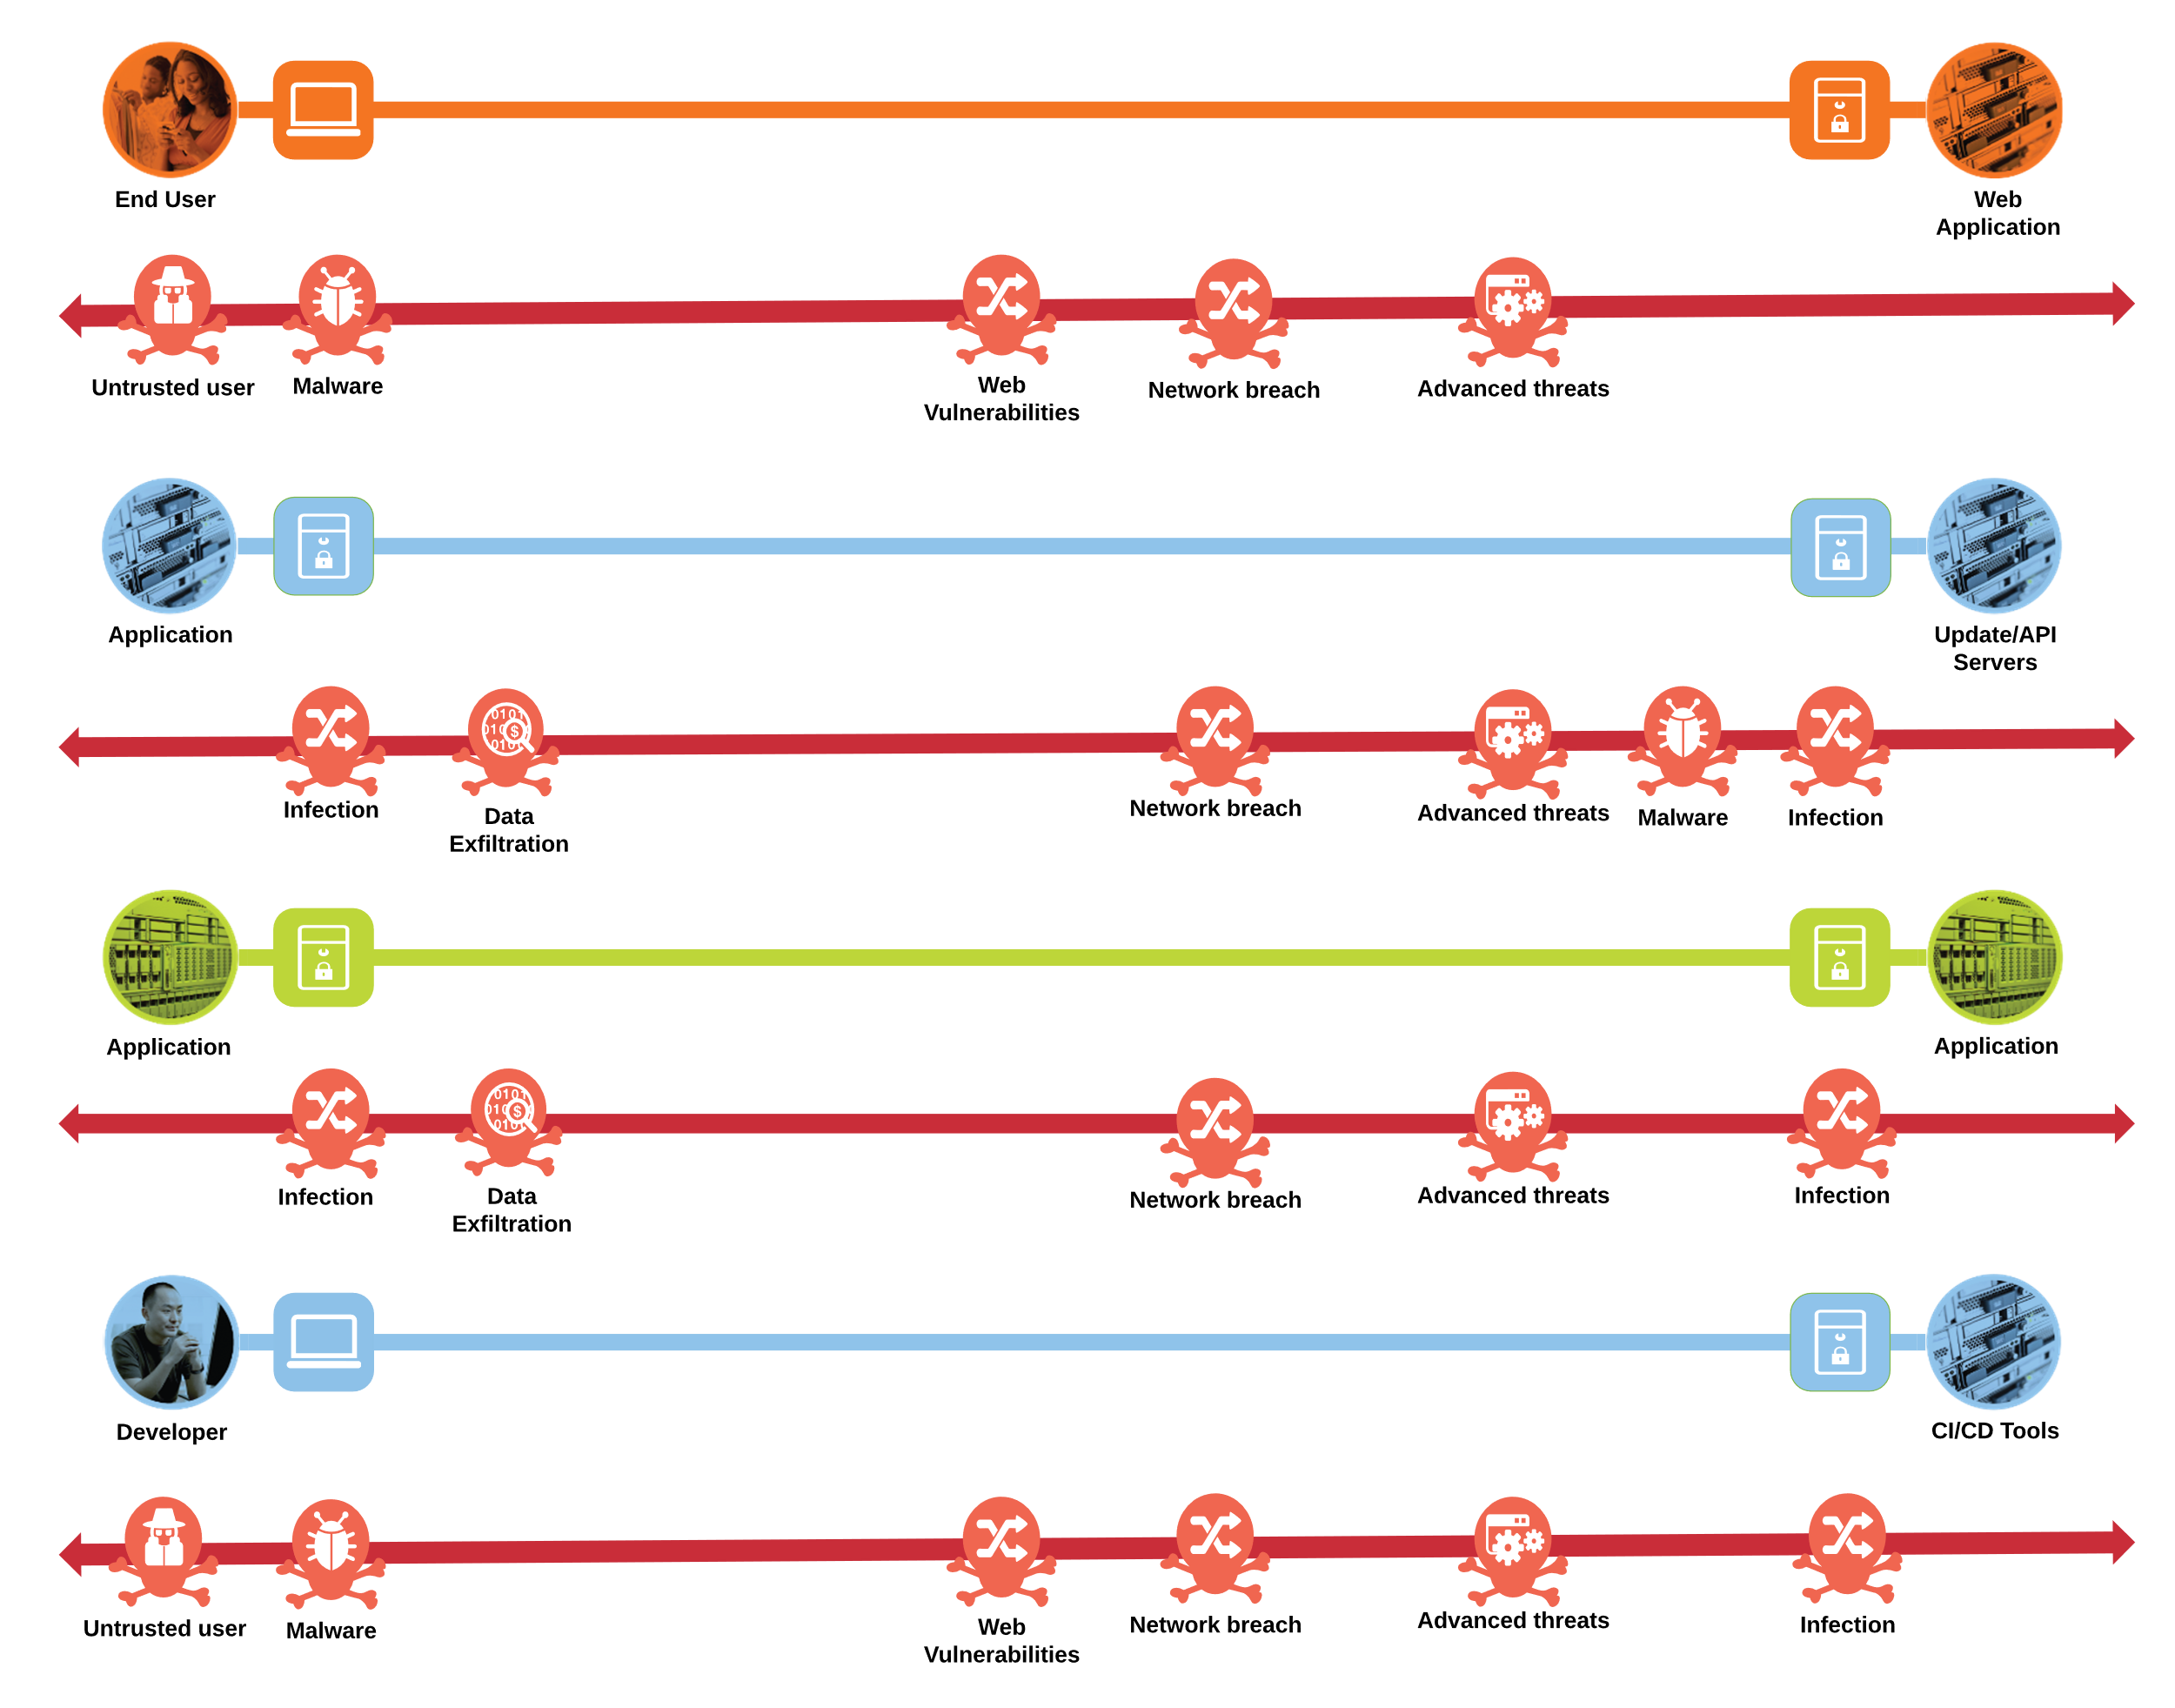
Keeping in mind the attack surface identified for each of these four business flows, the three use case scenarios below elaborate further the overall threat landscape for a real-world application.
Use Case #1
A malicious actor, on the public network, exploits a Code Injection vulnerability on the web application and gains access to the details of the underlying operating system and installed packages.
The attacker then exploits a known vulnerability in the underlying operating system or the installed package/library to perform privilege escalation and then goes on to establish a command-and-control channel to a malicious server running on attacker’s network by remotely executing a piece of code.
The attacker then starts profiling the application environment and exfiltrates sensitive data out through the established command-and-control channel over an outbound UDP 53 port (DNS protocol).
Use Case #2
The malicious actor uses targeted social engineering or malware/phishing attacks on software developers to steal credentials and gain access to the source code management system.
The attacker, located in a different geography than the software developer, then pushes a piece of malicious code in the source code repository using the stolen credentials.
The end user or the consumer downloads and installs the infected software and the attack spreads.
Use Case #3
The malicious actor steals the Azure admin credentials.
The attacker uses these stolen credentials to spin up new Azure compute resources from pre-baked Azure templates with crypto mining malware or installs crypto mining malware to existing Azure VM instances.
The malware then makes expensive crypto mining compute operations on Azure VM instances and uses algorithmically generated domains to access and hence, upload the relevant data to attacker’s server.
Developing a defense-in-depth architecture requires identifying existing threats and applying appropriate security capabilities at multiple layers to thwart them. Business flows and the corresponding attack surface and threat patterns that we defined in previous two sections are mapped to their corresponding security controls as below.
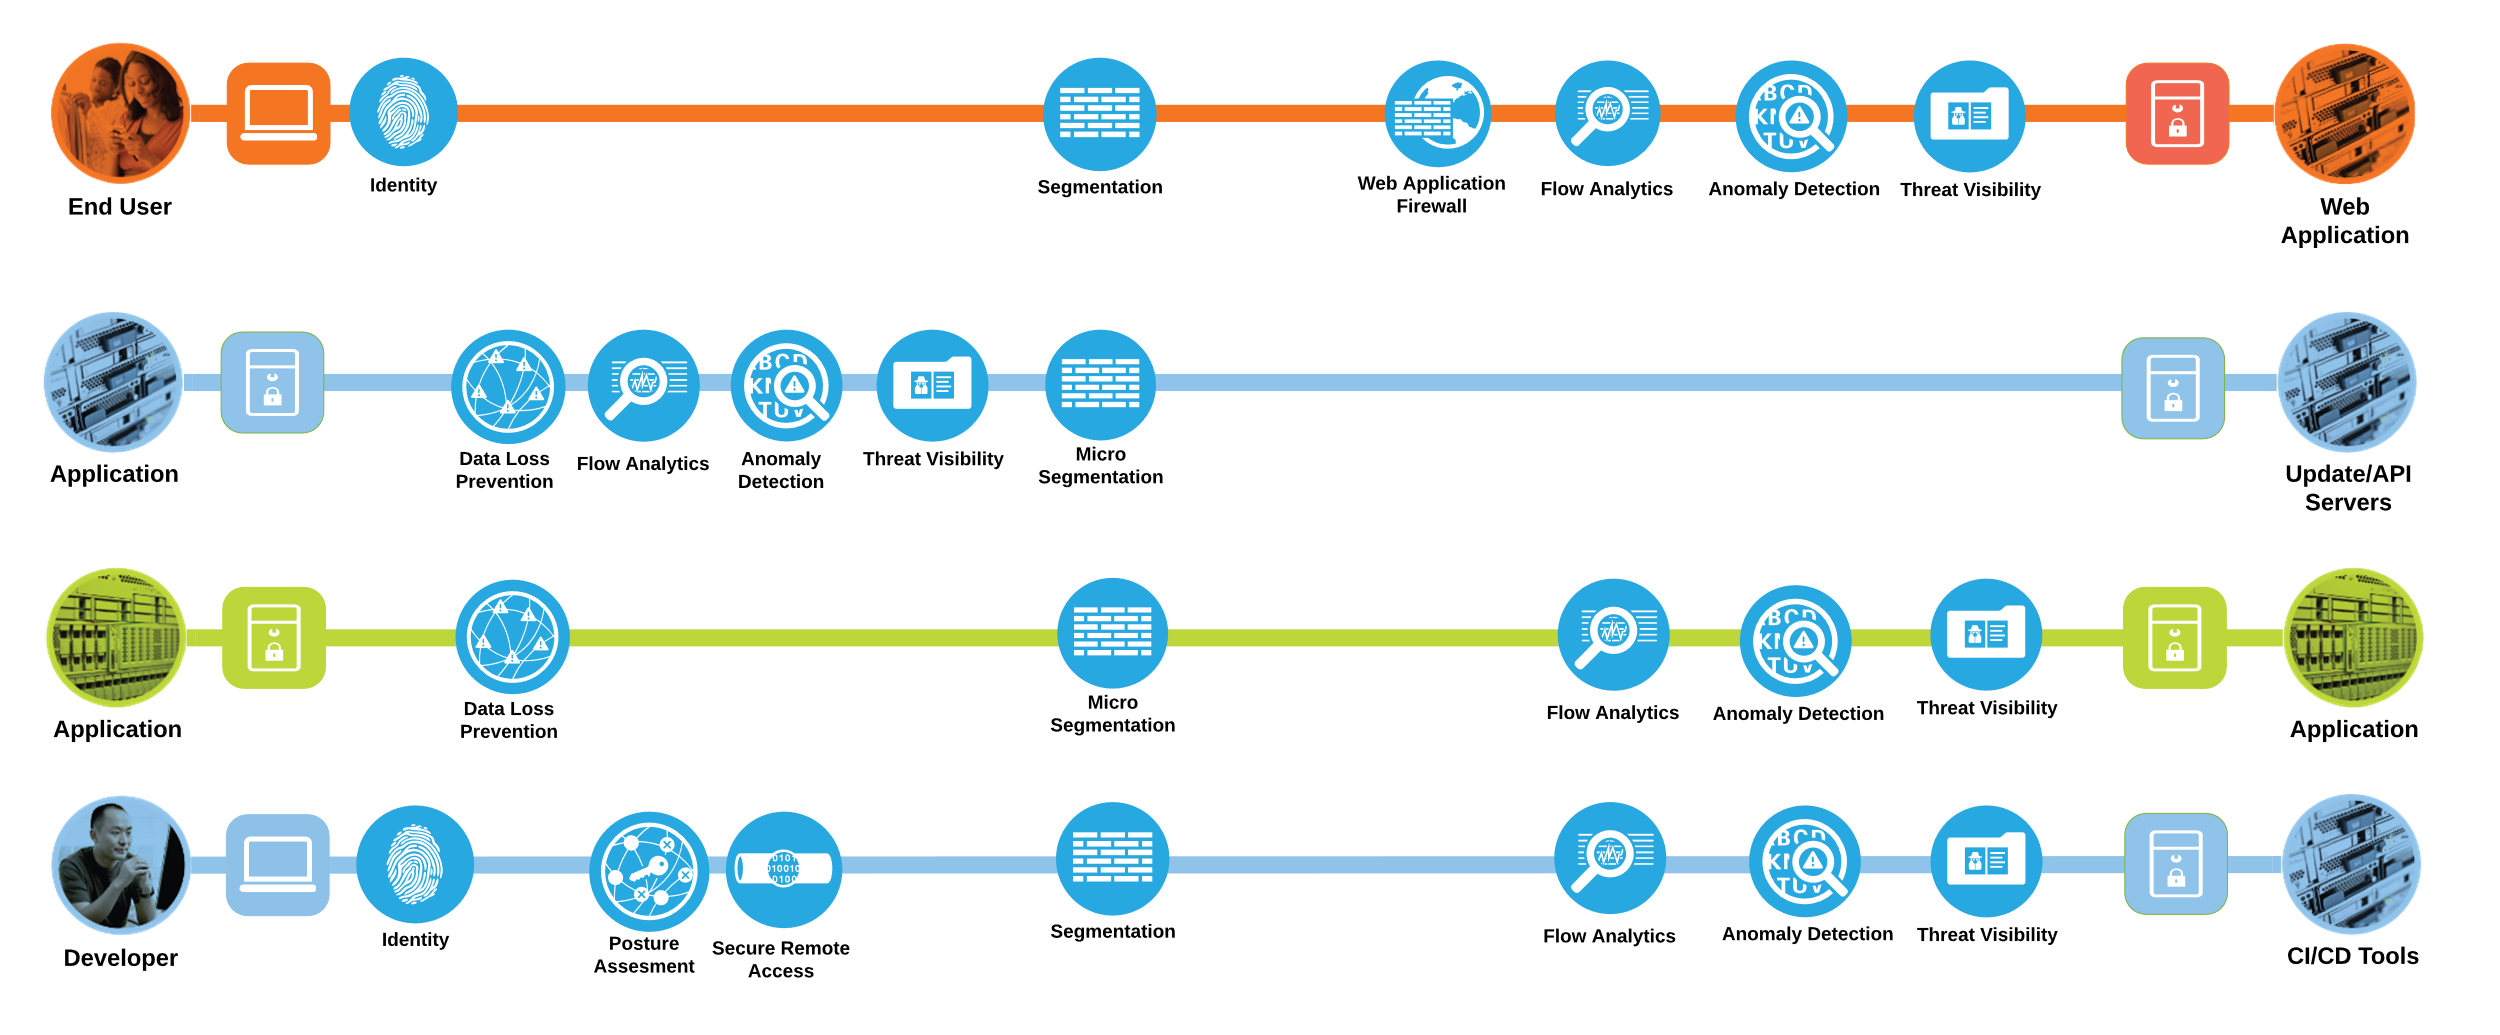
Now that we have identified the security capabilities needed to secure the four business flows, Cisco security solutions corresponding to each security capability can be mapped as below.
| Icon |
Threat |
Icon |
Capability |
Security Solutions |
| |
Attackers or malicious users accessing restricted resources and information. |
|
Strong Identity based access |
Cisco Secure Access by Duo – MFA |
| |
Attacks against poorly developed applications and web vulnerabilities. |
|
Web Application Firewalls (WAF) |
Radware Kubernetes WAF |
| |
Network breach causing unauthorized access and malformed packets between and within application in the cloud. |
|
Micro-Segmentation |
Cisco Secure Workload |
| |
Zero-day malware attacks and other forms of covert threats. |
|
Threat visibility |
Cisco Secure Cloud Analytics |
| |
Infections, attackers using a compromised workload to spread the damage. |
|
Micro-segmentation |
Cisco Secure Workload |
| |
Traffic, telemetry, and data exfiltration from successful attacks. Covert threats. |
|
Flow Analytics |
Cisco Secure Cloud Analytics |
| |
Exploiting privileged access to run shell code. |
|
Anomalous Behavior Detection |
Cisco Secure Cloud Analytics |
| |
Exploiting unpatched or outdated applications. |
|
Vulnerability management |
Cisco Secure Application |
| |
Exposed services and data theft. |
|
Reverse Proxy |
Duo Network Gateway |
| |
Breaches due to network and cloud misconfigurations. |
|
Posture Assessment |
Cisco Secure Cloud Analytics |


We have identified the business flows, the threat landscape and the security capabilities required to mitigate the threats. We will now replay the same three use case scenarios that we discussed in previous section to understand how all these security controls help us achieve a better security posture. The core principle of this security strategy is to have layered security controls, let’s understand how it plays out in terms of each of the previously mentioned scenarios.
Secured Use Case #1
The web application firewall would allow us to detect and block any web vulnerability exploitation like code injection attempts in HTTP requests.
Cisco Secure Application would continuously monitor the runtime for any new or existing vulnerabilities in the libraries or packages and hence, block the attacker from being able to exploit vulnerabilities.
Further, if for some reason, the attacker alert goes unmitigated or unnoticed, the flow analytics capability will allow us to detect the data exfiltration attempts.
Lastly, the micro-segmentation capability will prevent any east-west spread of the attack and hence stops attacker from gaining any further insights into the dev environment.
Secured Use Case #2
Posture assessment or the health and trust check on the dev machine makes it really impossible for a malicious actor to steal credentials and also ensures that a constant security posture is maintained on the end user machine.
The Single-Sign-On (SSO) and Multi-Factor-Authentication (MFA) ensures that even if the first factor is compromised, the second factor prevents any major damage or compromise.
Anomalous behavior detection capability alerts the security team if there is any anomaly in the dev machine’s behavior, for example - if the dev machine is trying to push changes to systems that it usually never interacts with or if changes are being pushed from different geographical locations than the usual location.
Lastly, micro-segmentation prevents any lateral movement by the attacker.
Secured Use Case #3
Posture assessment or the health and trust check on the dev machine makes it impossible for a malicious actor to steal credentials.
The Single-Sign-On (SSO) and Multi-Factor-Authentication (MFA) ensures that even if the first factor is compromised, the second factor prevents any further damage.
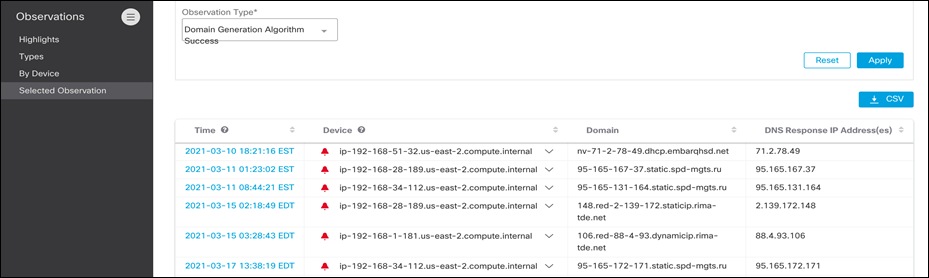
Flow analytics would detect if any algorithmically generated domain name resolution to a malicious server happened on the application network.
To sum it all up, with all the security capabilities in place, the dev machine has a health monitor to validate its security posture. If the dev machine is in a ‘healthy status’, defined as per the organization policy, then it’s allowed access to privately hosted developer tools through an agentless VPN architecture using SSO and MFA capabilities.
The entire CI/CD pipeline that sits in the Hub VNet in Azure is monitored for any malicious or anomalous activity by the Secure Cloud Analytics platform.
Once, the application is deployed to an Azure Kubernetes cluster, Radware Kubernetes WAF security features ensures that the application in production environment is protected from any adversaries out on the public networks trying to compromise it. Secure Workload controls the lateral movement within the app workloads and Secure Cloud Analytics continuously monitor any anomalous behaviour within the application components.
Securing Cloud Native Applications
Cisco Secure Access by Duo (Duo Network Gateway)
With Duo Network Gateway, users can securely access the internal web applications from any device, using any browser, from anywhere in the world, without having to install or configure remote access software on their device. Users can also remotely SSH to configured hosts through Duo Network Gateway after installing Duo's connectivity tool, providing server access without a VPN client. Users first authenticate to Duo Network Gateway and approve a two-factor authentication request before they may access different protected services. Session awareness minimizes repeated MFA prompts as users access additional services and hosts via the gateway.
Duo Network Gateway allows granular access control per web application, set of SSH servers, and user groups. Different policies can be enforced to make sure only trusted users and endpoints are able to access the internal services. For example, you can require that GitLab users complete two-factor authentication at every login, but only once every seven days when accessing Confluence. Duo checks the user, device, and network against an application's policy before allowing access to the application.
Duo also helps you control access to your applications by restricting access when devices do not meet particular security requirements. If the health check and trust policies are enabled, then the first-time users are prompted to download and install the Duo Device Health application. Once the Device Health application is installed, Duo blocks access to applications if the device is unhealthy based on the Duo policy definition and informs the user of the reason the authentication was denied. Refer to the detailed documentation here for more information.
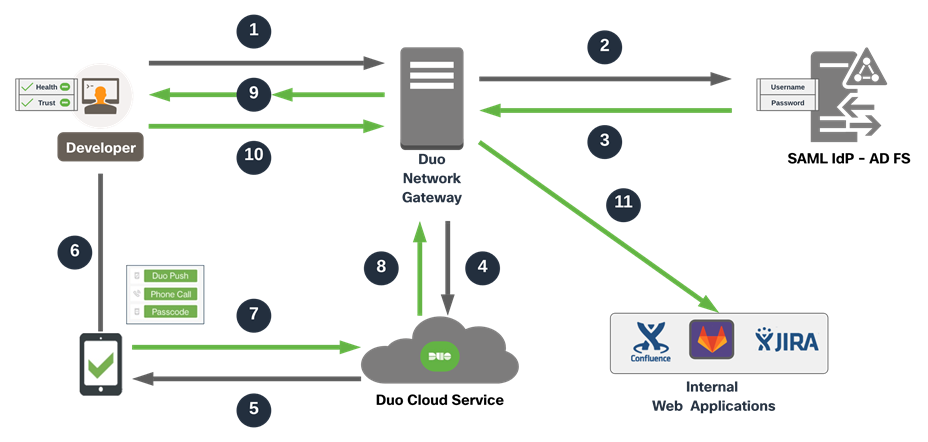
The end user makes an HTTPS connection to access the application, the application FQDN points to Duo Network gateway and hence the connection lands on Duo Network Gateway. The end machine is checked for health and trust policies and then the DNG goes on to initiate primary authentication to SAML identity provider if the end machine is healthy and trusted as per the organizational policies. After the primary authentication, the secondary authentication kicks in via the Duo’s Cloud Service. Once, the Duo Network Gateway receives authentication approval for secondary authentication, access to published internal web application is allowed via Duo Network Gateway reverse proxy.
Cisco Secure Cloud Analytics (Stealthwatch Cloud)
Secure Cloud Analytics provides comprehensive visibility and high-precision alerts with low noise for cloud native environments as well as traditional infrastructure across all major cloud service providers. Secure Cloud Analytics accomplishes this by consuming a wide range of telemetry and flow logs from the cloud service providers, and then modeling behavior to identify threat activity.
This use of modeling helps you rapidly identify early-stage and hidden indicators of compromise. Each model consists of five key dimensions of entity behavior:
● Forecast: Predicts entity behavior based on past activities and assesses the observed behavior against these predictions
● Group: Assesses entities for consistency in behavior by comparing them to similar entities
● Role: Determines the role of an entity based on its behavior, then detects activities inconsistent with that role
● Rule: Detects when an entity violates organizational policies, including protocol and port use, device and resource profile characteristics, and block listed communications
● Consistency: Recognizes when a device has critically deviated from its past behavior, in both data transmission and access characteristics
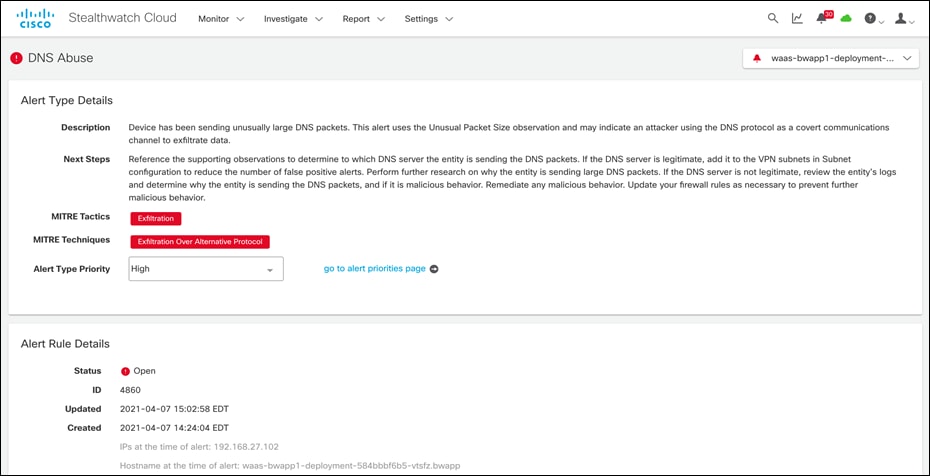
DNS abuse, geographically unusual remote access, persistent remote-control connections, and potential database exfiltration are examples of Secure Cloud Analytics alerts. In addition, network reports for the top IPs, most used ports, active subnets with traffic statistics, and more are available.
Some key capabilities offered by Secure Cloud Analytics are:
Visibility and Flow Analytics
The flow log telemetry is processed in Secure Cloud Analytics to provide visibility of all active entities across a modern network, including the private network, public cloud or containerized workloads running on a Kubernetes cluster. Through entity modeling, the solution can detect a variety of threat activities with a high degree of accuracy.
Secure Cloud Analytics deploys into a Kubernetes cluster via Kubernetes daemonset object that automatically deploys, expands and contracts across nodes in a cluster. The node sensors tap into both the internal communication among pods running on the cluster, as well as the external communication. This allows for an unprecedented level of visibility into everything that a cluster is doing, from pods communicating to the internet to worker nodes communicating internally with the master node. We then add entity modeling which compares new behavior to previous behavior and machine learning based anomaly detection to alert on IOC’s throughout the environment to alert on a range of indicators for any suspicious activity across a cluster.
Secure Cloud Analytics can consume Azure VNet flow logs for end-to-end visibility across any resources within a given Azure VNet. This is immensely powerful deployment for environments where a sensor-based approach is not an option.
For the flow monitoring use cases in this document, we will explore the integration with AKS clusters to monitor containerized workload flows. Along with that, we will also validate the agentless integration with Azure VNets to monitor various resources within a given Azure VNet.
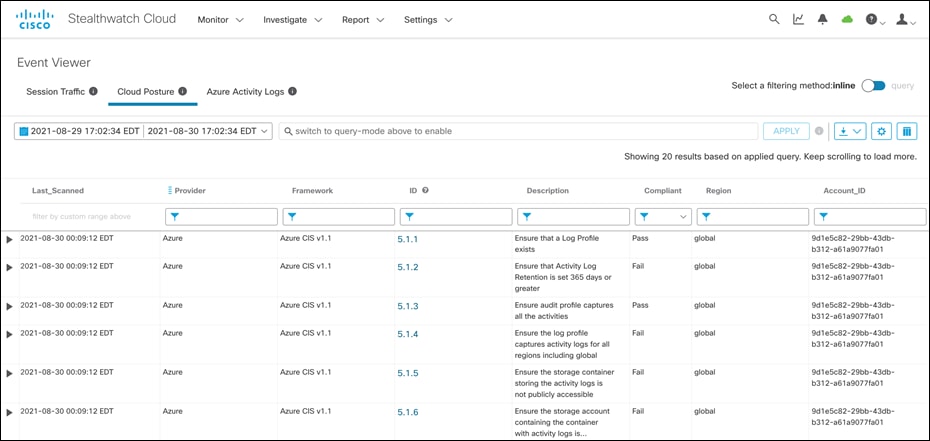
Cloud Security Posture
Secure Cloud Analytics offers event viewer to monitor cloud security posture. It allows the user to investigate accounts and individual resources for compliance with industry best practices and custom policies. Users can also pivot into query mode to perform more in-depth searches. SecOps teams gains instant access into all cloud accounts and can query by specific resource, rule and more over custom timeframes to hone in on misconfigurations or other compliance issues.
Secure Cloud Analytics ensures that the cloud resources adhere to Azure CIS benchmark standards, then automatically alert users so they can quickly apply the changes needed to bring them back into compliance. The integration uses an Azure IAM policy documents which allows the admin flexibility to choose Azure resources to be monitored based on their organization policies and needs.
API Driven Monitoring
Secure Cloud Analytics begins checking your cloud resources for risky configurations and changes upon deployment. You can also create your own watchlists to be alerted to activity of interest, and to ensure cloud resources are adhering to your internal policy.
As telemetry is collected, Secure Cloud Analytics creates a model—a sort of simulation—of every active entity in the monitored public cloud. Entity modeling allows the solution to detect a variety of behaviors associated with potential threats. For example, it automatically places all of your compute instances, Kubernetes nodes, load balancers, Storage containers and more into roles and will use cloud-native telemetry like flow logs to detect potentially malicious or harmful activity. The resource’s behavior will be compared to the behavior of similar entities over time. These communication patterns build a baseline for ‘normal’ behavior, and if there is traffic that deviates from this baseline, users can receive custom alerts.
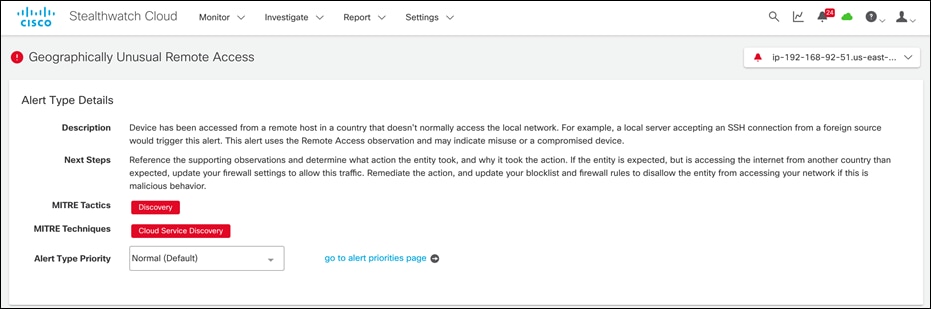
The alerts tab provides mapping to the MITRE ATT&CK framework which adds additional context to each alert. This has information on the type of threat, what methods attackers may be using and what the best course of action to remediate should be. There are also detections that are unique to the behavior of cloud usage such as Geographically Unusual API Usage, that are built specifically to alert on malicious activity in the cloud.
Radware Kubernetes Web Application Firewall (KWAF)
Radware’s Kubernetes WAF is designed to fit into the Kubernetes orchestration system to provide not just the application security with advanced automation capabilities, but also the elasticity required by today’s DevSecOps teams. It offers its own management portal as well as integrations with common visibility and reporting platforms such as Elastic, Prometheus, Grafana and more.
Radware KWAF can operate in both inline and out of path modes. A range of deployment options are supported depending on the requirements of your Kubernetes environment and microservices architecture. The solution offers seamless integrations with all the popular sidecar proxies like Nginx, Envoy and more or service mesh deployments like Istio. In this document, we validate the inline provisioning of KWAF. We used Nginx ingress to expose our cloud native application, however, the validated inline KWAF deployment would remain same for any other type of ingress or side car proxies.
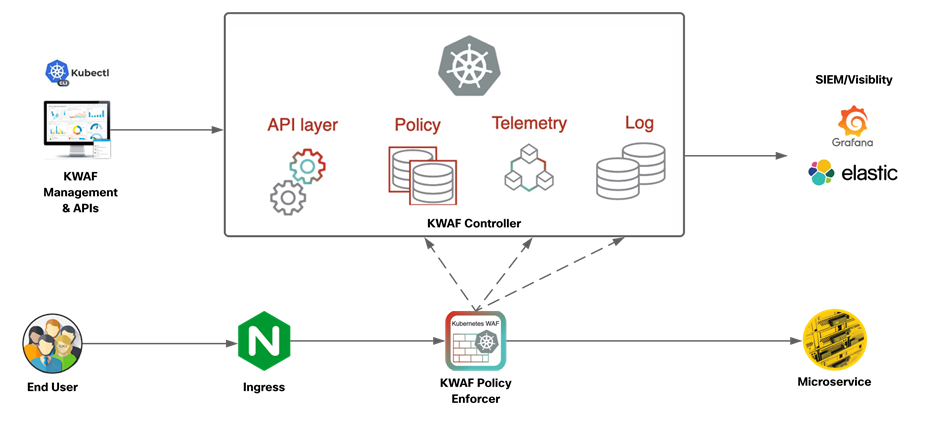
The solution follows a distributed architecture with security sidecars deployed at the pod level in the data plan and a management back end running on the same Kubernetes cluster for the control plane. It consists of following primary components.
Data Plane Policy Enforcer
The Kubernetes WAF data plane policy enforcer runs as a security sidecar in the same pod as the microservice. It functions as a reverse proxy before the microservice and can work after either a sidecar proxy (e.g., Istio/Envoy) or any other ingress method outside of the pod (e.g., NGINX ingress controller). In both cases, SSL termination is accomplished before the enforcement, by either Istio or the Kubernetes cluster’s ingress controller, to allow the enforcer to handle the clear text traffic. This single termination of TLS traffic at the host level eliminates the need to manage multiple certificates.
Controller
The Kubernetes WAF’s centralized control plane back-end runs in the same Kubernetes cluster as the application. It provides centralized administration, management, reporting and forensics, via either APIs or the management portal GUI. Since the policy is centrally stored and managed in the controller, any policy change that is applied manually by the administrator or automatically generated by the machine learning modules will be synchronized automatically across all the data path policy enforcers. Telemetry information is collected from the policy enforcer and pushed to the controller for analytics and auto-policy processes. Logs are sent from the enforcer to a centralized logging module in the controller to allow centralized forensics and analytics and allow forwarding of the logs to external visibility and security information and event management (SIEM) systems.
Management Portal and APIs
The Kubernetes WAF management portal provides a GUI to monitor and manage Kubernetes WAF security. It consists of: Dashboards which provide visualization of real-time telemetry and security events tailored for the DevOps and SecOps users. Forensics which provide detailed security event reports with drill-down analysis, analytics and exception handling. Every configuration and operation on the Kubernetes WAF can also be performed without the GUI via Kubernetes compatible APIs. Security profiles are defined as Kubernetes custom resource definitions (CRDs), and they are managed in the same way as other Kubernetes resources. This approach allows for full management and configuration of security profiles via native Kubernetes APIs without using the management portal.
Some of the key Kubernetes WAF security features include:
RFC Validation
Detects anomalies in the message and violations of the protocol's RFC standards.
Signatures
The signatures security module is based on a string match engine to detect attack patterns in HTTP requests. Signature rules detect known types of attacks such as XSS, predictable resource locations, directory traversal, etc.
Expressions
The expressions security module is based on regular expression and logical rules for detection of known types of attacks, such as SQL and non-SQL injections.
Access Control
The access control module allows the defining of web resources and APIs that should be accessible. Requests to non-listed resources will be blocked or logged, depending on the policy settings. Policy settings can be defined at a full path level or file extension level or by a regular expression definition.
Data Leakage Protection
The data leakage protection module identifies sensitive information in application responses, allowing the masking of sensitive data. Examples of sensitive data are credit card numbers, Social Security numbers, server error messages, etc.
API Security
Both JSON and XML bodies are parsed, JSON/XML validity checks are applied, and key values are extracted for further inspection by the other protection modules, such as signatures and expressions. This allows detection of common API attacks such as XML bombs, manipulation of APIs and detection of embedded attacks.
Cisco Secure Workload (Tetration)
The cloud native applications are extremely dynamic, the communication patterns between application components constantly changes. The decoupling of application components into a microservices based architecture brings in a fundamental change in traffic patterns when compared to monolith application. This technological shift has contributed to an increased attack surface and free lateral movement within the application infrastructure. This dynamic environment has created several challenges that organizations must address:
● Lack of static network perimeters and the ability to enforce segmentation policies based on application behavior
● No consistent approach to implementing segmentation using across a multi-cloud infrastructure
● Lack of a comprehensive approach to reduce the attack surface, minimize lateral movement, and detect behavior deviations
The Cisco Secure Workload platform is designed to fully address these challenges. The platform performs advanced analytics using an algorithmic approach and provides workload protection for a multi-cloud and hybrid ecosystem. Key features include:
● Complete visibility into application components, communications & dependencies to enable a zero-trust model
● Consistent enforcement of segmentation policy across a multi-cloud infrastructure to minimize lateral movement
● Identification of software vulnerabilities and exposures to reduce attack surface
● Flexible policy configuration over GUI or API calls using serialized data from CI/CD pipelines or a regular API client
● Process behavior baselining and identification of deviations for faster detection of any indicators of compromise (IOCs)
The platform supports automated ingestion of inventory metadata from AKS cluster. When an external Kubernetes orchestrator configured, Cisco Secure Workload connects to the cluster’s API server and tracks the status of nodes, pods and services within the cluster. In addition to a number of labels generated by the platform itself, Secure Workload automatically imports the labels associated every Kubernetes objects, this metadata facilitates the creation of highly flexible inventory filters. The policy enforcement is done using these inventory filters in a very dynamic manner instead of relying on any static boundaries. A single set of policy enforcement agents deployed using Kubernetes daemonset objects can be used to enforce policies across any number of applications hosted on the cluster in completely separate workspaces. The daemonset approach also eliminates the need for any manual effort when cluster nodes scale up or down.
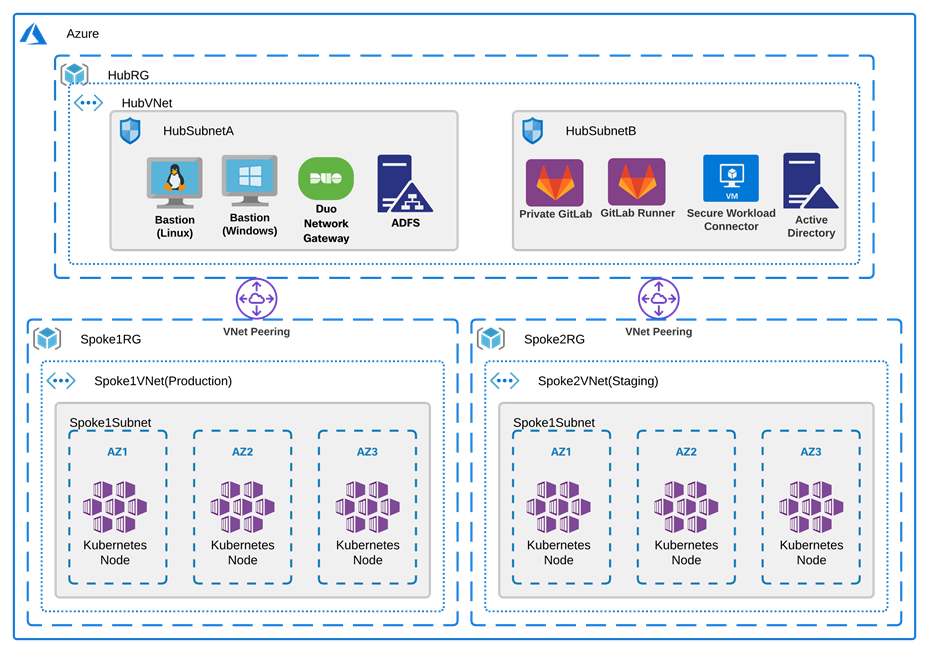
In this section of the document, we will go over the architecture for a cloud native application in Azure.
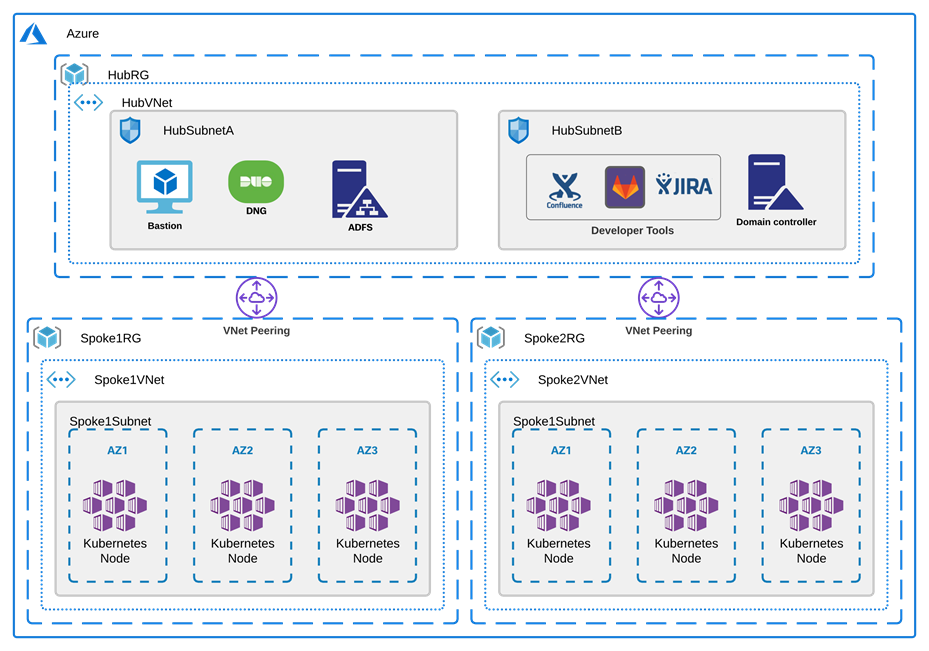
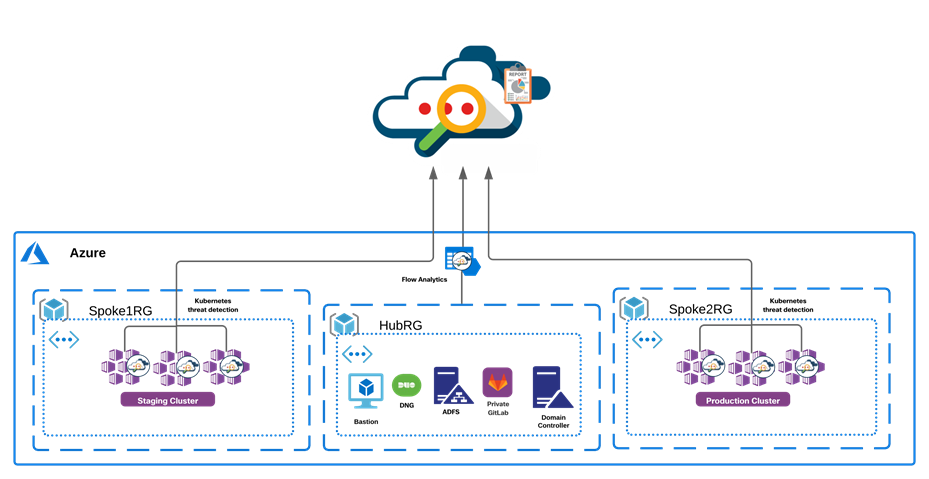
This architecture has three Azure VNets:
● Hub Resource Group – The Hub Resource Group hosts the resources required for developing and managing the applications and is shared across the production or the staging environment. This could also be shared among multiple applications (hosted in different spoke Resource Groups). The Virtual Network in the Hub RG hosts following:
◦ Internet facing resources like the bastion hosts, Duo Network Gateway, Active Directory Federation Service as SSO Identity provider
◦ Privately hosted dev tools like a source code management system. We also have the build servers, domain controllers and other necessary infrastructure required in a development environment running on various computes instances in Hub Subnets
● Spoke Resource Groups – The Spoke Resource Groups are used to host the applications on Kubernetes clusters manager by Azure Kubernetes Service (AKS). The AKS nodes are distributed across three availability zones. The two spokes in this reference architecture host the production and staging versions respectively
The Hub VNet is connected to Spoke VNets through VNet peering links. The choice for connecting VNets depends on multiple factors, for example, the number of spoke VNets to be connected. If the Resource Group design is such that there are a larger number of applications, each hosted in their own Resource Group then VPN Gateway is likely a better choice. Another contributing factor for making this decision could be bandwidth and security compliance requirements in bigger deployments. Refer to Azure documentation here for more details on VNet connectivity.
The CI/CD pipeline runs on a compute instance within the Hub VNet and privately connects to staging or production AKS clusters over the peering links to continuously deploy or maintain the application running on AKS cluster.
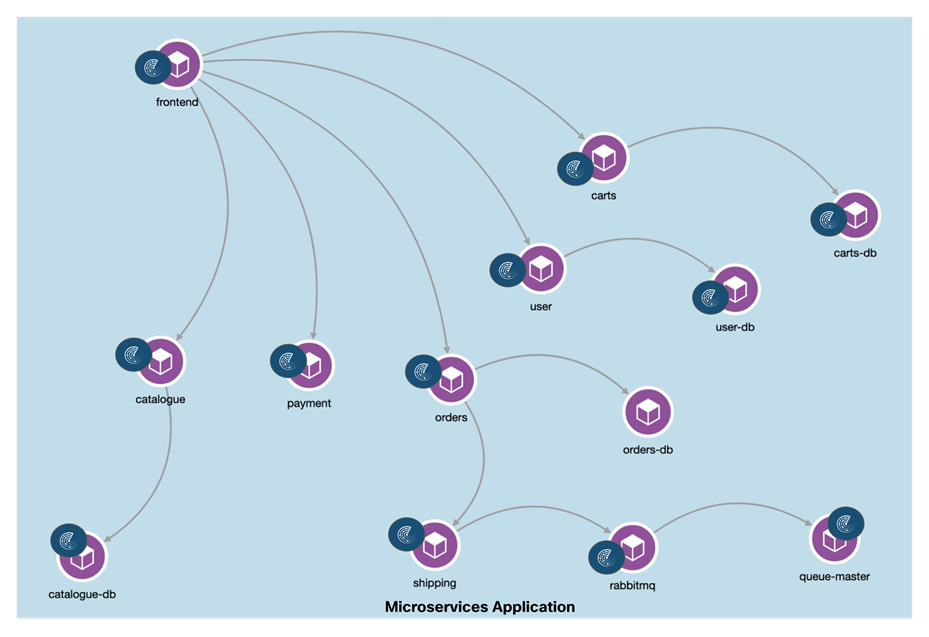
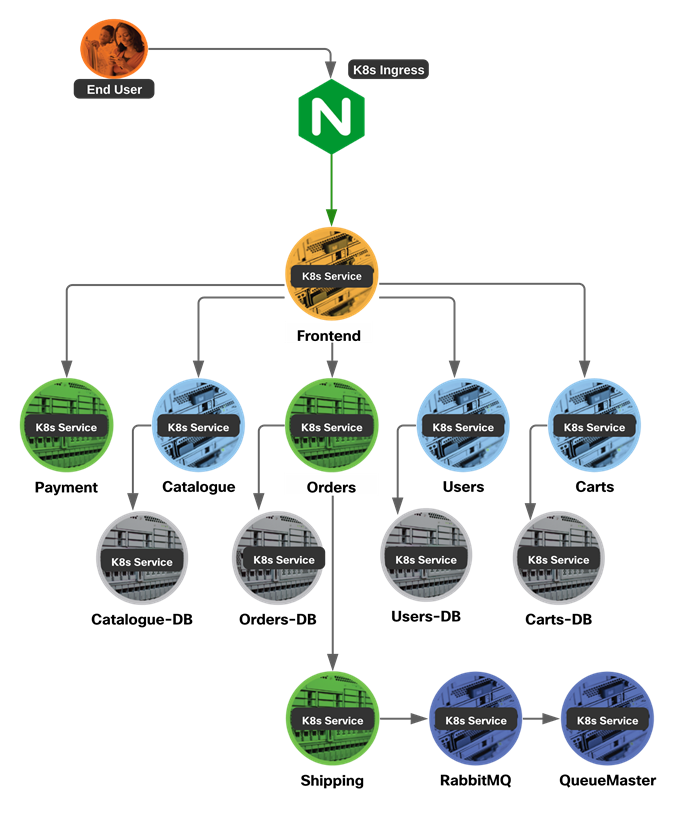
The microservices application used for the purpose of this document has the microservice architecture as shown in diagram below. An NGINX ingress controller is used to expose the web application and API services to the end user.
Design Prerequisites
● Follow the instructions in Appendix A of this document to provision the initial Azure and development infrastructure
● Access to Duo Admin account, Cisco Secure Cloud Analytics, Cisco Secure Workload and Radware KWAF accounts with appropriate licenses
Cisco Secure Access by Duo (DNG)
Prerequisites
● Follow the instructions in Appendix B of this document to do initial installation of Duo Network Gateway
● A public DNS domain to expose the privately hosted GitLab instance to public access, for example - cloudnativesafeapp.net. Add a CNAME record (example- *.gitlab.cloudnativesafeapp.net) to this hosted zone and point it to DNG hostname i.e., portal.safecloudnativeapp.net (created in Appendix B of this document)
● Create SSL cert for Gitlab instance to be used for external access
● Create SSL cert for SSH instance to be used for external access (example - Common Name - ssh.cloudnativesafeapp.net)
Implementation Summary
Step 1. Enable agentless VPN access to the private GitLab instance
Step 2. Enable SSH connection to GitLab server and bastion hosts
Implementation Procedure
Step 1. In this step we will protect the private Gitlab application.
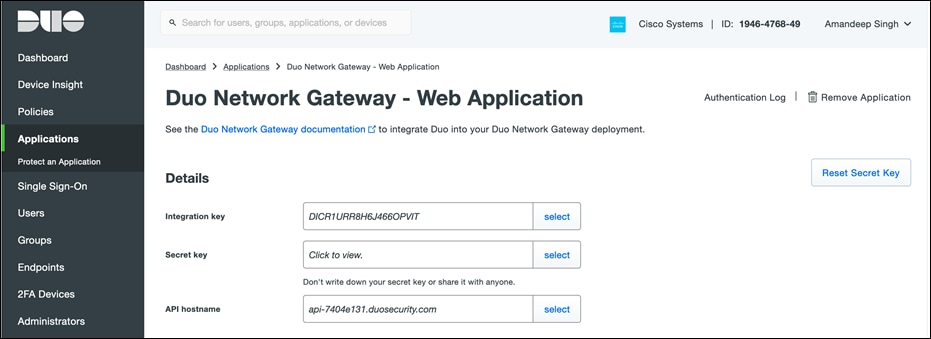
● Log in to the Duo Admin Panel and navigate to Applications. Click Protect an Application and locate the 2FA-only entry for Duo Network Gateway - Web Application in the applications list. Click Protect to the far-right to configure the application and get the Client ID, Client secret, and API hostname. We will need this information to complete the setup
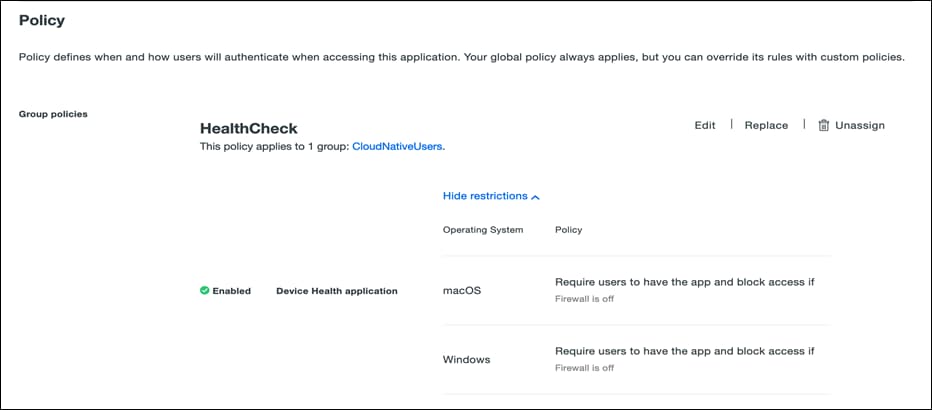
● On the same page, scroll down, under the Policy section click on Apply a policy to group of users to add health check policy and click on Save. For more details on refer to the Duo Health Check Application documentation
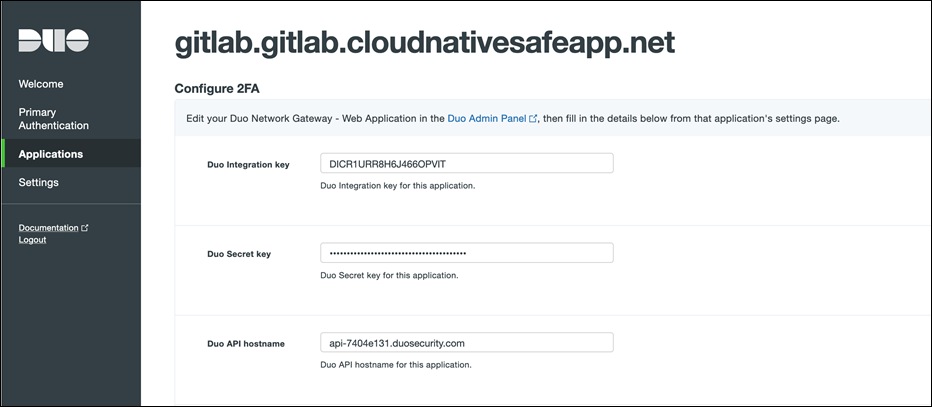
● Return to the Duo Network Gateway admin console and click the Applications link on the left-hand side of the screen. On the Applications page click Add New... and select Web Application from the drop-down options. You will be taken to a new page. Under Configure 2FA enter the Client ID, Client secret, and API hostname information from the application created in the previous step on Duo Admin Panel
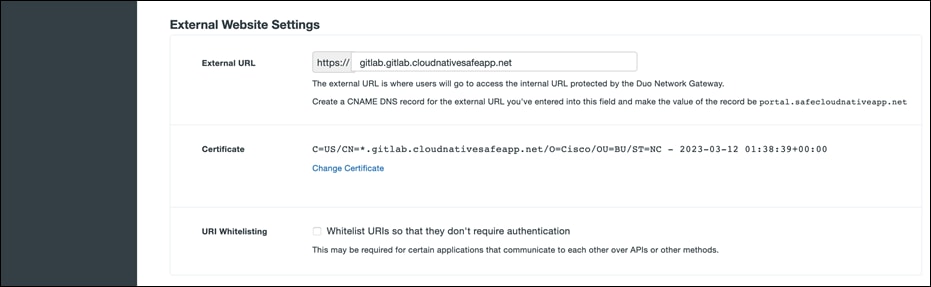
● Scroll down to the External Website Settings section. In the External URL field enter the external domain we created (e.g., https://gitlab.gitlab.cloudnativesafeapp.net). Select Provide my own certificate next to Certificate Source. Choose the cert and key create earlier as prerequisites
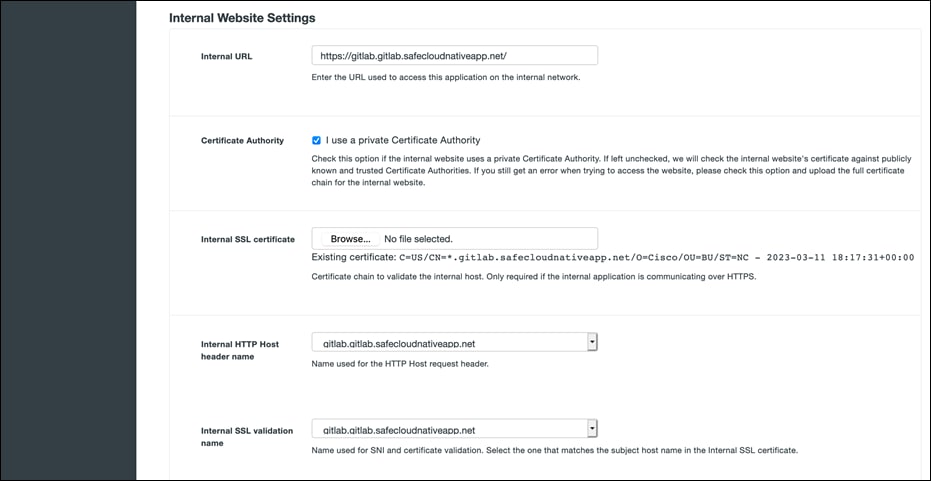
● Scroll down to the Internal website settings section. Configure the settings related to the internal application. Provide the internal domain name for Gitlab (http://gitlab.gitlab.safecloudnativeapp.net). Once you've filled in all the required fields, click Add Application
In a similar manner, repeat the steps to protect any other privately hosted dev application or tool that you need to expose.
Step 3. Now, we will protect the SSH connection to GitLab host
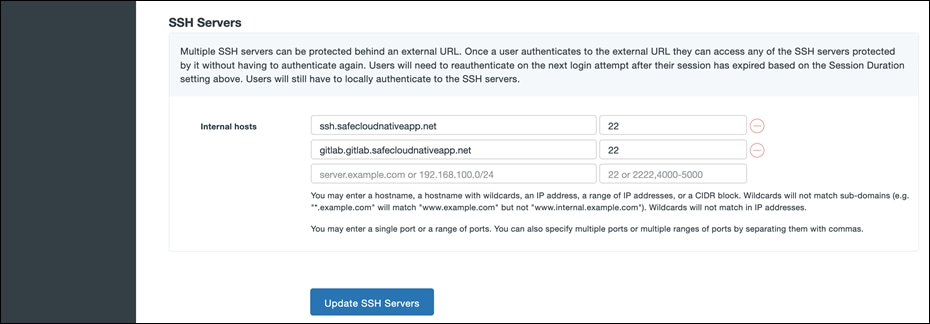
● Create an external DNS record pointing to DNG portal, example- ssh.cloudnativesafeapp.net pointing to portal.safecloudnativeapp.net. A group of SSH servers can be protected behind a single external URL
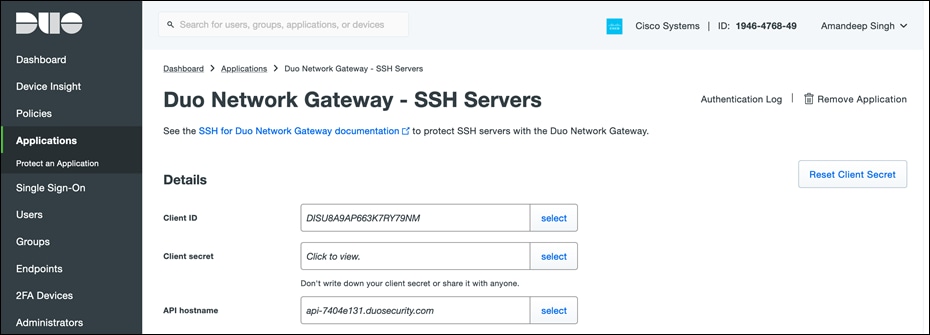
● Log in to the Duo Admin Panel and navigate to Applications and click Protect an Application and locate the 2FA-only entry for Duo Network Gateway - SSH Servers in the applications list. Click Protect to the far-right to configure the application and get the Client ID, Client secret, and API hostname. We will need this information to complete your setup
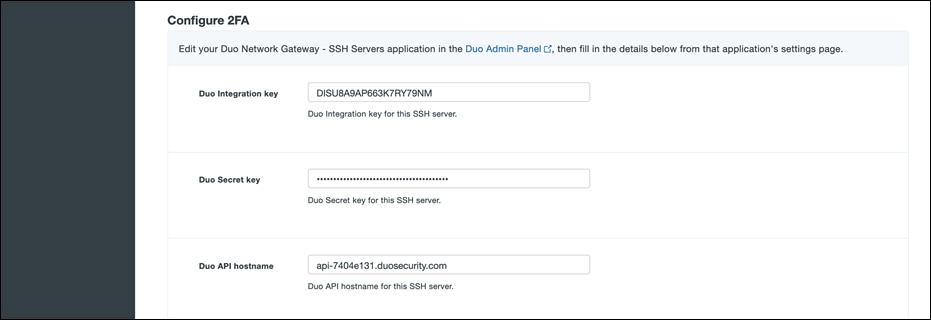
● Navigate to the Duo Network Gateway admin console and click the Applications link on the left-hand side of the screen. On the Applications page click Add New... and select SSH Servers from the drop-down options. You will be taken to a new page. Under Configure 2FA enter the Client ID, Client secret, and API hostname from the application created earlier in the Duo Admin Panel
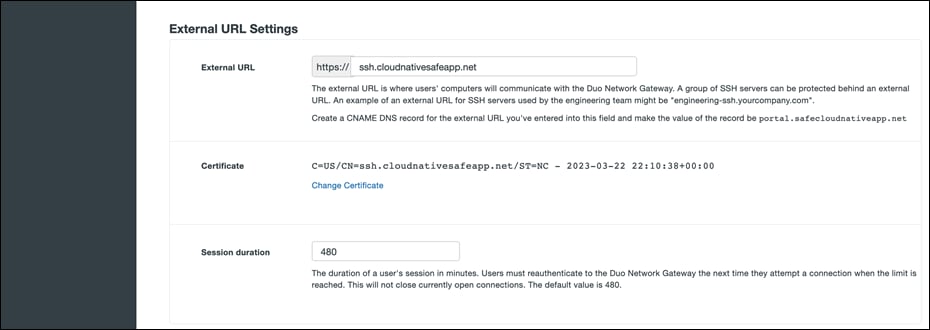
● Scroll down to the External URL Settings section. In the External URL field enter hostname of the external DNS record created earlier. Select Provide my own certificate next to Certificate Source. Upload the certificate created as prerequisite
● Scroll down to the SSH Servers section. Fill in all the required fields, click Add SSH Servers. Since the Git CLI client doesn’t support SSO over HTTP, we need to expose SSH connection to private Gitlab instance to enable the use of Git CLI for SCM operations
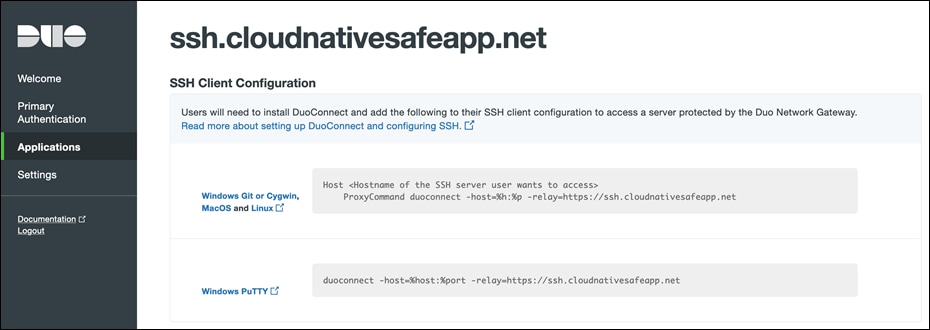
● Once the page reloads, you'll see a new section at the top of the page called SSH Client Configuration with SSH client configuration to provide to the end users after they configure DuoConnect. Using the Duo Network Gateway to protect SSH servers requires a small software install on the user's computer called DuoConnect. Follow the Duo documentation to install DuoConnect to end user machine based on Operation System and set up the SSH configuration file as below

Design Validation
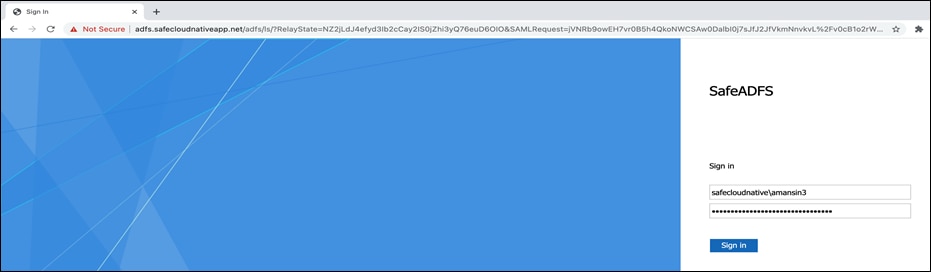
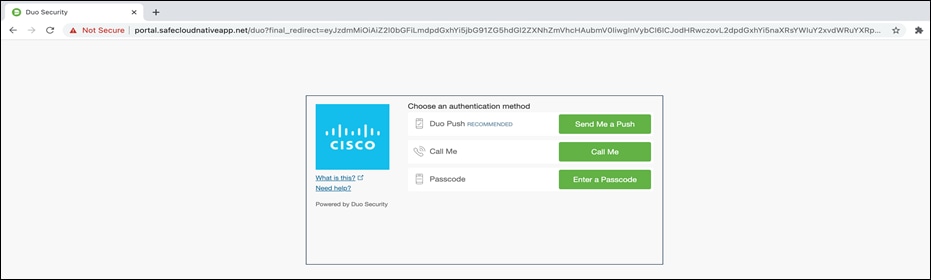
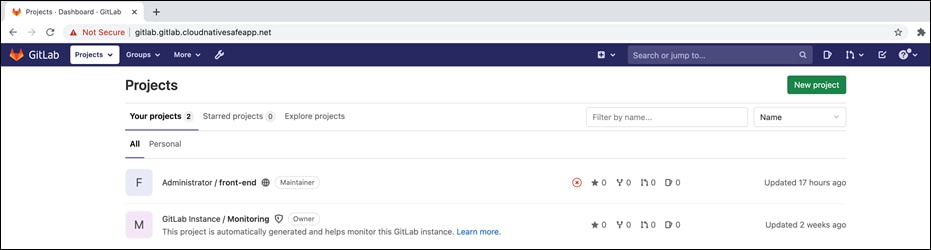
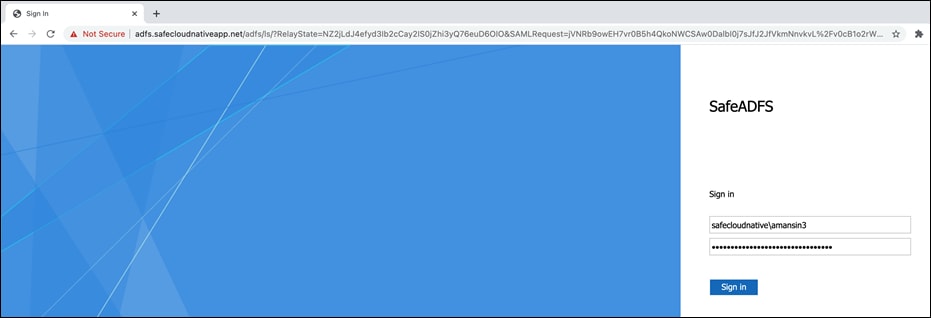
● Accessing Gitlab Web Application - Go to the browser on a client machine and access the Gitlab URL (https://gitlab.gitlab.cloudnativesafeapp.net). Browser window will be redirected to AD FS URL for initial authentication. Once the credential is added, the window is redirected to DUO portal for MFA
GitLab web portal can be accessed after the MFA is completed. If the end application is not capable of SSO then it would prompt for another authentication (GitLab instance version used for validation did not support SSO)
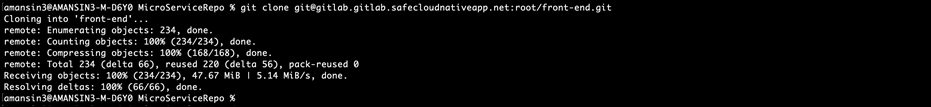
● Performing Git CLI operations - Launch CLI utility on the client machine and clone a git repo from the GitLab instance
git clone git@gitlab.gitlab.safecloudnativeapp.net:root/front-end.git
The Git Operation will pause and launch a browser window prompting for the organization credentials. Add the credentials, click on Sign in and this would initiate MFA process.
Note: Prior to running this test, the SSH keys from client machine were added to Gitlab. Browser cache was to be cleared as well.
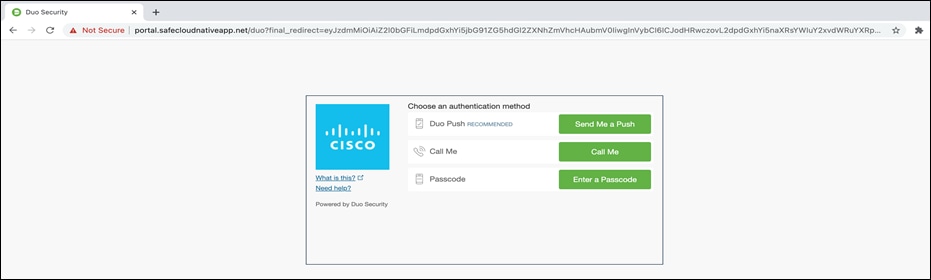

Once the DUO MFA is completed, the Git operation on CLI will resume towards completion. From this point onwards, the SSO credentials are cached for the defined period of time.
SSH to a private bastion host would also go through same set of authentication steps as with Git CLI if there was no prior authentication.

Prerequisites
● Record the Observable ID from Cisco Secure Cloud Analytics portal
Implementation Summary
Step 1. Set up the Azure NSG flow logs monitoring
Step 2. Integrate with staging and production AKS clusters
Implementation Procedure
Step 1. We will set up Azure NSG flow log monitoring now.
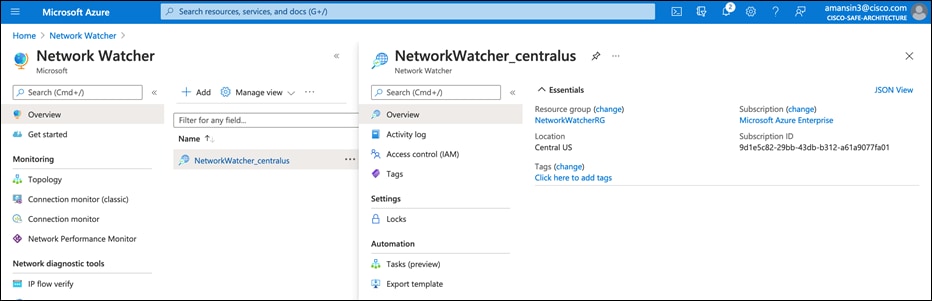
· Navigate to Network Watcher > Overview. Click on + Add to enable Network Watcher on the target regions i.e. the Hub Resource Group Region
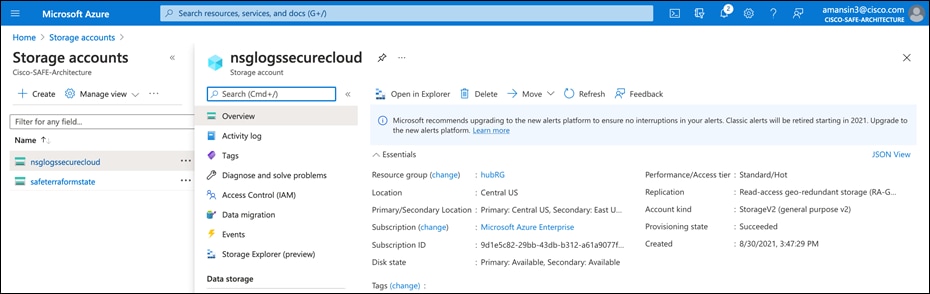
· To store NSG flow Logs, you'll need Storage Accounts in the same locations as your target resource groups. A storage account with Blob storage capabilities (StorageV2 or BlobStorage) is created already (as part of initial infrastructure provisioning using Terraform)
· Navigate to Azure Active Directory > Overview and retrieve AD name. Copy your Primary Domain value (e.g.- ciscosafearchitecture.onmicrosoft.com)
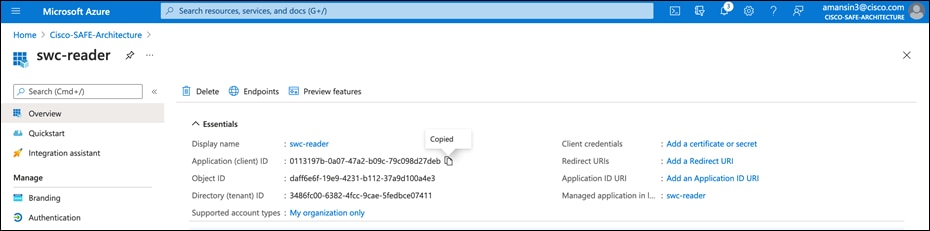
· Navigate to Azure Active Directory > App Registrations > New registration. Add the Name: swc-reader and leave others field as default. After the application is created, copy the Application ID
· Select Certificates & secrets. Click the New client secret button, and fill out the form as follows:
Description: SWC Reader
Expires: Never
Click the Add button and copy the generated value. This is the Application key
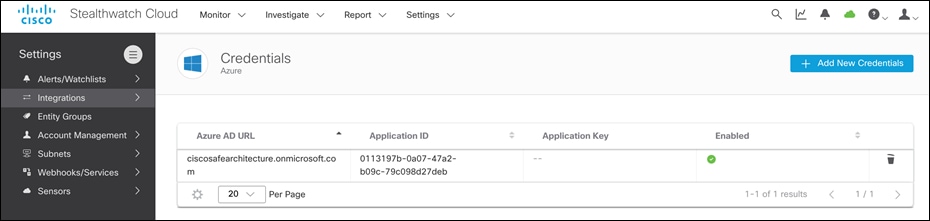
· On the Secure Cloud Analytics console, add the collected Azure AD URL, Application ID, and Application key under the Settings > Integrations > Azure > Credentials tab
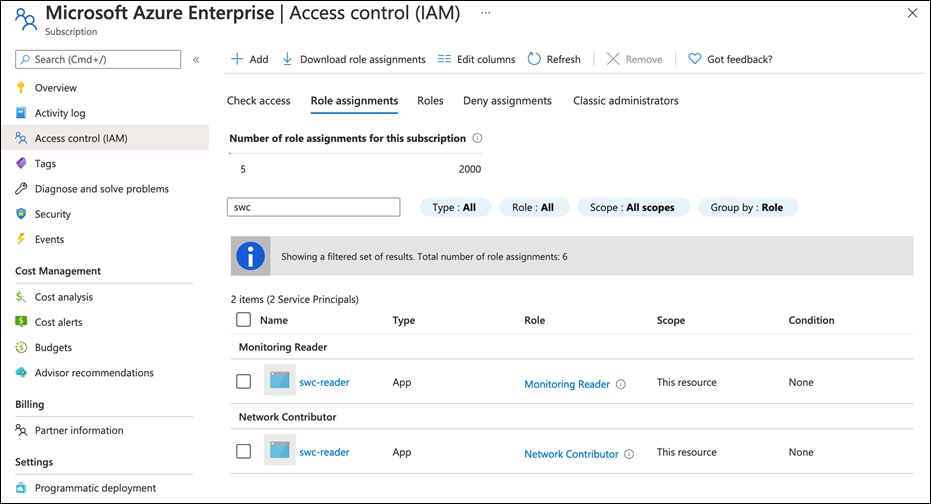
· Navigate to Subscriptions and select your subscription on Azure console. Select Access Control (IAM) option. Perform this step for both the Network Contributor and Monitoring Reader roles individually. Click the Add button, select Add role assignment tab, select the role from the dropdown list (Network Contributor and Monitoring Reader) and Assign access to: Azure AD user, group, or service principle. Select swc-reader and click the Save button
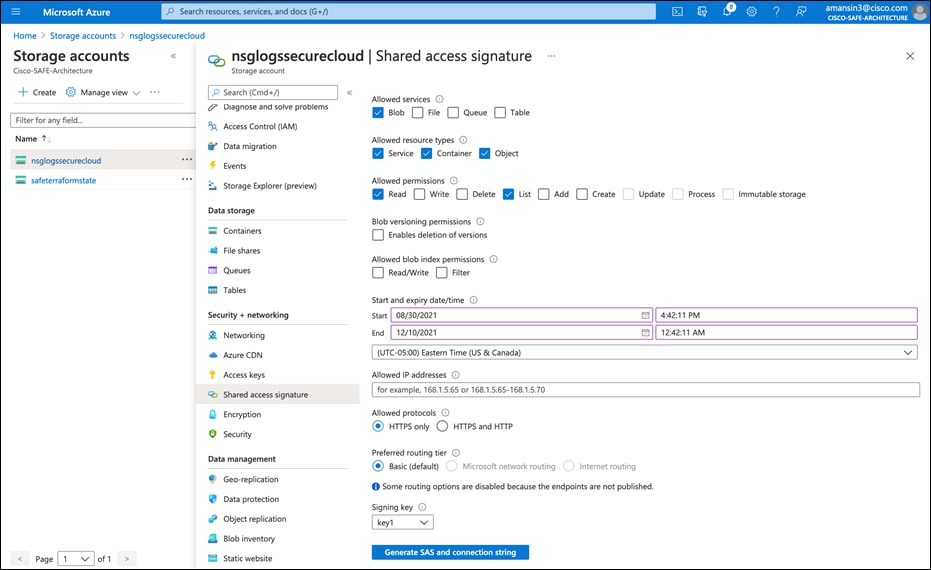
· Navigate to Storage Accounts and select Shared access signature and fill out the form as follows:
Allowed services: Blob
Allowed resource types: Service, Container, and Object
Allowed permissions: Read and List
Start and end times: Set these to begin now and end some point in the future (at least one year)
Allowed protocols: HTTPS
Click Generate SAS and connection string. Copy the Blob service SAS URL
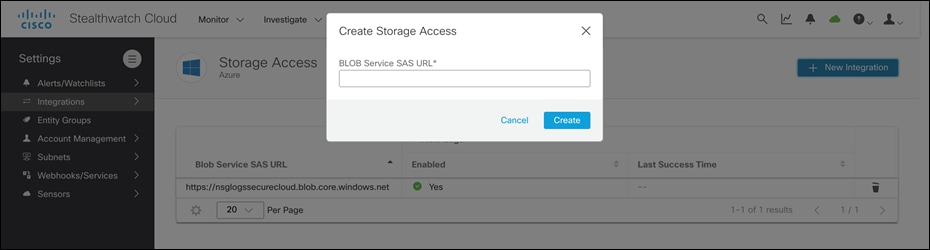
· On the Secure Cloud Analytics console, navigate to Settings > Integrations > Azure > Storage Access. Click on +New integration and add the copied Blob service SAS URL
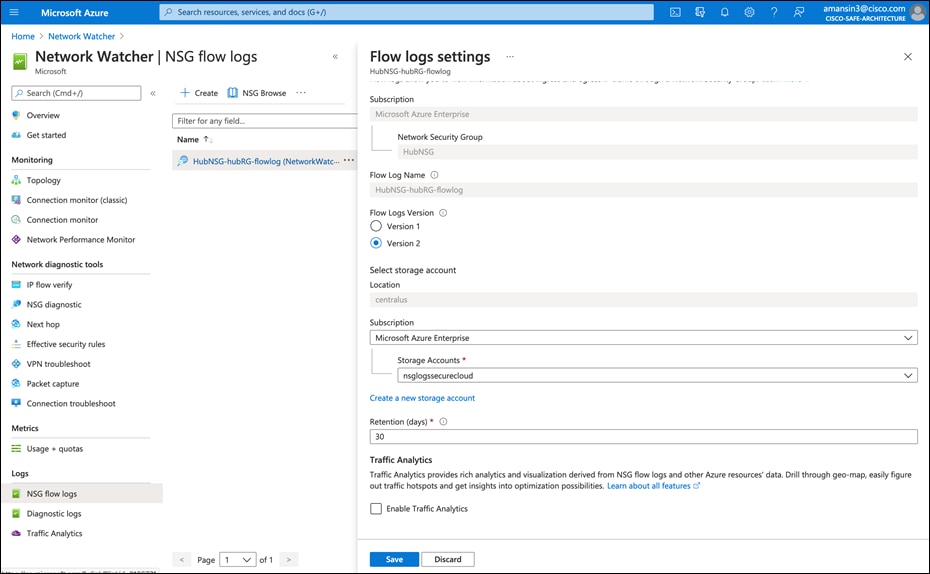
· Navigate to Network Watcher > NSG Flow Logs. The list of Network Security Groups appears. Select an HubNSG and Fill out the form as follows:
Status: On
Flow Logs version: Version 2
Storage account: Select the storage account create earlier in this section.
Retention: 30
Click the Save button
At this point Cisco Secure Cloud Analytics is set up to read and process the NSG flow logs from Hub Resource Group. Click on the green cloud icon on the top right-hand side of the Secure Cloud Analytics portal to see Azure sensor. The green color indicates successful integration.
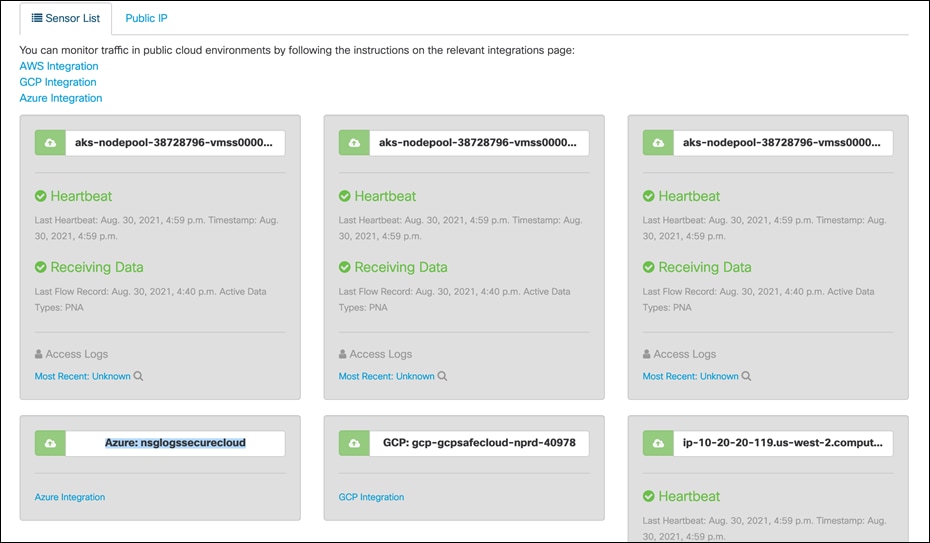
Note: Refer to the documentation on the Cisco Secure Cloud Analytics GUI interface for detailed manual steps.
Step 2. Now we will Integrate with staging and production AKS clusters with Secure Cloud Analytics.
· The Secure Cloud Analytics UI displays the detailed integration steps under Settings > Integrations > Kubernetes. Follow the steps on the UI, instructions below are only to demonstrate the integration for staging cluster, repeat the same steps to integrate the production cluster
· Log into the bastion host and point the azure cli to staging EKS cluster.
az aks get-credentials --name spoke1akscluster --resource-group spoke1RG
· Enter the commands below to create Kubernetes secret (use the secret string available on the portal)
echo -n "WwFx7sxGctIzcUdNqxWwFx7sxGctIzcUdNWwFx7sxGctIzcUdN" > obsrvbl-service-key.txt
kubectl create secret generic obsrvbl --from-file=service_key=obsrvbl-service-key.txt
rm obsrvbl-service-key.txt
· After creating the secret, create a new service account and bind it to the read-only cluster role:
kubectl create serviceaccount obsrvbl
kubectl create clusterrolebinding "obsrvbl" --clusterrole="view" --serviceaccount="default:obsrvbl"
· Next, create a Kubernetes daemonset using the obsrvbl-daemonset.yaml (A sample YAML manifest is also available on the Secure Cloud Analytics Console itself). This configuration file describes the specifications for a sensor pod to be run as daemonset on each node
kubectl create -f obsrvbl-daemonset.yaml
Design Validation
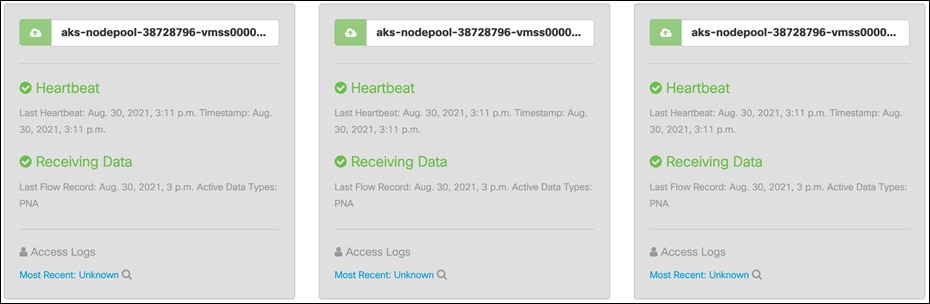
● Use the kubectl CLI to find out the IP address of a pod for any microservice, example below shows a pod for carts microservice

Switch to Secure Cloud Analytics dashboard and navigate to Investigate > By IP Address and add the pod IP along with Start Date and End Date to filter out the flows for this specific pod. List flows confirms successful integration.
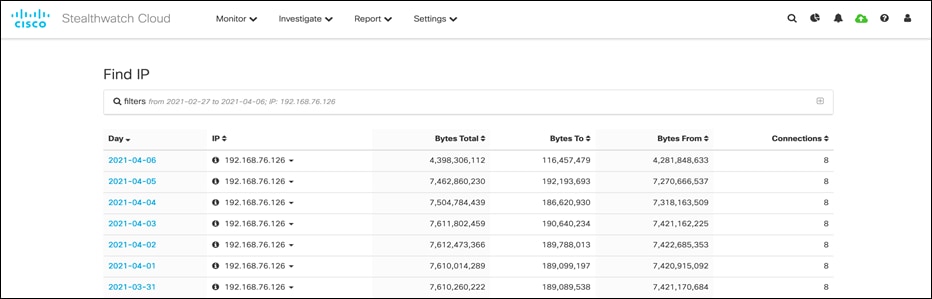
● In a similar manner as above, lets verify flows records for bastion host. Go to Secure Cloud Analytics dashboard and navigate to Investigate > Session Traffic, add the IP address in the filter options and click on Update to see the sessions
● To verify the Azure Cloud Posture, navigate to Investigate > Event Viewer and switch to Cloud Posture tab. The Secure Cloud Analytics actively monitors Azure environment for compliances and the dashboard displays a detailed report on compliance status
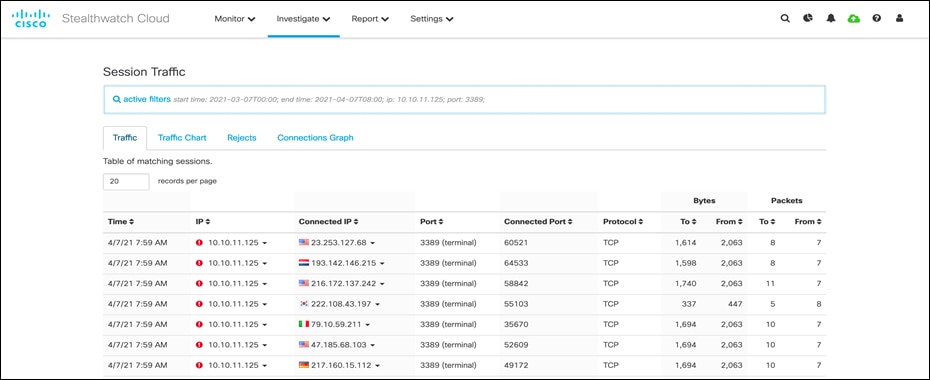
● Cisco Secure Cloud Analytics network activity to look for any unexpected logins. An alert is generated if a device is accessed from a remote location that doesn’t normally access the resource
● Cisco Secure Cloud Analytics detects data exfiltration attempts over DNS protocol
● If an algorithmically generated domain is resolved on the any of the Azure resources or AKS cluster then Cisco Secure Cloud Analytics records such an observation for threat hunting
Radware Kubernetes Web Application Firewall
Prerequisites
● Kubernetes WAF is installed on the staging and production cluster. Refer to the Radware KWAF documentation (login required) for initial installation
Implementation Summary
Step 1. Apply web security policy profile to frontend microservice
Step 2. Update frontend Kubernetes deployment and service object definitions
Implementation Procedure
Step 1. In this step we will create policy profile for applying WAF security to Frontend microservice of Sock Shop application in staging environment.
● Login to the bastion host and point to the staging AKS cluster using Azure CLI
az aks get-credentials --name spoke1akscluster --resource-group spoke1RG
● Create a policy profile for with WAF controls using the YAML manifest sockshop-policy-profile.yaml
Kubectl apply -f sockshop-policy-profile.yaml
Step 2. Update the frontend deployment and service object definitions to include the inline enforcer container. Use the YAML manifest frontend-with-waf.yaml
Kubectl delete deployment front-end -n sock-shop
Kubectl delete service front-end -n sock-shop
kubectl apply -f frontend-with-waf.yaml
Kubectl get pods -n sock-shop
Once the validation is completed in staging environment, same steps and manifest files can be followed to deploy the WAF security in production environment.
Design Validation
● Browse the web application and try to inject OS commands (for example – uname -r) in the URL. The Kubernetes WAF will detect and block any such malicious attempts
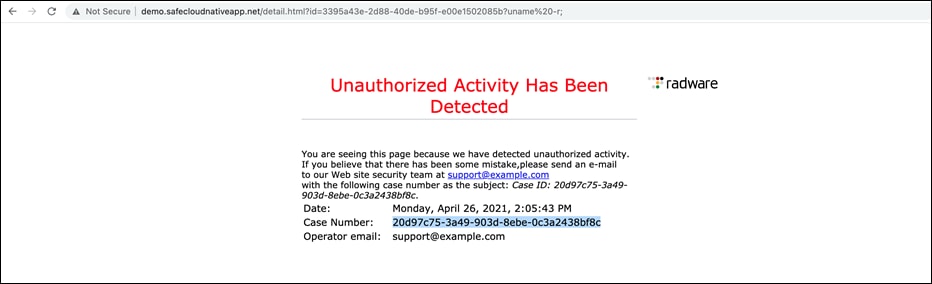
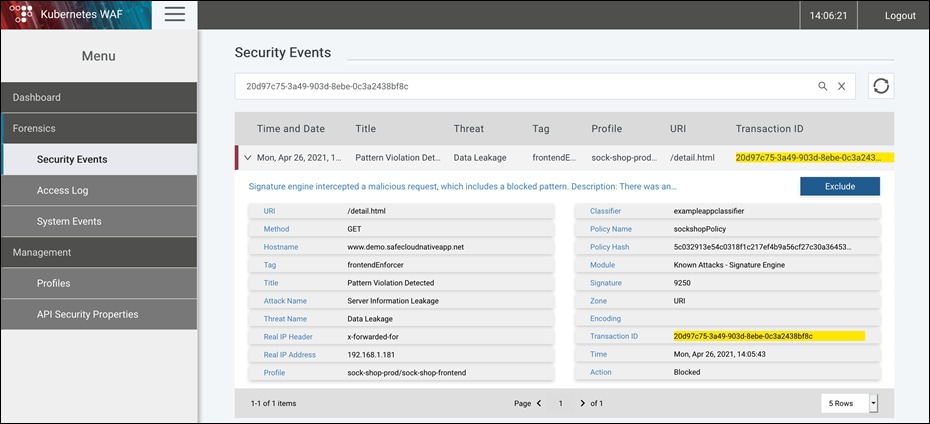
● Copy the Case Number from the block page notification on browser. Login to KWAF dashboard, navigate to Forensics> Security Events and filter the events using copied string to see the detailed information on related event
Prerequisites
● A VM instance (RHEL/CentOS 7 (x86_64), 2 CPU cores and 4 GB RAM) in the Hub VNet
● Ensure the VM has outgoing connectivity on TCP port 443
Implementation Summary
Step 1. Download and install the secure connector
Step 2. Set up the external Kubernetes Orchestration
Step 3. Install daemonset on AKS nodes
Step 4. Create the scopes for stage and production environment
Step 5. Create agent configuration profile and add it to scopes
Step 6. Create inventory filters
Step 7. Create application workspace, policies and enable policy enforcement
Implementation Procedure
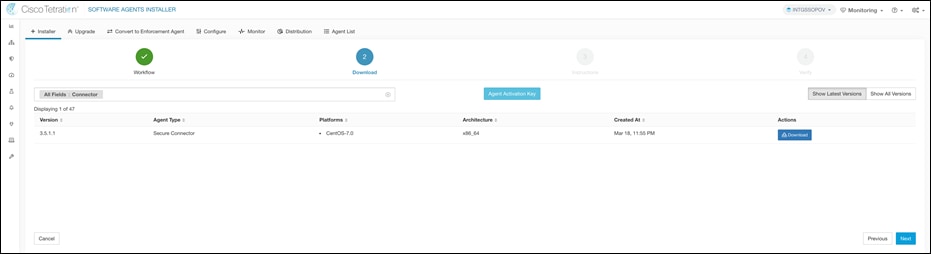
Step 1. We need a secure connector to enable connectivity between Cisco Secure Workload and API servers for Staging and Production AKS clusters (AKS clusters are configured for private access). Navigate to Monitoring > Agents > Installer + on Cisco Secure Workload dashboard. Select Manual Install using classic packaged installers and click on Next. Filter the packages using “connector” string and click on Download to download the package. Copy the download package to Secure Connector VM instance in the Hub Resource Group. Install the copied Package.
sudo rpm -ivh tet-secureconnector-client-site-3.5.1.17-el7.x86_64.rpm

● Click on setting icon on the UI and navigate to API Keys and click on Create API key to create one. Note that the API key used must have the external system integration capability and must have write access to the specified root scope
● Download the bash script and update it with HOST, API_KEY, API_SECRET and ROOTSCOPE_NAME. Run the script to retrieve the registration token
HOST=https://mytaas.portal.com
API_KEY="b404cbc640666bc 2ac404cbc640666bc
API_SECRET="de8c242af09404cbc641510d7c9c69412d45e23c6"
ROOTSCOPE_NAME="MYROOTSCOPE"
./secureconnector.sh
● Stop the secure connector and copy the registration token. Once the token is copied, start the secure connector. At this point the connector is fully set up
sudo systemctl stop tetration-secure-connector
sudo cp registration.token /etc/tetration/cert/registration.token
sudo systemctl start tetration-secure-connector
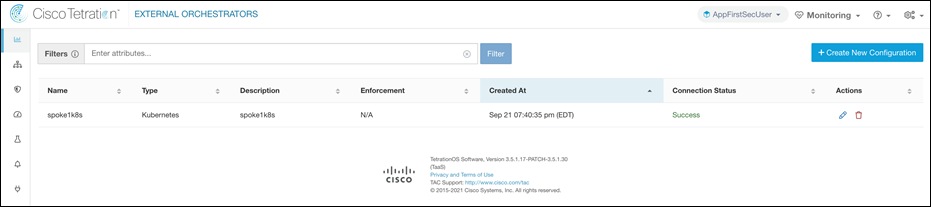
Step 3. Navigate to Visibility > External Orchestration on Cisco Secure Workload dashboard. Click on +Create New Configuration. Fill in all the details as below.
Type: Kubernetes
K8s Manager Type: None
Cluster Name: spoke1k8s
Description: spoke1k8s
CA Certificate: Use CLI - terraform output cluster_ca_certificate | base64 -d
Token: Create read only cluster role for tetration and obtain the token using kubectl.
kubectl apply -f k8s-workload-readonly.yaml
kubectl get secret --namespace=default `kubectl --namespace=default get sa tetration-read-only -o json | jq -r '.secrets[0].name'` -o json | jq -r '.data.token' | base64 -d ; echo
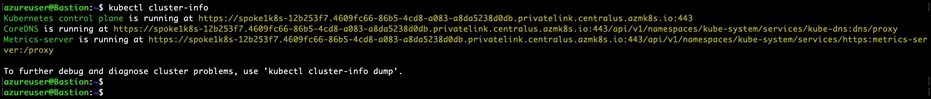
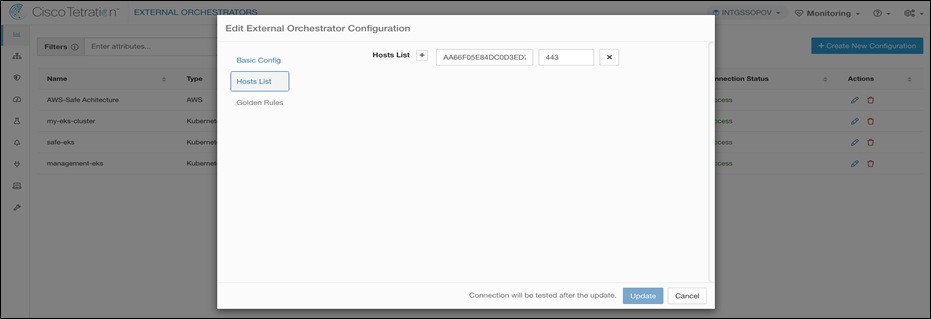
· Switch to Hosts List tab from vertical menu on the left-hand side and add API server endpoint address and port details for the AKS cluster (use CLI kubectl cluster-info to grab the API Control plane details). Once all the details are added, click on Create to finish the set up. AKS cluster orchestration will show as Success in few mins. Repeat the same steps for production AKS cluster.
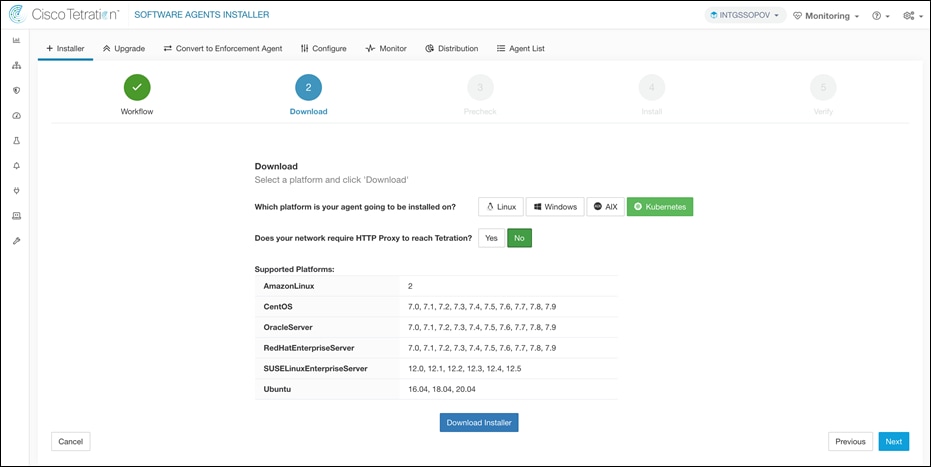
Step 4. Navigate to Monitoring > Agents > Installer + on Cisco Secure Workload dashboard.
● Select Auto-Install Agent using an Installer and click on Next. Select Kubernetes and Download Installer
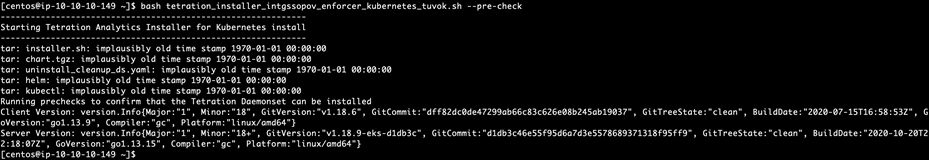
● Copy the script to bastion host and run the pre-check to make sure that all the requirements for installing enforcement agents meet
scp -i azure.pem tetration_installer_intgssopov_enforcer_kubernetes_tuvok.sh azureuser@$(terraform output BastionLinuxHostIP):
bash tetration_installer_intgssopov_enforcer_kubernetes_tuvok.sh --pre-check
● Install the enforcement agents (daemonsets objects) on Kubernetes nodes by running the bash script. Verify the Tetration agent pods in the namespace tetration on the AKS cluster
bash tetration_installer_intgssopov_enforcer_kubernetes_tuvok.sh
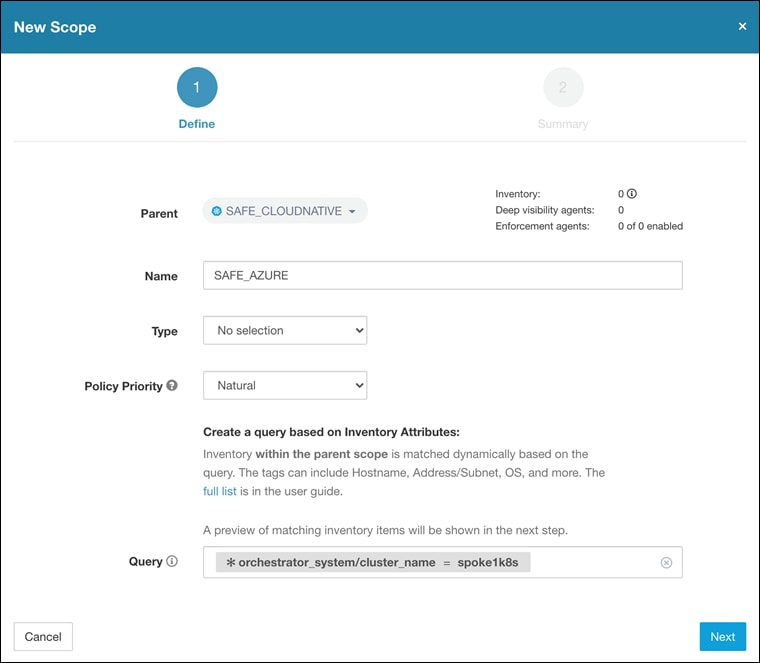
Step 2. Click settings icon on the top right-hand side corner of the Cisco Secure Workload console, and then Scopes to enter scope configuration. Select a parent scope (e.g., Azure) and click on Add to create the scope for the Staging cluster. Use the query - *orchestrator_system/cluster_name = spoke1k8s.
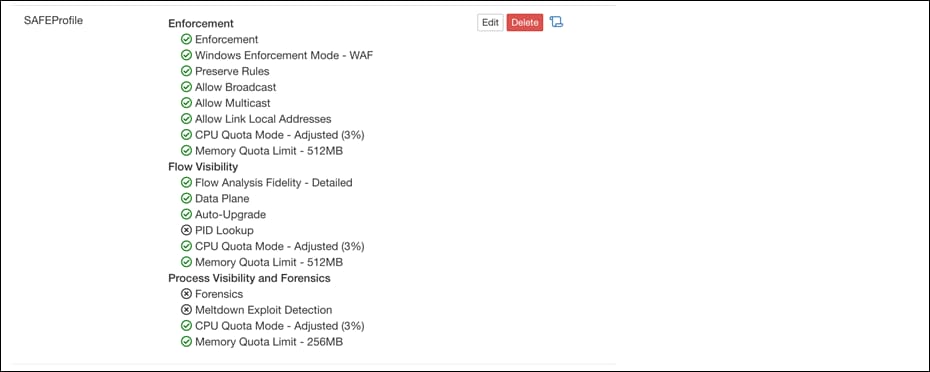
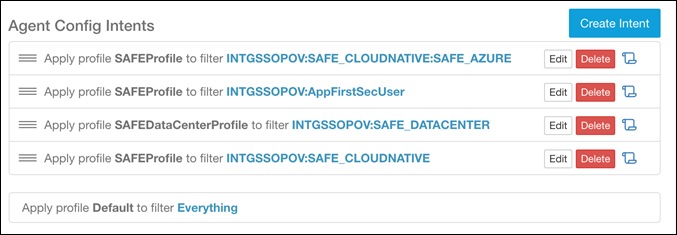
Step 5. Now, navigate to Software Agent Config on Secure Workload dashboard. Click on Create Profile to create an agent configuration profile, make sure enforcement capability is enabled. On the same page, click on Create intent to apply the agent configuration profile to the newly created scopes in step 4 above.
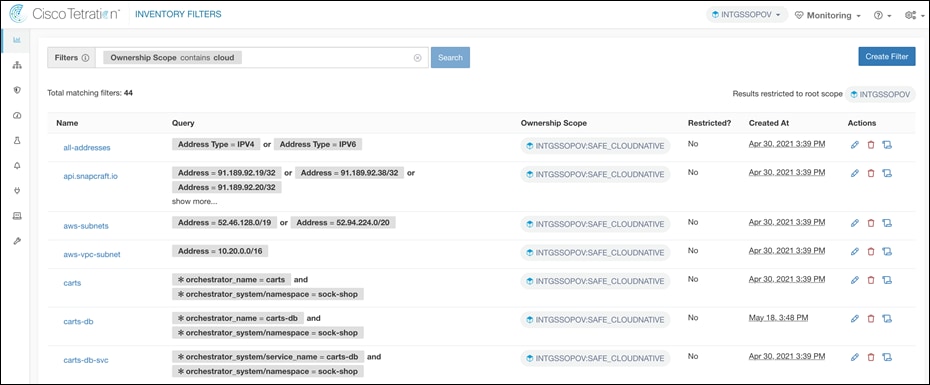
Step 6. Login to the bastion host. Update the variables in the file $HOME/Cisco-Validated-Designs/safe-cloud-caas-azure/Cisco Secure Workload/ansible/host_vars/tetration.yaml as per your environment. Run the ansible playbook for inventory filters (sockshop-filters.yaml) in directory Cisco-Secure-Workload > ansible to create inventory filters.
ansible-playbook sockshop-filters.yaml
Step 7. Run the ansible playbook (sockshop-policies.yaml) to create the application workspace, policies and enable enforcement for staging environment. Once policies are validated on staging environment, same steps can be followed for production environment.
ansible-playbook sockshop-policies.yaml
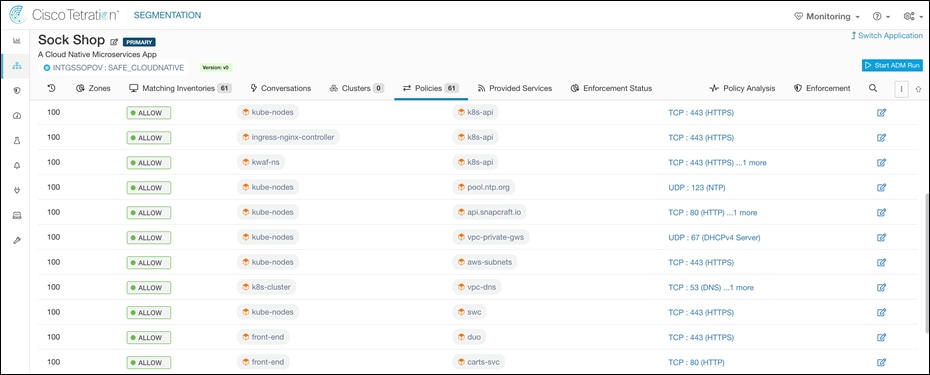
Design Validation
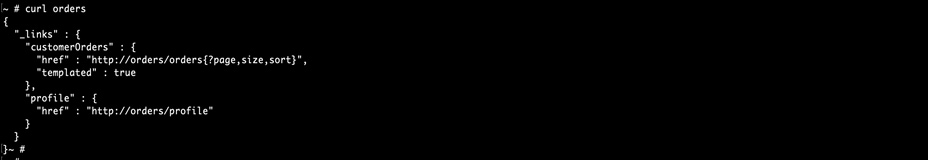
● Frontend microservice of the Sock Shop application is allowed to communicate with Orders microservice before applying the policies
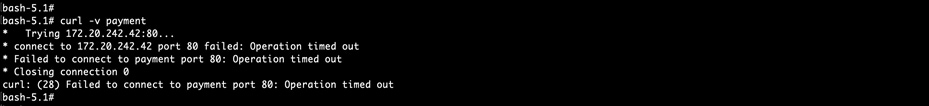
● The communication from Frontend microservice to the Payment microservice is blocked after applying the policies
Appendix A – Setting up the Azure Infrastructure and Dev environment
The application environment is set up as shown in architecture diagram above. This section of the Appendix covers the following:
Implementation Summary
Step 1. Set up GitLab repositories
Step 2. Set up GitLab runners
Step 3. Deploy the production and staging applications
Step 4. Set up GitLab CI/CD pipelines
Prerequisites
● Use Terraform modules shared here to create the Azure infrastructure – Resource Groups, Virtual Networks, Subnets, Route Tables, Peering links. The Terraform module also privisions bastion hosts (with pre-installed utilities – az cli, kubectl, helm, git client.), Duo Network Gateway, GitLab Instances and a VM for Secure Workload Connector in the Hub VNet
● You would need to manually stand up Microsoft AD (private IP only) and ADFS instance(with public IP) in the Hub Subnet B and Hub Subnet A respectively. The shared Terraform scripts doesn’t provision these two resources
● Wherever needed use the terraform output cli to obtain the IP addresses for bastion hosts, GitLab Runner, Duo Network Gateway and Secure Workload Connector and other resource related details
Set up GitLab repositories
Follow the steps below to initialize the GitLab instance.
Step 1. Once the terraform run is completed, use SCP to copy the SSH Key and kubeconfig file to the bastion host and then SSH to the bastion host.
echo "$(terraform output vm_ssh)" > azure.pem && chmod 400 azure.pem
scp -i azure.pem azure.pem azureuser@$(terraform output BastionLinuxHostIP):
ssh -i azure.pem azureuser@$(terraform output BastionLinuxHostIP)
Step 2. Run the commands below to get root credentials to GitLab Instance.
ssh -i azure.pem azureuser@<GitLabHostIP> 'sudo cat /etc/gitlab/initial_root_password'
RDP to the Windows bastion host using crede kubectl create namespace appdynamics
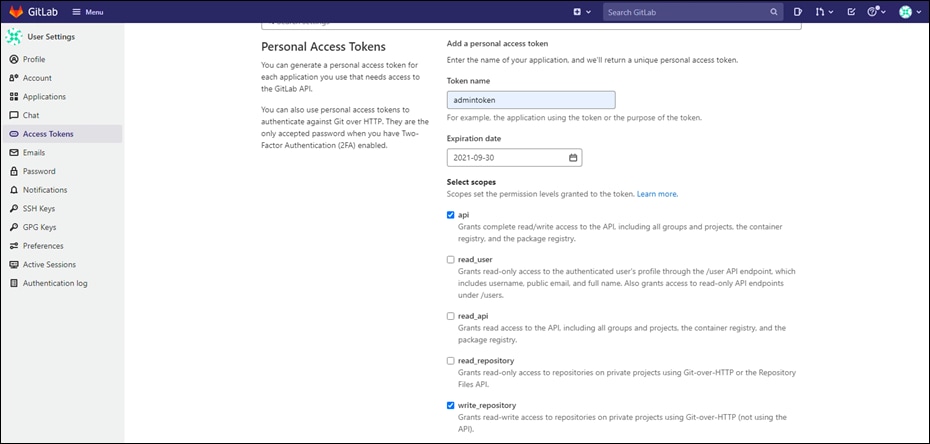
Step 3. cantials from Terraform output (Azure Portal: Home > Virtual Machines > BastionWin > Connect > Download RDP file). Launch a browser session and login to the GitLab instance(terraform output GitLabHostURL) using GitLab credentials from Step2. Navigate to User settings > Access Tokens and create a token with api and write_repository permissions. Record the token value, you will need it in Step 5 below.
Note: It takes 20-25 mins after the terraform run is completed for the GitLab Instance to be fully initialized. Also, you may want to install chrome for better UI experience.
Note: The GitLab instance is not accessible over the internet yet, we will set up Duo Network Gateway in the Appendix C of this document to securely expose the GitLab instance over internet.
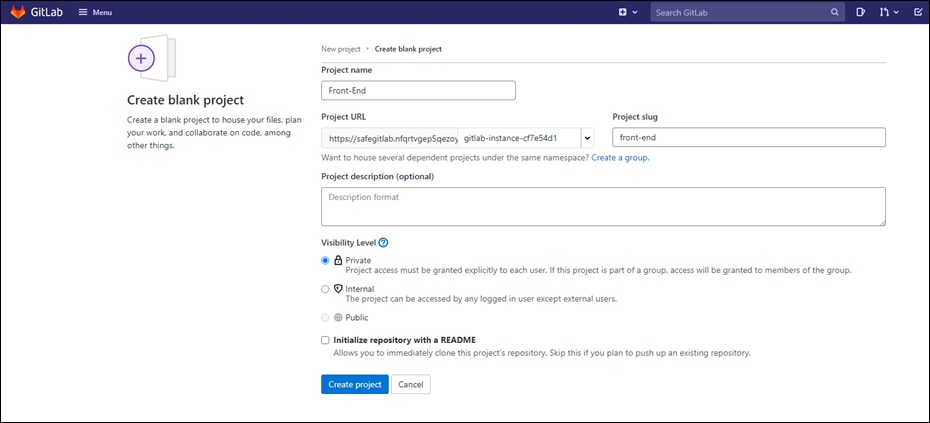
Step 4. Navigate to GitLab homepage and click on New Project > Create Blank Project. Fill in the appropriate details and Create project for the front-end microservice. Make sure to uncheck the Initialize repository with a README option.For the purpose of this document, we will focus on front end microservice. However, same steps can be followed to set up the projects for other Sock Shop microservices.
Step 5. Run the commands below on bastion host to clone the front-end microservice source code and set up a local Git repo and point it to private GitLab remote repo created in Step4.
git clone https://github.com/amansin0504/azure-front-end.git front-end && cd front-end
git config --global user.name "Administrator" && git config --global user.email "admin@safelab.com"
git remote rm origin
git remote add origin http://Administrator:<GitLabToken>@<GitLabFQDN>/<GroupName>/front-end.git
git push -u origin --all
Note: The the repo includes GitLab CI/CD pipeline configuration file (.gitlab-ci.yaml). Complete source code can be found at Sock Shop microservices demo application.
Set up the GitLab runners
This section covers the steps to create GitLab runners.
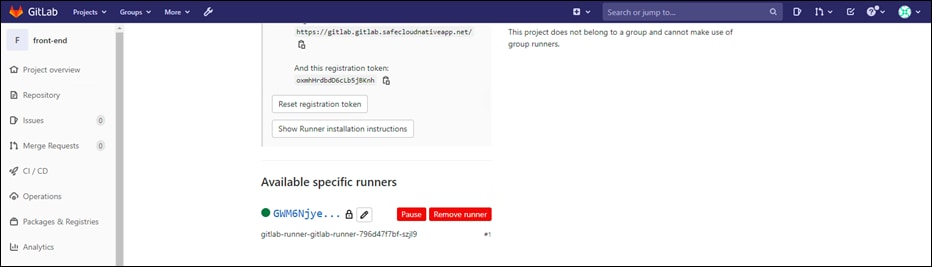
Step 1. Login to Gitlab UI and navigate to Settings > CI/CD under front-end project and expand the Create Runners section by clicking on Expand button. Leave this page open, we will need the GitLab URL, and Registration token shown on this page in the next step.
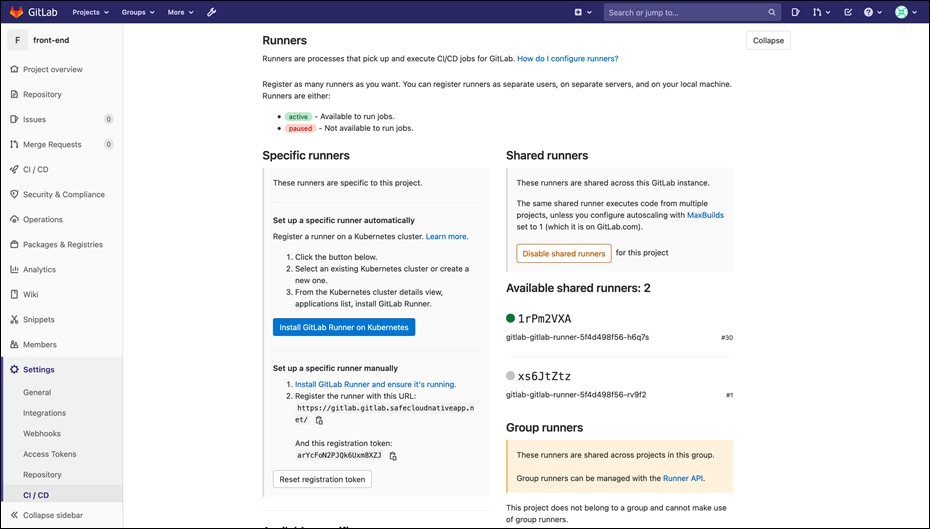
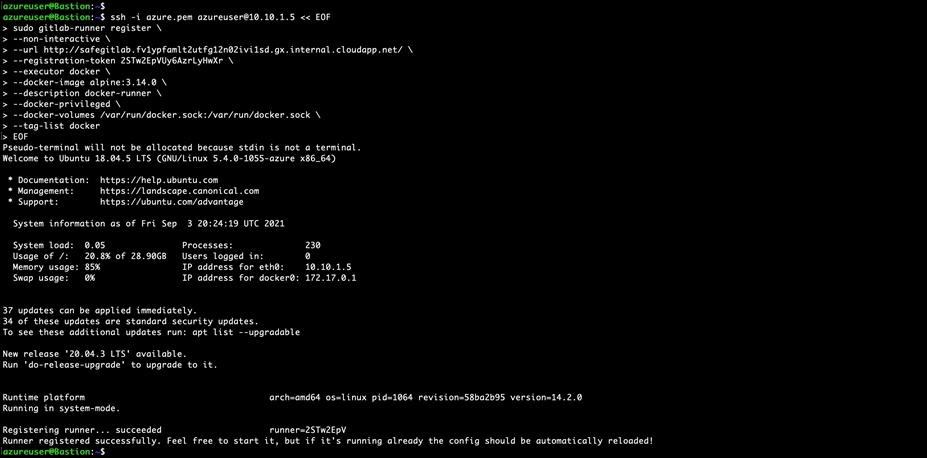
Step 2. SSH to the bastion host, update the command below with GitLab runner IP address from terraform output and, registration token and URL copied in Step 1 and run the command to register the GitLab runner.
ssh -i azure.pem azureuser@<GitLabRunnerIP> << EOF
sudo gitlab-runner register \
--non-interactive \
--url <GitLabURL> \
--registration-token <GitLabRegistrationToken> \
--executor docker \
--docker-image alpine:3.14.0 \
--description docker-runner \
--docker-privileged \
--docker-volumes /var/run/docker.sock:/var/run/docker.sock \
--tag-list docker
EOF
Deploy the production and staging application
Follow the steps below to deploy Sock Shop demo application to production and staging environments.
Step 1. SSH to the Linux bastion host and authenticate the azure CLI. Follow the documentation for more details.
az login
Step 2. Install the Nginx ingress controller on both the clusters
az aks get-credentials --name spoke1akscluster --resource-group spoke1RG
kubectl apply -f https://raw.githubusercontent.com/kubernetes/ingress-nginx/controller-v0.48.1/deploy/static/provider/cloud/deploy.yaml
az aks get-credentials --name spoke2akscluster --resource-group spoke2RG
kubectl apply -f https://raw.githubusercontent.com/kubernetes/ingress-nginx/controller-v0.48.1/deploy/static/provider/cloud/deploy.yaml
Step 3. Deploy an initial version of application to staging and production eks clusters using the YAML (sock-shop-with-
ingress.yaml) manifest.
az aks get-credentials --name spoke1akscluster --resource-group spoke1RG
kubectl apply -f https://raw.githubusercontent.com/cisco-security/Cisco-Validated-Designs/master/safe-cloud-caas-azure/sock-shop-demo/sockshop-withLB.yaml
az aks get-credentials --name spoke2akscluster --resource-group spoke2RG
kubectl apply -f https://raw.githubusercontent.com/cisco-security/Cisco-Validated-Designs/master/safe-cloud-caas-azure/sock-shop-demo/sockshop-withLB.yaml
Step 4. Create public DNS records for stage and production application. The DNS records will point to Load balancer
addresses. Run the command below to get the Load balancer address for front-end service
used to expose the application.
kubectl get svc front-end -n sock-shop
Set up the Gitlab CI/CD Pipeline
Step 1. Go to Menu > Admin > Setting > Network. Expand Outbound requests section and enable Allow requests to the local network from web hooks and services.
Step 2. Follow the GitLab documentation to integrate the AKS cluster with GitLab. This would enable automated deployment to Kubernetes clusters using CI/CD pipelines.
Step 3. Navigate Settings > CI/CD under front-end project and expand the Variables section. Add the key pair value pairs below as CI/CD Environment variables. This will allow GitLab to push container images to the private Azure registry.
DOCKER_REGISTRY: (Use terraform cli – ‘terraform output RegistryLogin‘)
REGISTRY_USERNAME: (Use terraform cli – ‘terraform output RegistryUser’)
REGISTRY_PASSWORD: (Use terraform cli – ‘terraform output RegistryPassword’)
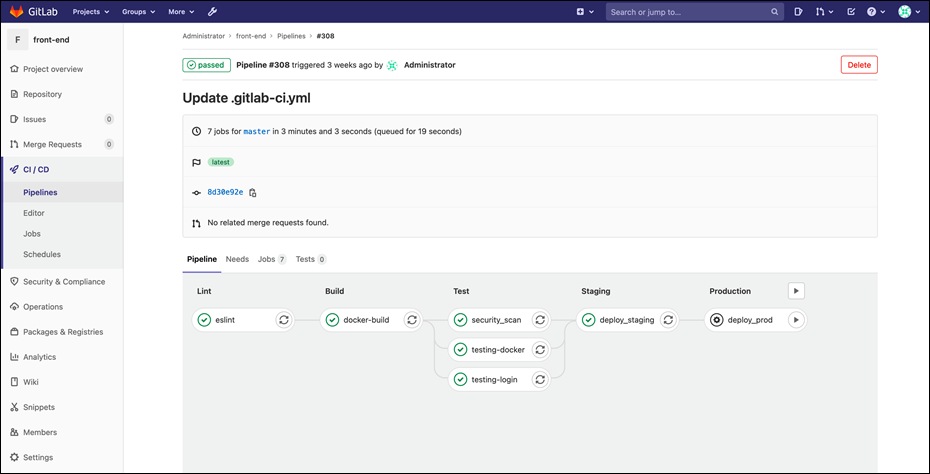
Step 4. Make a test git push to front-end repo and that should trigger the GitLab CI/CD pipeline to build, test, scan and deploy the new image to stage and production environments that we set up above. Go to CI/CD > pipelines on the sidebar and click on the latest pipeline run to see the status of the pipeline run. The pipeline builds and deploys the updated image to the Kubernetes cluster.
Appendix B – Installing Duo Network Gateway
Prerequisites
● A domain controller hosted in private subnet in Hub VNet with Active Directory service and private CA.
● Microsoft AD FS server in the public subnet (Integrated with the Active Directory Service hosted in private subnet). Duo Network Gateway requires a SAML 2.0 Identity Provider (IdP) to use as its primary authentication source. We use AD FS as SAML identity provider
● Duo Network Gateway is provisioned and installed (Terraform modules include this)
● Public DNS record pointing to AD FS server. We use the DNS name adfs.safecloudnativeapp.net
Implementation Summary
Step 1. Create DNS record for Duo Network Gateway
Step 2. Install Docker and Docker compose on VM instance
Step 3. Install DNG using docker-compose
Step 4. Access the DNG admin console and do the initial set up
Step 5. Configure AD FS to be used as Authentication Source for DNG
Step 6. Configure authentication source on DNG admin console
Implementation Procedure
Step 1. Register a public domain name record pointing to DNG instance. We use the DNS name portal.safecloudnativeapp.net.
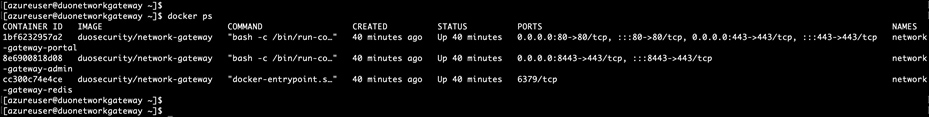
Step 2. Login to the DNG instance. Duo Network Gateway is pre-installed on this VM as part of initial terraform infrastructure provisioning. Follow the Duo documentation for more details.
ssh -i azure.pem azureuser@$(terraform output DuoNetworkGatewayHostIP)
docker ps
Note: Save this YAML file in a persistent directory location for future use; it will be required for later use when deploying, updating, or interacting with your Duo Network Gateway server.
Step 3. Go back a client machine and navigate to https://portal.safecloudnativeapp.net:8443 to log into the Duo Network Gateway admin console. The first page of the Duo Network Gateway setup screen will ask you to choose a password for the Duo Network Gateway admin console. Once you've entered a password, click Save and Continue. On the Make Duo Network Gateway visible to the internet page fill in the following fields.
● Admin Email – Email address for the admin user (admin@safecloudnativeapp.net)
● Hostname - FQDN created for Duo Network Gateway in step 2 (portal.safecloudnativeapp.net)
● Certificate and Private Key - Complete certificate chain and private key created for Duo Network Gateway (CN=portal.safecloudnativeapp.net). The format should be Base64-encoded X.509 (pem, cer, or crt)
Click Save and Continue after filling in all the details.
Step 4. Now, we will configure the AD FS service to be used as Duo Network Gateway Authentication Source.
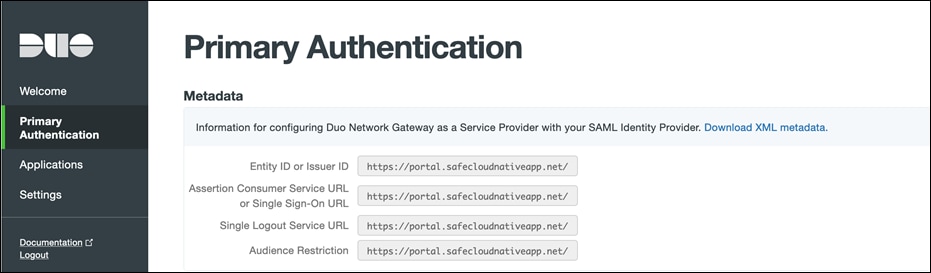
● On the Duo Network Gateway admin console home page click the Authentication Source link under Step 2. Under the Metadata section click on Download XML metadata. We will need this XML file later in the setup.
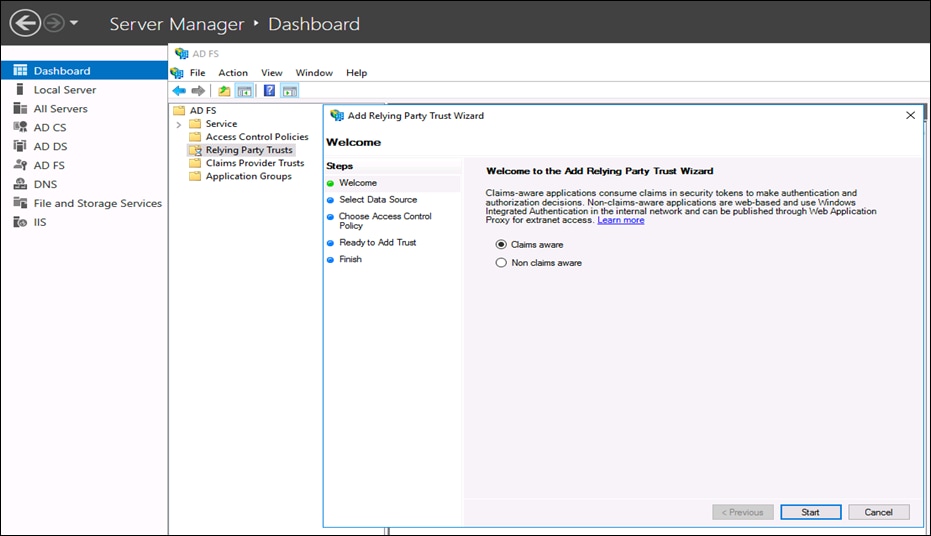
● Switch to the ADFS server(Needs to be installed manually, not part of terraform modules) and launch the ADFS management console. In the ADFS Management window, right-click Relying Party Trust to add a relying party trust. On the Welcome page of the wizard, leave the Claims aware option selected and click on Start.
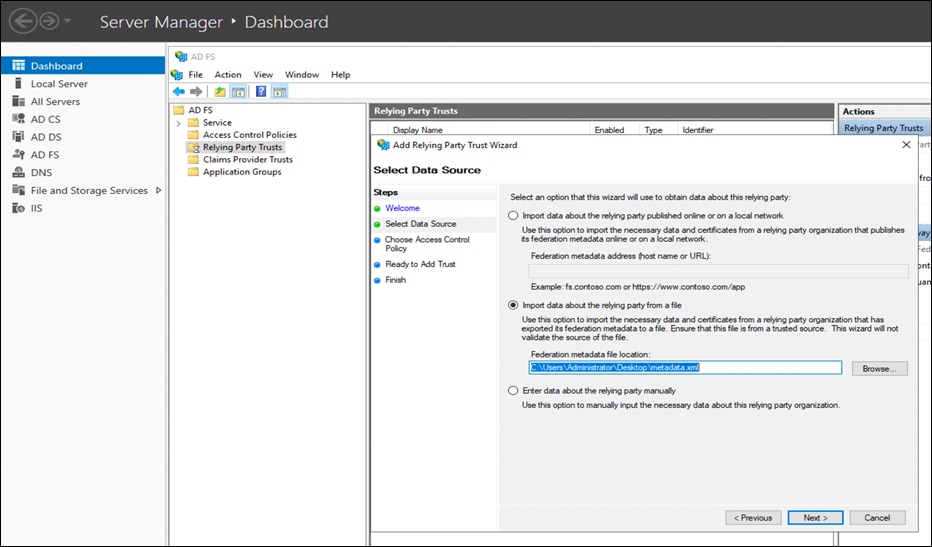
● In Select Data Source step, choose Import data about the relying party from a file. Browse the Metadata file downloaded in at the beginning of the step 6 and click Next.
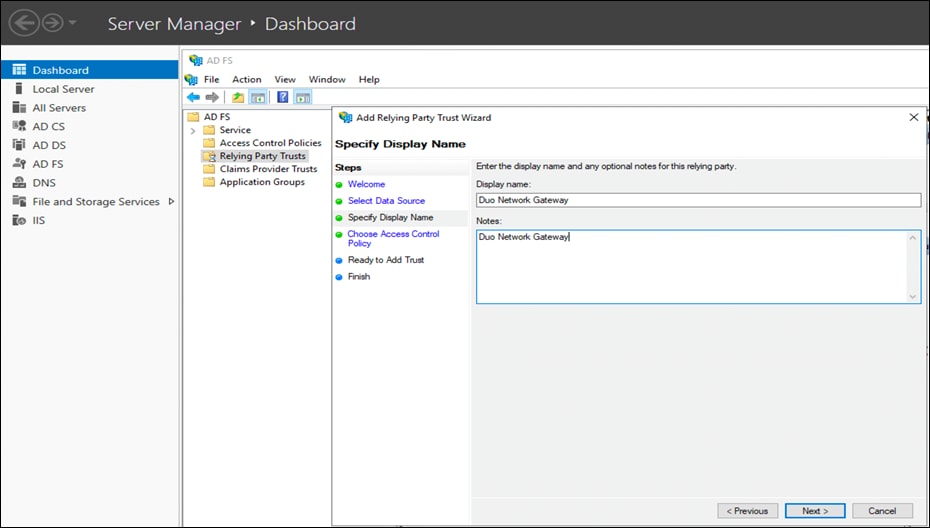
● Add a meaningful Display name and Notes for Duo Network Gateway and click on Next.
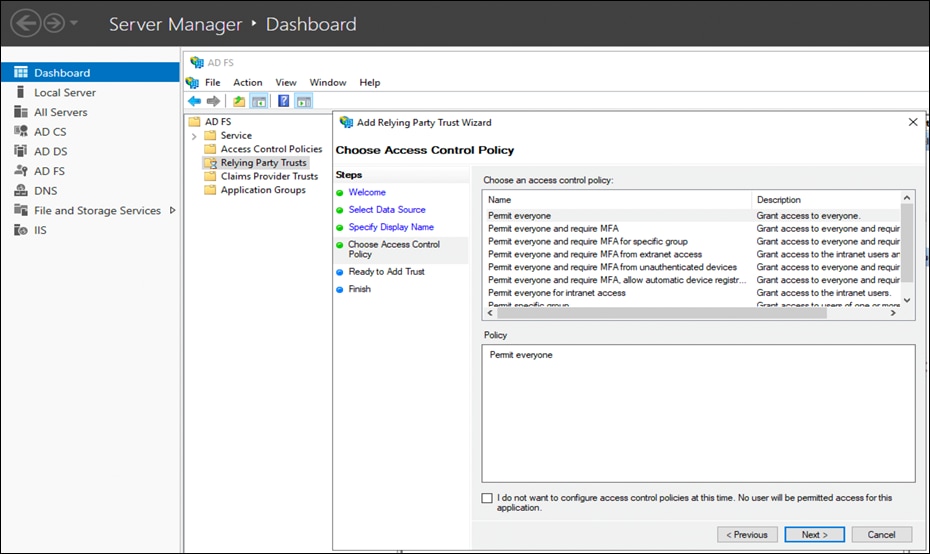
● Select Permit Everyone policy on the Choose Access Control Policy page and click Next.
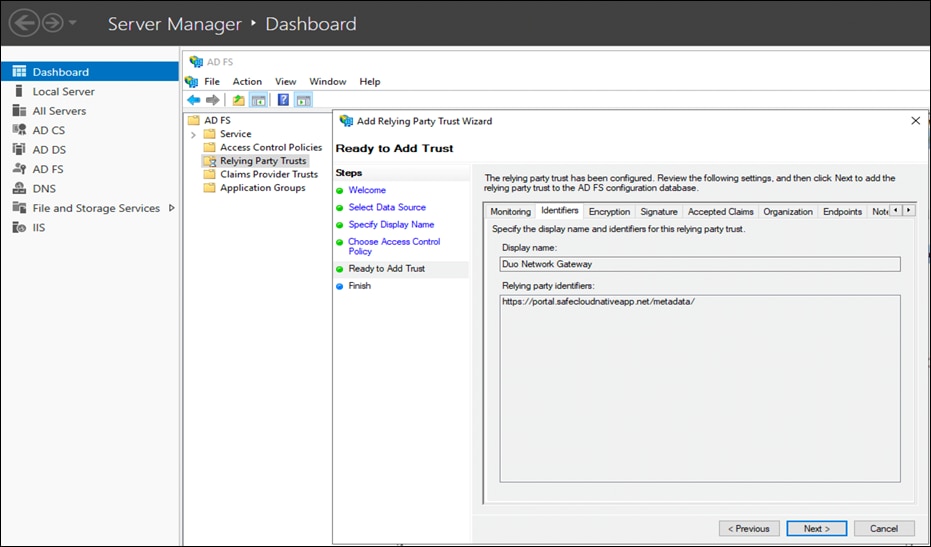
● On the Ready to Add Trust step, simply click Next.
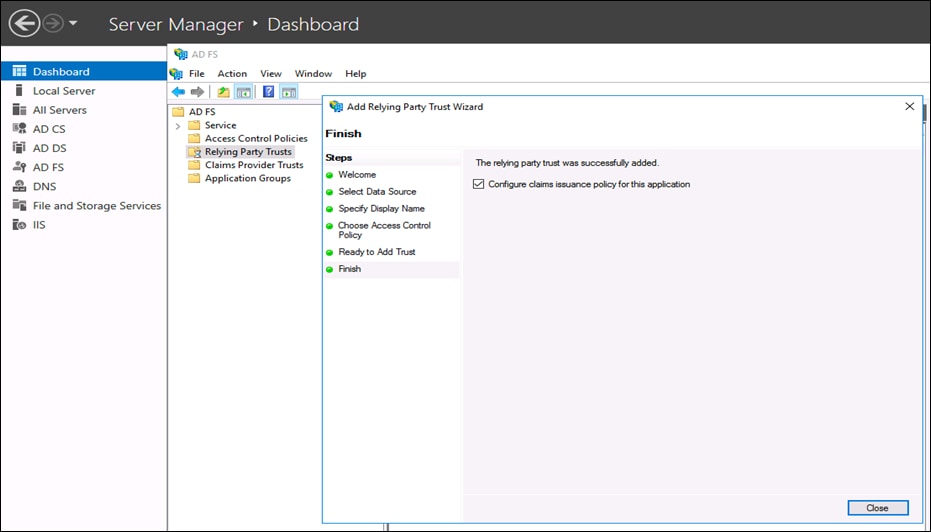
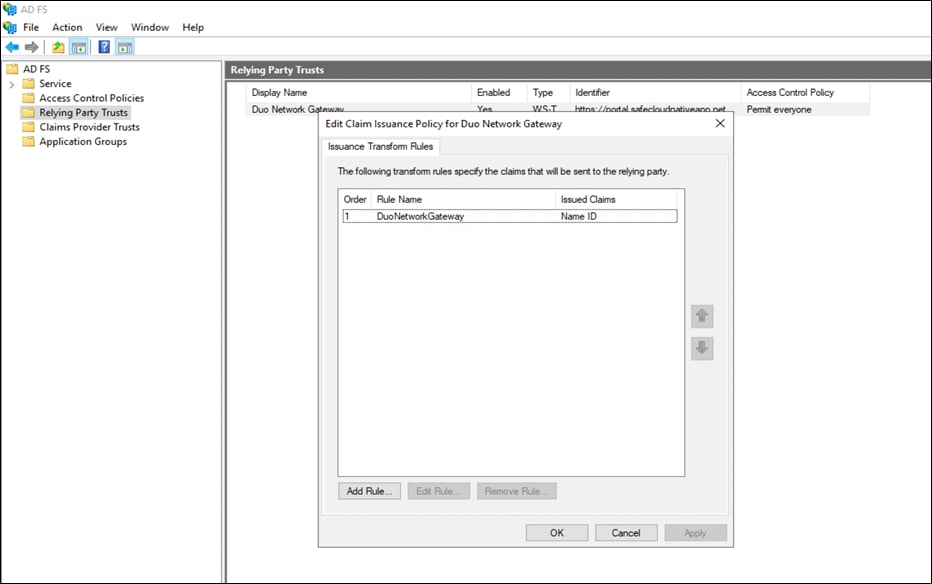
● Once the configuration is done, click on Close. A Claim Issuance policy configuration wizard will be launched.
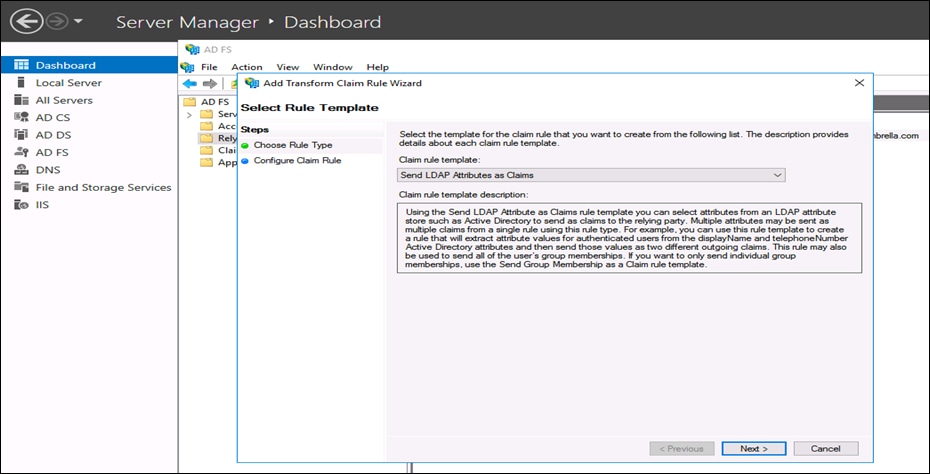
● In Choose Rule Type page on Add Transform Claim Rule wizard, select Send LDAP Attributes as Claims as the Claim rule template and click Next.
● In Configure Claim Rule, do the following and click Next:
o Enter a meaningful Claim rule name
o From the Attribute Store menu, choose Active Directory
o Map the LDAP attributes SAM-Account-Name to Outgoing Claim Type Name ID
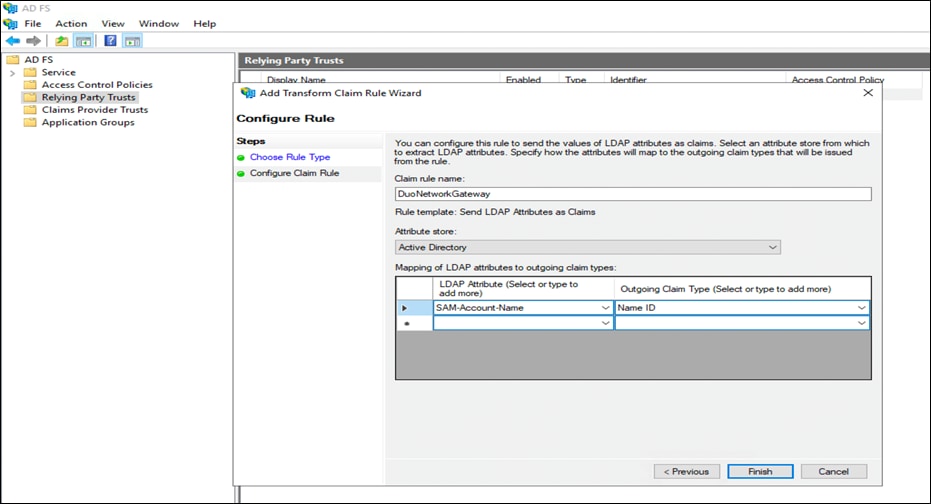
● Click on Apply to complete the configuration
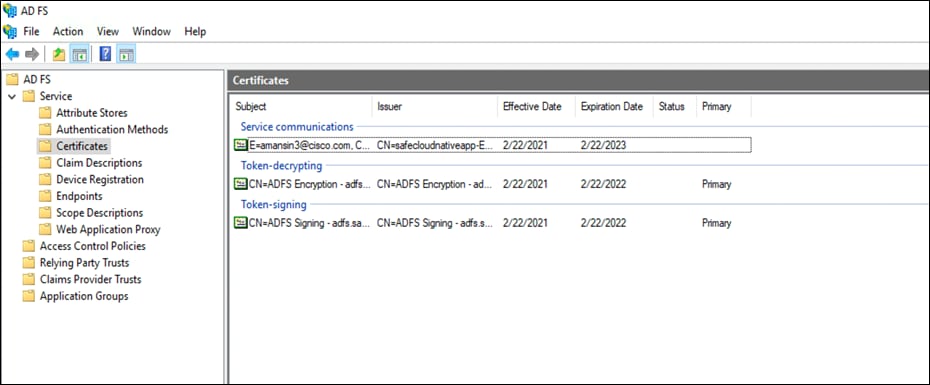
● On the AD FS Management console click the arrow icon next to Service. Under on Certificates option, right-click the certificate under Token-signing and select View Certificate. On the new Certificate window select the Details tab. Click the button Copy to File. Follow the wizard (on the Export Private Key page select No, do not export the private key) and click Next. Select Base-64 encoded X.509 (.CER) on the Export File Format page. Click Next and save this AD FS certificate to be used later
● Download ADFS metadata file by visiting the URL:
https://adfs.safecloudnativeapp.net/FederationMetadata/2007-06/FederationMetadata.xml
Step 5. Now switch back to the Duo Network Gateway admin console and follow the steps below to configure the authentication source
● On the Duo Network Gateway admin console home page click the Authentication Source link under Step 2 Scroll down to the Configure SAML Identity Provider section of the page. Copy the entityID and AssertionConsumerService value from the AD FS XML file and paste it into the Duo Network Gateway Entity ID or Issuer ID and Assertion Consumer Service URL or Single Sign-On URL fields
● Click the Choose File button next to Certificate to select the certificate file downloaded at the end of step 6. Upload the certificate. Click on Save Settings
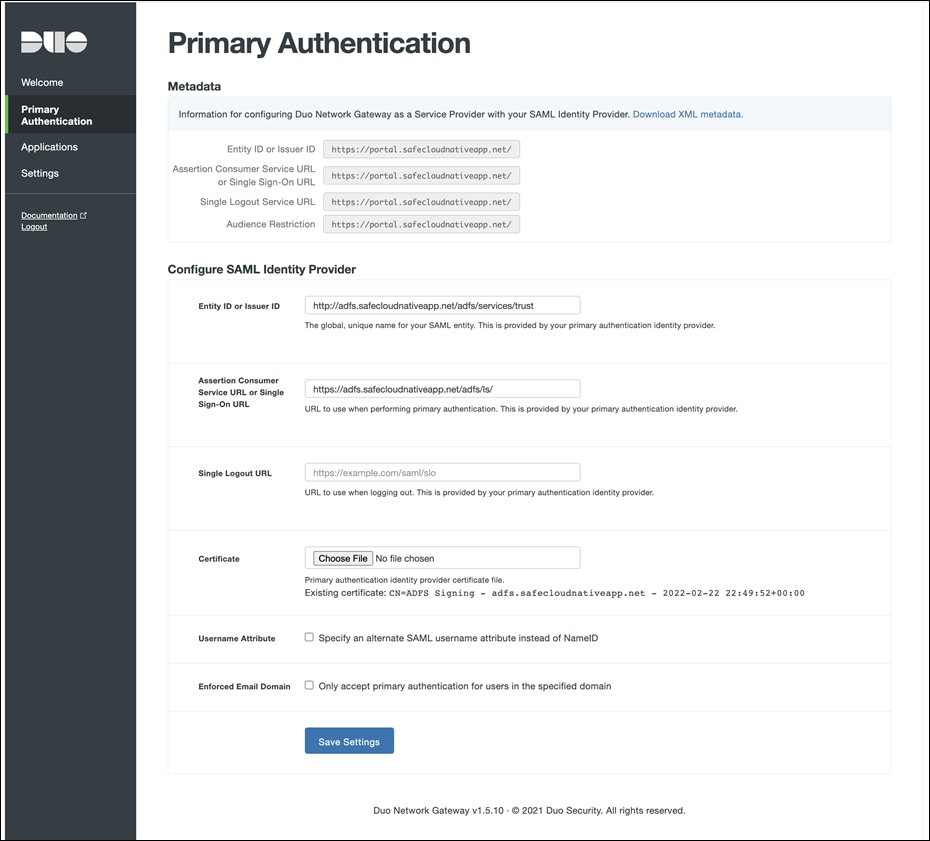
Note: Username Attribute and Enforced Email Domain is an optional setting. For more details, refer to the Duo Network Gateway Documentation
| Acronym |
Definition |
| AD FS |
Active Directory Federation Service |
| AKS |
Azure Kubernetes Service |
| API |
Application Programming Interface |
| CI/CD |
Continuous Integration/Continuous Delivery |
| CIS |
Center for Information Security |
| CNCF |
Cloud Native Computing Foundation |
| CRD |
Custom Resource Definitions |
| CVD |
Cisco Validated Design |
| DNG |
Duo Network Gateway |
| FQDN |
Fully Qualified Domain Name |
| IOC |
Indicators of Compromise |
| LB |
Load Balancer |
| MFA |
Multi-Factor Authentication |
| PHP |
Hypertext Preprocessor |
| PIN |
Places in Network |
| SaaS |
Software as a Service |
| SCM |
Source Code Management |
| SIEM |
Security Information and Event Management |
| SQL |
Structured Query Language |
| SSO |
Single Sign On |
| SWC |
Stealthwatch Cloud |
| VPC |
Virtual Private Cloud |
| WAF |
Web Application Firewall |
| XSS |
Cross Site Scripting |
| 2FA |
Two Factor Authentication |
This section lists all the references.
● Cisco Secure Cloud Analytics
● Nginx
● GitLab
If you have feedback on this design guide or any of the Cisco Security design guides, please send an email to ask-security-cvd@cisco.com.