Capacity Management in Cisco HyperFlex White Paper
Available Languages
Bias-Free Language
The documentation set for this product strives to use bias-free language. For the purposes of this documentation set, bias-free is defined as language that does not imply discrimination based on age, disability, gender, racial identity, ethnic identity, sexual orientation, socioeconomic status, and intersectionality. Exceptions may be present in the documentation due to language that is hardcoded in the user interfaces of the product software, language used based on RFP documentation, or language that is used by a referenced third-party product. Learn more about how Cisco is using Inclusive Language.
When viewing capacity numbers, there can be different interpretations. This document explains the different capacity numbers in different views of the used components such as Cisco HyperFlex Connect, Cisco Intersight, VMware vCenter, and operating systems.
The document gives the reader a better understanding of why a capacity number is expected in a specific view but the latter shows a different number.
Cisco Intersight is a software-management platform delivered as a service with embedded analytics for your Cisco and third-party IT infrastructure. This platform offers an intelligent level of management that enables IT organizations to analyze, simplify, and automate their environments in more advanced ways than with prior generations of tools. Cisco Intersight provides an integrated and intuitive management experience for resources in the traditional data center and at the edge. With flexible deployment options to address complex security needs, getting started with Intersight is quick and easy. Cisco Intersight has deep integration with Cisco UCS and Cisco HyperFlex systems, allowing for remote deployment, configuration, and ongoing maintenance. The model-based deployment works for a single system in a remote location or with hundreds of systems in a data center and enables rapid, standardized configuration and deployment. It also streamlines maintaining those systems, whether working with small or large configurations.
Cisco Intersight offers flexible deployment either as software as a service (SaaS) on Intersight.com or running on your premises as Cisco Intersight Virtual Appliance. The virtual appliance provides the benefits of Cisco Intersight while allowing more flexibility for customers with additional data locality and security requirements. To learn more about Cisco Intersight features and supported systems, see the Cisco Intersight Getting Started Guide.
Cisco HyperFlex Data Platform overview
Cisco HyperFlex Data Platform (HXDP) is a hyperconverged system that transforms Cisco servers into a single pool of compute and storage resources. It eliminates network storage and enables seamless interoperability between computing and storage in virtual environments. HXDP provides a highly fault-tolerant distributed storage system that preserves data integrity and optimizes performance for virtual machine (VM) storage workloads. In addition, native compression and deduplication reduce storage space occupied by VMs and VM workloads.
Figure 1 shows the total HXDP architecture on a lower level. HyperFlex writes the data across all nodes, which is the same principle as iSCSI or the datastore.
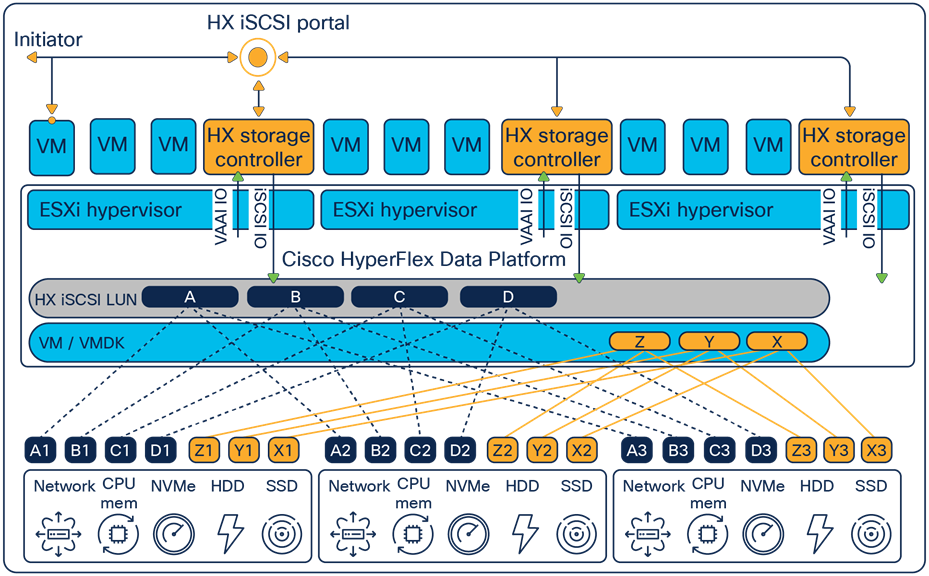
High-level overview of Cisco HyperFlex Data Platform with iSCSI.
The central idea behind a log-structured file system (LFS) is that blocks are never modified. The blocks are in sequential order when writing to a log-structured file system. After writing, there is an iNode with pointers to the blocks of the file. The system maps the files to the iNodes through a mapping matrix. When the file updates, the blocks are appended and not overwritten. This approach improves performance significantly compared to the traditional read-modify-write model. Taking snapshots and performing backups are also more cost-effective. New iNodes save the updated information on the LFS. See Figure 2.
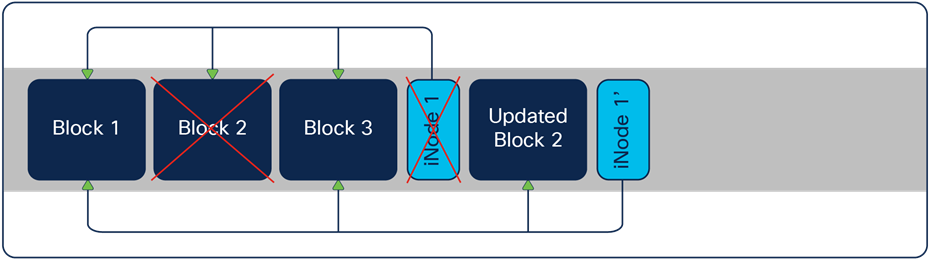
New iNodes save the updated information on the LFS
After appending the blocks, there is an unused block on the file system with the old information. When the operating system performs "garbage collection," those blocks are deleted, and the spaces are again available. Depending on the "garbage collector" or "cleaner," there can be a certain amount of time when the unused blocks consume capacity. Keep this in mind when looking at the capacity numbers.
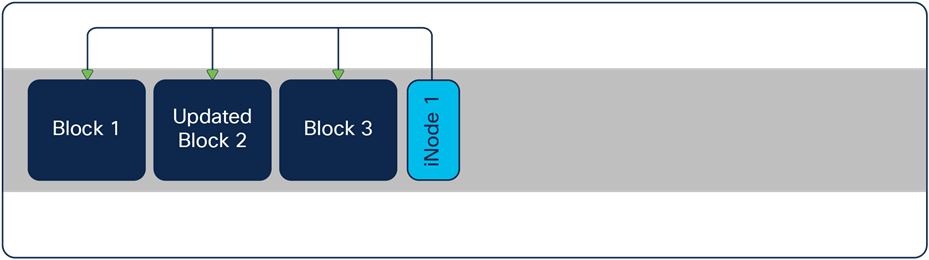
Status after garbage collection
HXDP implements a log-structured file system that uses a caching layer to accelerate write responses, and it implements a capacity layer for persistent storage. The capacity layer can consist of HDD drives (in hybrid nodes), SSD drives (in all-flash nodes), or NVMe storage (in all-NVMe nodes). Incoming data is striped across the nodes to achieve maximum performance.
During writing to the write log (WL), write operations compress the data and de-stage it to each node's capacity layer while compressing it. This process occurs after the write operation is acknowledged, so there is no performance penalty for these operations. Data is then moved to the capacity tier as cache segments become free. Read operations in hybrid nodes cache data on the SSD drives and main memory for high performance. In all-flash and NVMe nodes, they read directly from storage. Having the most frequently used data stored in the caching layer helps Cisco HyperFlex systems perform well for virtualized applications. The data platform decouples the caching tier from the capacity tier and allows independent scaling of I/O performance and storage capacity.
For the garbage collection of the file system, HyperFlex has a process called "cleaner."
This process runs in two different priorities:
● Normal priority: The cleaner generates minimum I/O.
● High priority: The cleaner increases the I/O.
If the storage cluster reaches an ENOSPC WARN (not-enough-space warning) condition, the cleaner increases its intensity by increasing the number of I/O to garbage collection. The cleaner automatically runs at the highest priority with an ENOSPC (not enough space) set condition.
Since HXDP Release 4.0(2c), the cleaner process has changed, and manually scheduling the cleaner process is not possible anymore. It is always running in the background, and the process sets the priority automatically.
A replication factor (RF) is the number of copies the HyperFlex system writes of the storage block. There are two options: an RF of 2 or 3. The default setting during installation of the HyperFlex system is 3. All the blocks are written with an algorithm to have none of the blocks written on the same node or the same disk. This eliminates the single point of failure. The best-practice recommendation is to always set RF to 3 for production environments.
Capacity Definitions used in this document
Raw – This is the actual total physical capacity available for use. Per node, this equates to multiplying the number of capacity drives by the drive's capacity.
Usable – This is the total available capacity after deducting RF and metadata overhead from the raw capacity. Typically, the metadata requirement equates to 7 percent of capacity or 0.93 as a multiplier.
Effective – This is essentially the Usable determining storage multiplied by the storage optimization gain of compression and deduplication.
Storage Optimization Gain – Example: If the anticipated gain from compression was 30 percent, that equates to 0.3 (30/100), and if the anticipated gain from deduplication was 10 percent, that equates to 0.1 (10/100).To calculate the overall gain, we use the following calculation:
(1-compression gain) *(1-deduplication gain) = (1-0.3) * (1- 0.1) = 0.63
Storage Operating Threshold – This is the safe contingency or overhead storage capacity needed to ensure the system runs optimally during normal operating conditions. The threshold is a fixed number of 70 storage utilization or 0.7 as a multiplier.
The overall calculation to determine the effective storage per HX node is, therefore:
![]()
Before this document explains which capacity, numbers are at various places, this document explains the difference between TB and TiB.
TiB (tebibyte) vs. TB (terabyte)
Humans like to work with a decimal numeric system. A kilo = 1000 and a mega = 1.000.000. This is why a kilobyte (KB) = 1000 bytes and a megabyte (MB) = 1.000.000 bytes.
Digital devices work with bits, which are zeroes and ones. This is the binary numeric system, and digital devices calculate with it. 1000 bytes is a strange value, and for digital devices, it is easier to use 1024 bytes as a kibibyte (KiB) because 2^10 = 1024.
One source of confusion is that when the drive vendors say 1 TB, what are they meaning? Is it 1,000,000,000,000 bytes or 1,099,511,627,776 bytes?
When converting TB to TiB, there is about a 10-percent difference between the size of a tebibyte and a terabyte. This is significant when talking about storage capacity. Storage subsystems are looking for 1 TiB, meaning one tebibyte equals 2^40, or 1,099,511,627,776 bytes, and a tebibyte equals nearly 1.1 TB.
The capacity values are shown differently in each of these operating systems.Figure 4 shows a screenshot of the Windows OS where the capacity values are labeled as GB though the actual value is in GiBs (gibibytes)
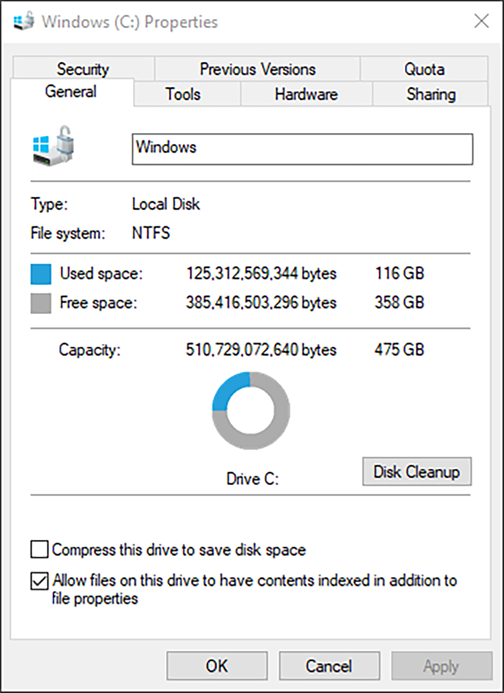
Windows drive properties
In Ubuntu, the values are labeled as GiB, as shown in Figure 5.

Drive capacity in Ubuntu
Cisco Intersight capacity views
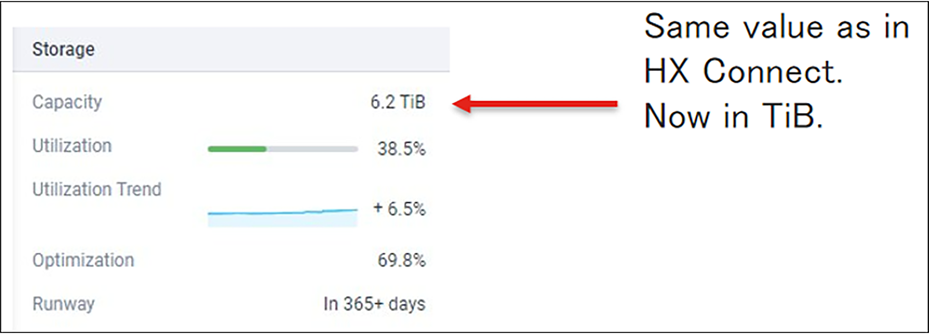
Cisco Intersight can monitor, configure, manage, and do lifecycle management for HyperFlex clusters. In the HyperFlex overview of Intersight, there are the capacity values of the HyperFlex cluster. Those values are in TiB. (Base-2 system)
HyperFlex overview in Intersight
The capacity utilization in this view is with deduplication and compression + garbage + metadata.
The values shown are the same as displayed in the HyperFlex Connect dashboard view but labeled in TiB.
Cisco Intersight HyperFlex datastore view
The datastore information is not gathered directly from HXDP itself. The HyperFlex cluster consists of HX Nodes with ESXi running on it, and VMware vCenter manages the ESXi cluster. ESXi nodes connect to the HyperFlex datastore through NFS Share. For VMware ESXi, those NFS Shares are always thin-provisioned. The ESXi host collects information about the NFS Share, including the total capacity and capacity used, and vCenter collects this information from all the ESXi hosts. HyperFlex reads the vCenter information and displays it in the datastore view. This is to have a consistent number throughout the whole system. ESXi host does not collect the NFS information in real time. There are some “lazy updates” that can delay displaying the numbers. Those used capacity numbers are with compression and deduplication but without garbage and metadata.
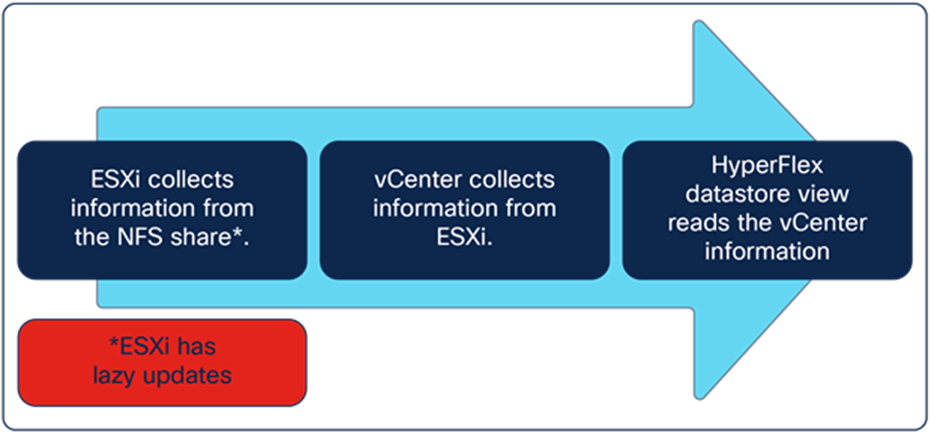
Flow of how HyperFlex gets the numbers of the datastore capacity
Figures 8,9 and 10 show different screenshots of the HyperFlex datastore views in different locations of Cisco Intersight.
The total capacity of the datastores is the sum of the provisioned capacity of all the datastores. The total used capacity is the sum al all the capacity utilization of the datastores.
In this view, the value of "Total Capacity Used" and capacity utilization is with deduplication and compression without (garbage + metadata)
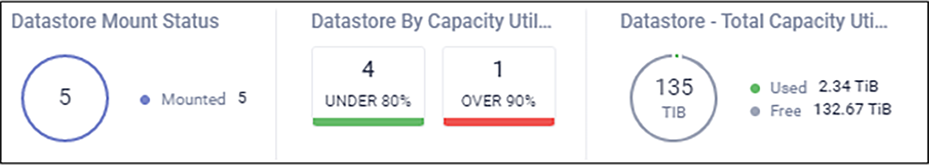
HyperFlex Datastore view in Intersight
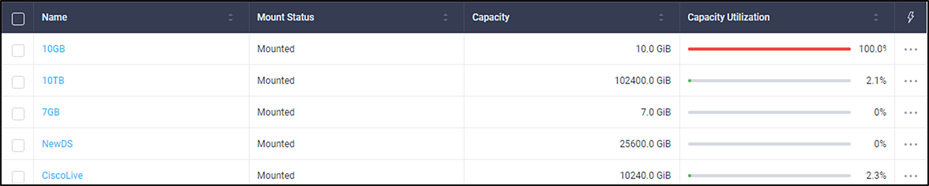
List of datastores in Intersight
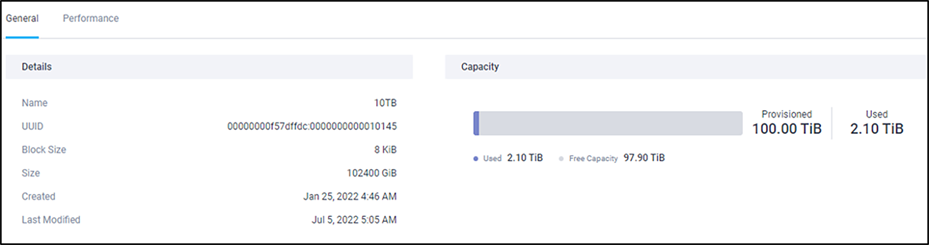
Detailed information of the datastore in Intersight
At the HyperFlex datastore view in Intersight, the values are still in TiB, and the numbers are the same as in HX Connect.
HyperFlex Connect capacity views
The HX Connect user interface provides a view of the HX storage cluster status, components, and features such as iSCSI, encryption, and replication. In the HX Connect UI, there are multiple storage views, with summaries of the space utilization in the HX cluster. The concept of capacity applies here to both datastores and storage clusters.
HyperFlex Connect dashboard view
The HX Connect dashboard page displays a status summary of your HX storage cluster. This is the first page you see when you log in to Cisco HyperFlex Connect. The display units are labeled as TB, but measured in TiB. Figure 11 provides a view of the HX Connect dashboard.
HyperFlex Connect dashboard view
The Capacity section in the HX Connect dashboard page displays a breakdown of the total storage versus how much storage is used or free. It also displays the storage optimization, compression savings, and deduplication percentages based on the data stored in the cluster. Capacity, used space, and storage optimization are defined as:
Capacity (total usable space) – The capacity value displayed in the view in Figure 11 isn't the raw physical capacity. The capacity section in the HX Connect dashboard page provides the overall usable space that is available after all the deductibles, which includes unit conversions overhead (9 percent), metadata overhead (8 percent), and resiliency (space consumed for data protection depends on the replication factor that is set). This is (raw – (conversion overhead) – (RF overhead) – (metadata overhead))
Used – This is the total actual physical space used after deduplication and compression. An essential factor to be noted is that this counter includes additional metadata and "garbage" data cleanups in a delayed fashion. The capacity counter is updated in a delayed fashion as the data gets flushed from the write log to the persistent tier. To better understand how this delayed fashion works, additional details about the write log, persistent tier, and how the data is flushed are explained in later sections of this guide.
The capacity "used" is with deduplication and compression + garbage + metadata
Storage optimization – This includes overall space efficiency, which is calculated as (1 – (1-%dedupe savings) * (1 –%Compression savings)).
HyperFlex Connect datastore view
In the datastore view, the datastore's size is the datastore's provisioned size. This can be oversubscribed.
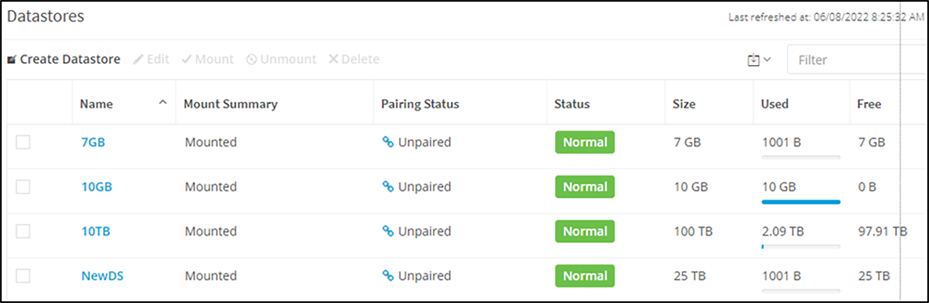
List of datastores in HyperFlex Connect
● Size – This is the logical size of the datastore.
● Used – This is the actual physical space used after applying inline compression and deduplication. The capacity counter is updated in a delayed fashion as the data gets flushed from the write log to the persistent tier.
Capacity used: with deduplication and compression without (garbage + metadata)
Note: NFS Shares in VMware are always thin provisioned. The provisioned size of a datastore can be larger than the actual storage size.
HX Connect virtual machine view
HX Connect does get the virtual machine information from vCenter, and the values are the same as in vCenter.
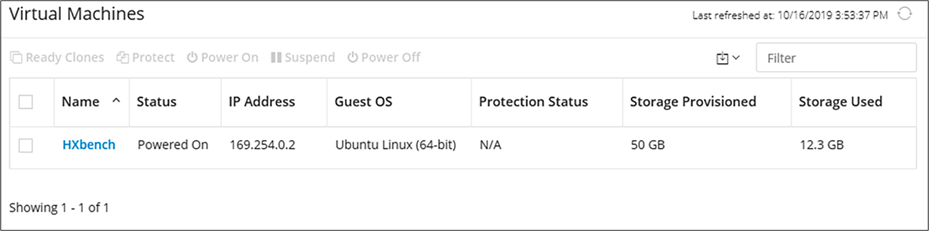
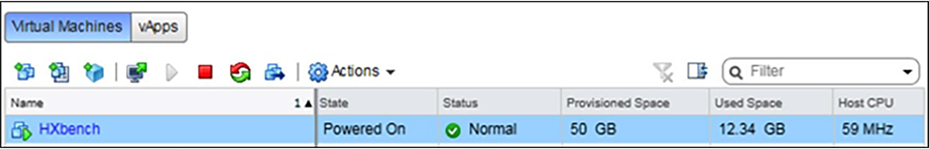
Virtual Machine information in HyperFlex Connect.
The "Storage Provisioned" and "Storage Used" columns show the capacity values collected from the VMware vCenter. More detailed information is provided under the "vCenter capacity views" section.
Capacity used: without (deduplication, decompression, garbage, and metadata) This is because HyperFlex gathers the values from the vCenter.
Note: In the case of a VM being thick-provisioned, the storage used would be displayed as the same amount as the storage provisioned. In the image above, the "Storage Used" is 50 GB if the VM is thick provisioned, irrespective of the actual capacity used.
vCenter manages the ESXi hosts, which have a datastore from HyperFlex. On those datastores, virtual machines (VMs) consume capacity. Each VM can be thick or thin provisioned.
Thick- vs. thin-provisioned VMs
When a virtual machine is thin provisioned, it uses only space containing actual data. VM-used capacity starts small and can grow over time.
To verify if a VM is thin provisioned, expand the hard disk property of the VM setting.
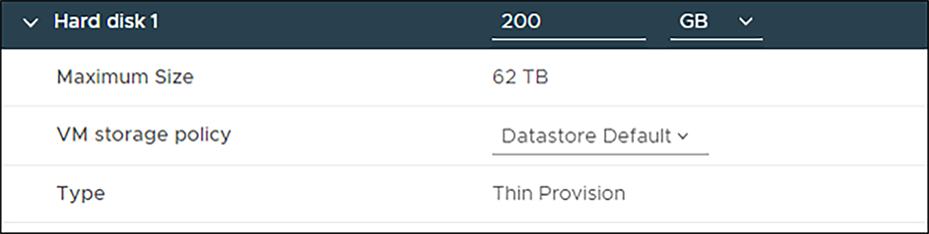
VM Disk properties showing a thin providioned disk.
In the overview of the VM, the capacity allocated and the used space have different values.
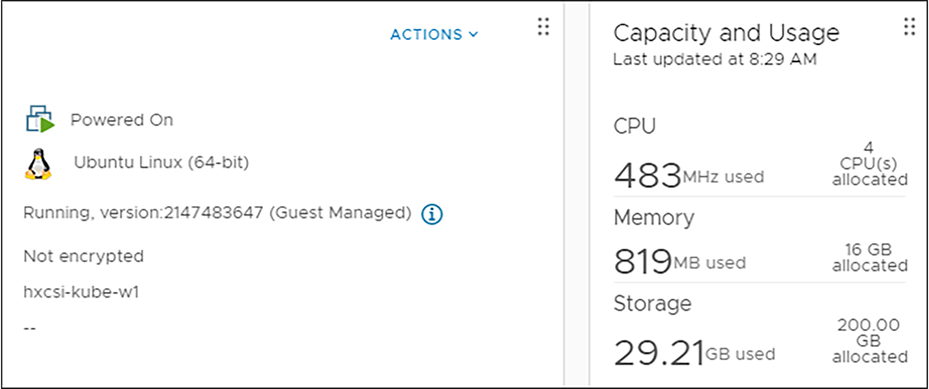
vCenter VM information with a thin provisioned disk.
In this example, the allocated space is 200GB, and only 29.21GB is used.
Thick-provisioned VMs fill the whole space with zeros to make sure they can use the whole allocated space. VMware “thinks” it is using the total capacity, but due to deduplication and compression of the HyperFlex cluster, not much storage is used. VMware does not have any notice of this.
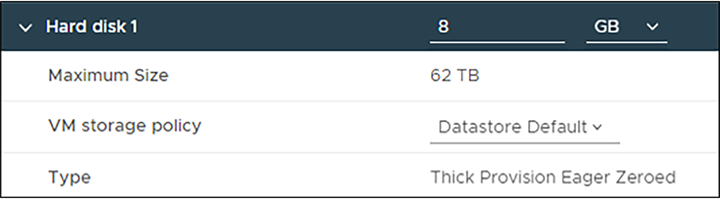
VM properties showing a thick provisioned drive.
In the VM overview example, there is 8GB capacity allocated, and 8GB is used in the eyes of vCenter.
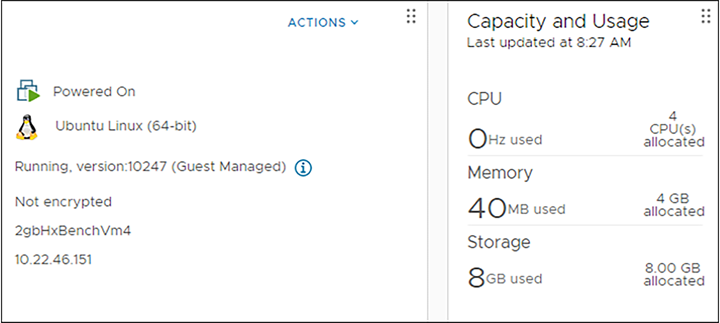
vCenter VM information with a thick provisioned disk.
In the virtual machine list view, all the VMs are there with the provisioned and used space.
vCenter view of a VM with capacity information.
● Provisioned space – This is the logical size of the virtual machine.
● Used space – The used space capacity value depends on whether the virtual machine is configured as "thin provisioned" or "thick provisioned." If the virtual machine is thick provisioned, the used space is the same as provisioned space. In contrast, if the virtual machine is thin provisioned, the used space is the actual data written from the vCenter's perspective.
Capacity used: without (deduplication, compression, garbage, and metadata)
vCenter gets the datastore information from the ESXi hosts, looking at the NFS Shares to HyperFlex. The capacity numbers update is not in real time; therefore, delays in the capacity numbers can show different numbers than expected.
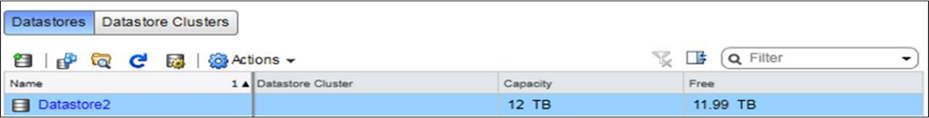
vCenter datastore overview.
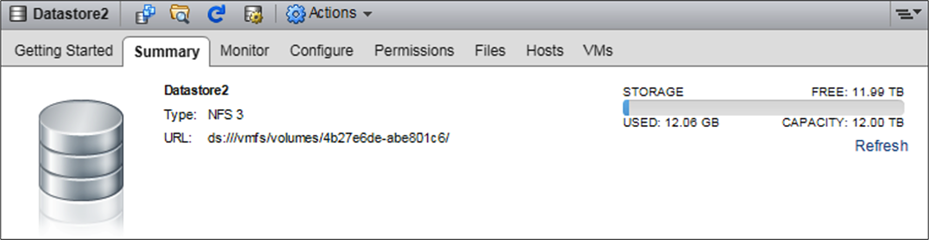
vCenter datastore details.
● Capacity – This is the logical size of the datastore, which is, by default, thin provisioned.
● Used – This is the actual physical space after inline deduplication and compression.
● Free – This is the difference between the capacity (thin-provisioned capacity) and the used space of the datastore.
Since HXDP Release 4.5, the HyperFlex cluster can be configured as an iSCSI target. Initiators can connect to the HyperFlex clusters and put data on the configured LUNs.
In the HyperFlex iSCSI overview tab, you see the number of LUNs created on the HyperFlex cluster.
The "Capacity Used" in this view is the total used space of all the iSCSI LUNs.

HyperFlex Connect iSCSI overview.
Each LUN has a “Size,” the logical size the hyperconverged administrator gave for the LUN. The “Used” column shows the physical space used or written on the HyperFlex cluster for that LUN, including deduplication and compression.
The “Available” column shows the difference between the provisioned size and the used capacity of the iSCSI LUN.
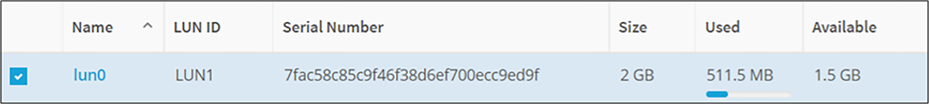
HyperFlex Connect LUN capacity information.
HyperFlex Kubernetes datastore view
On a Kubernetes cluster, the HyperFlex Container Storage Interface can be installed. With this interface, persistent volumes can be created for the workers on the HyperFlex cluster.
In the HyperFlex Kubernetes view, you see how many persistent volumes are created. This is shown as the number of “Datastore(s)”. The “Provisioned Size” column shows the total of all data physically written on the HyperFlex cluster by the HX-CSI plug-in.

HyperFlex Connect Kubernetes datastores totals.
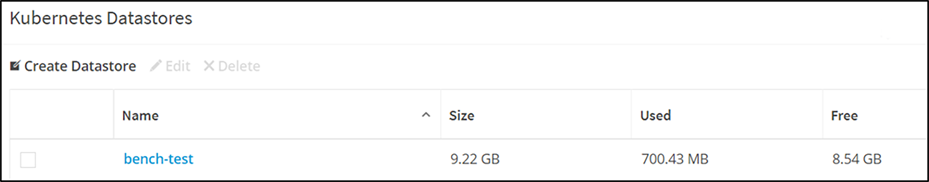
HyperFlex Connect Kubernetes datastores overview.
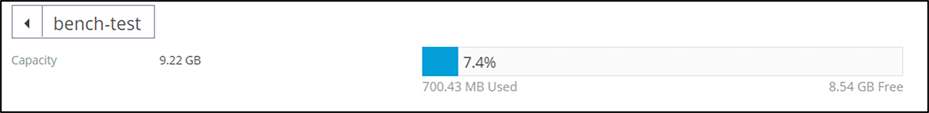
HyperFlex Connect detailed information of a Kubernetes datastore.
Size – This is the logical size of the Kubernetes datastore.
Used – This is the actual physical space used by the Kubernetes datastore.
Free – This is the difference between the provisioned size and the used space of the Kubernetes datastore.
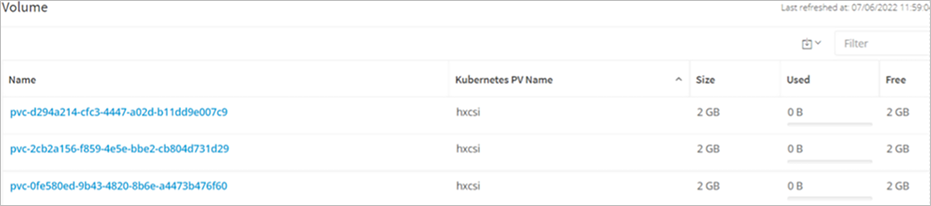
HyperFlex Connect PVC information.
Size – This is the logical size of the Kubernetes volume.
Used – This is the actual physical space used by the Kubernetes volume.
There is a Cisco HyperFlex Best Practices White Paper: Cisco HyperFlex Best Practices White Paper - Cisco, and in this document is a summary of the best practices regarding capacity.
Weekly guest-level cleanup by setting up a CRON job is a best practice to free unused capacity. Why? When a virtual machine deletes files on the virtual disk, HyperFlex does not know if the virtual disk is filled with zeros or data. Due to this situation, there is never a call coming to HX to mention that the deleted space is freed up. So, from the HX standpoint, the usage still shows the same value as before, but from the application standpoint, the used space is "0." This is a very well known problem in the virtualization space. Fortunately, there is a solution to overcome this issue.
As HX is doing inline deduplication and compression, in the file system, you can use the dd command with dev/zero to just write zeros and create a huge file. It forces the New Technology File System (NTFS) to use the free blocks and write zeros (basically allocating the free space that only the file system knows about and using this space to write zeros). When an application writes zeroes, it uses those free blocks and sends those writes to HX. Because all of them are zeroes, the practical used space does not change, but the actual physical space changes (the cluster's used space after deduplication and compression savings) because there will no longer be any savings because the actual physical space is now all zeroes; the space becomes 100 percent free. The result is that it has the effect of deleting space on your system.
HyperFlex does not have a mechanism for reclaiming space within a thinly provisioned VM that has been freed. Thin provisioning allows for the on-demand growth of a virtual disk, allowing more efficient use of space from the storage system than thick provisioning. When files on a thinly provisioned virtual drive are deleted, the disk size is not automatically reduced. The operating system only deletes the indexes from the file system table, and this results in the appearance of the quick deletion of files but no reclamation of space. Reclaiming disk space only works when the blocks on your virtual disk are empty. Deleting data usually removes the entries from the file allocation table but does not zero out the blocks. As a result, ESX thinks the blocks are in use.
Reclaim space within a Windows VM on a HyperFlex cluster
The following resource provides options for reclaiming space on thin-provisioned virtual drives. Use the tools outlined in this section to zero data blocks to clean up space. Before performing any operation that zeros out blocks, ensure that you create backup files. Also, ensure there are no existing snapshots on the virtual machine in which you perform the steps below. It includes SENTINAL snapshots. Removal of the SENTINAL snapshot stuns the VM for a prolonged period.
Reclaiming space on thin-provisioned disks on Windows VMs
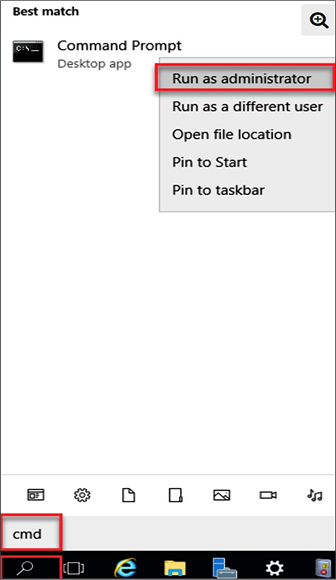
Sdelete, a free utility from Microsoft's Sysinternals Suite, is used for reclaiming space. Download link: https://docs.microsoft.com/en-us/sysinternals/downloads/sdelete
1. Download the file to the target VM.
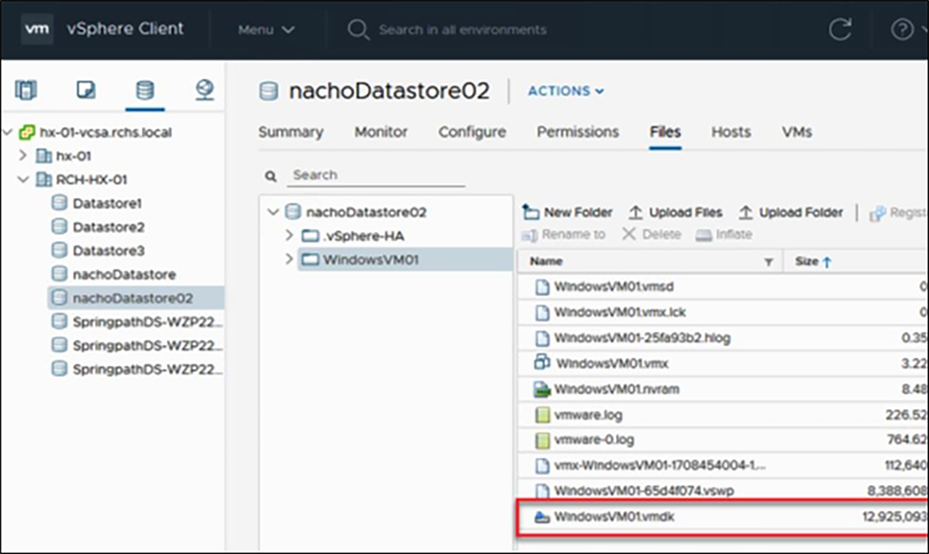
View of the size of the VMDK file before running sdelete.
Once you have downloaded SDelete to the target VM, unzip the file.
Run the sdelete command on the VM.
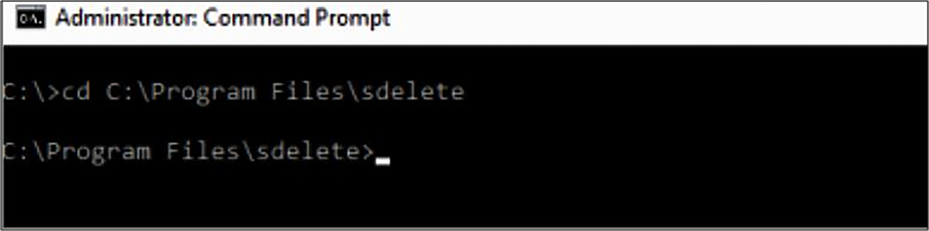
Navigate to the directory where you uncompressed the SDelete file.
Run the following command:
| sdelete -z <drive letter> |
Select "Agree."
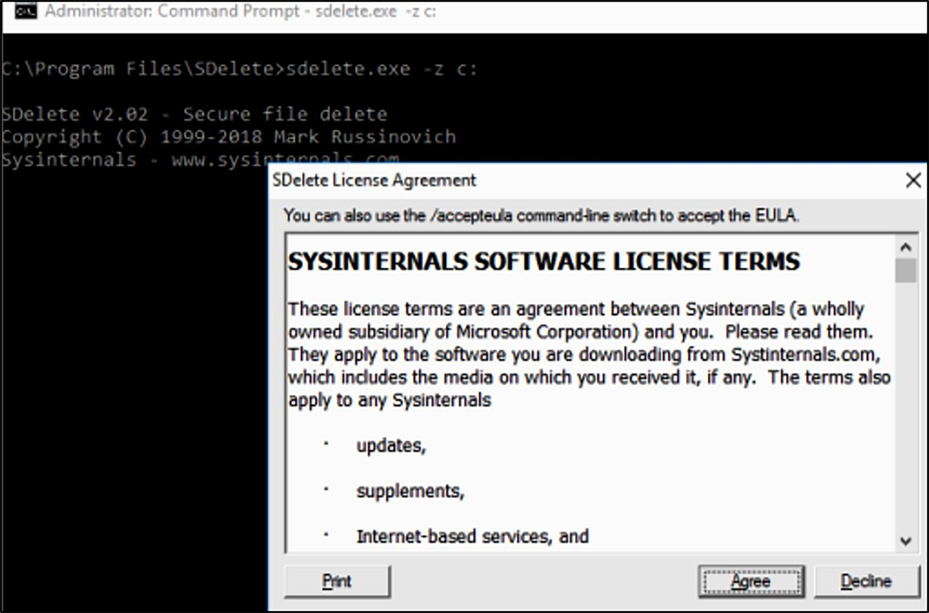
Accept the software license term.
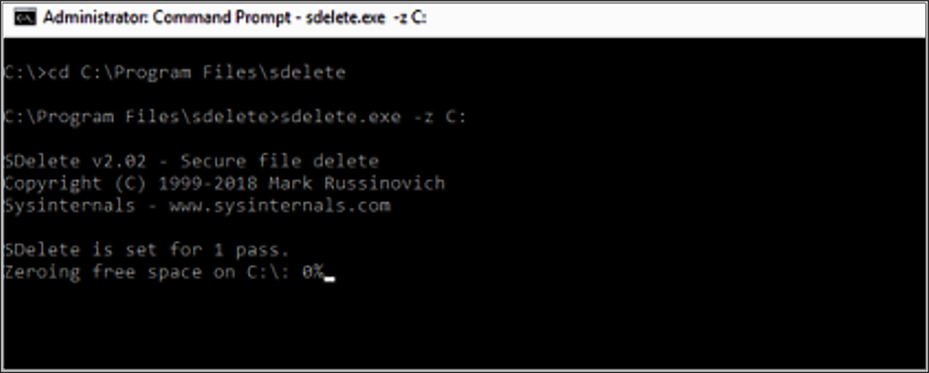
Run the sdelete command
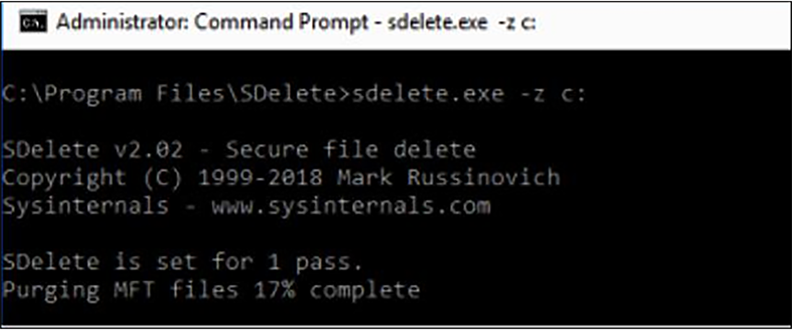
The progress of the sdelete command is shown.
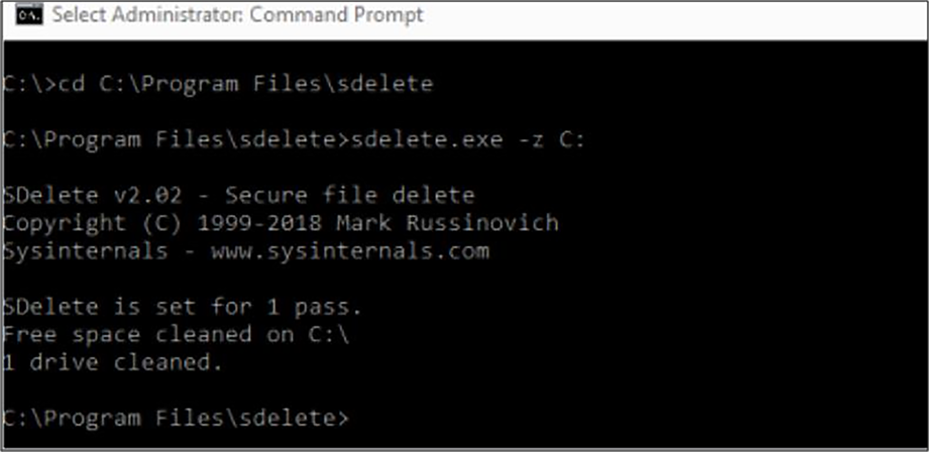
View after sdelete is completed.
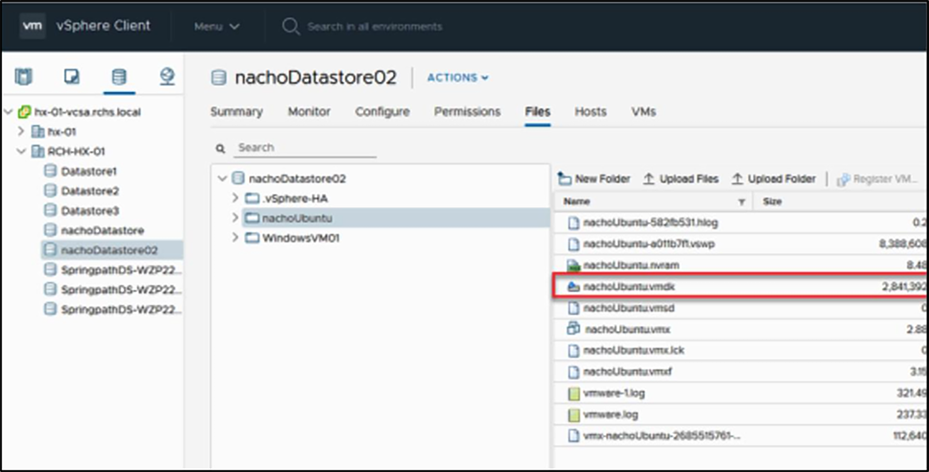
The VM VMDK size after the SDelete operation is circled below:
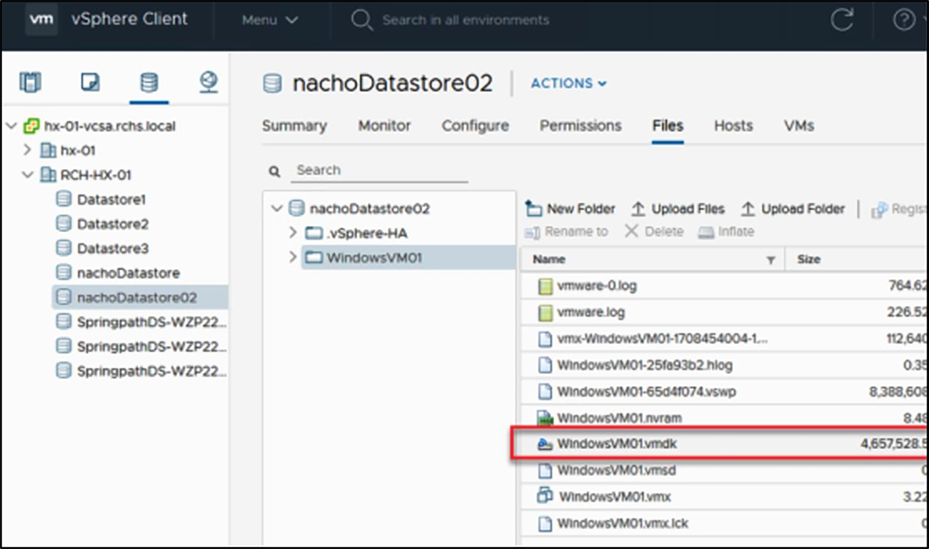
The size of the VMDK after sdelete.
Reclaim space within a Linux VM on a HyperFlex cluster
You can use the dd utility to zero out the areas where the deleted data resides.
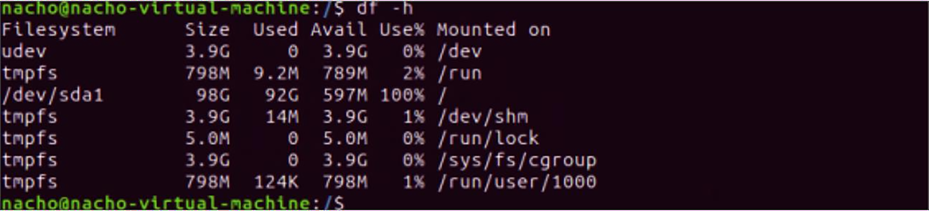
Use df -h to check the free space on the Linux OS.
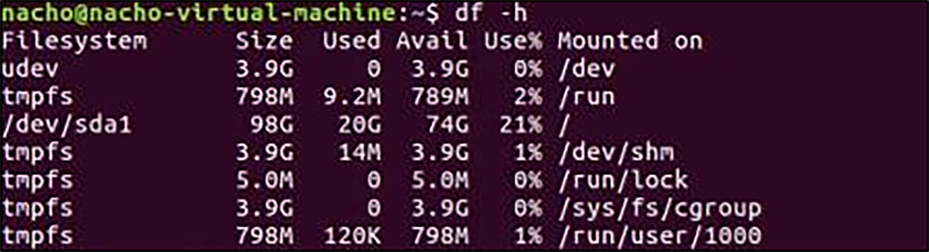
Disks usage on the Ubuntu VM.
Use the following command to zero out the space:
| dd bs=1M count=90112 if=/dev/zero of=zeroa |
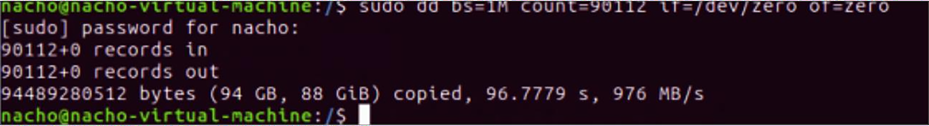
View after the completion of the command.
The new disk size after the dd command.
We are zeroing out 90 GB of space in the previous command above. After this completes, the VMDK file grows.
The size of the VMDK in vCenter is circled below:
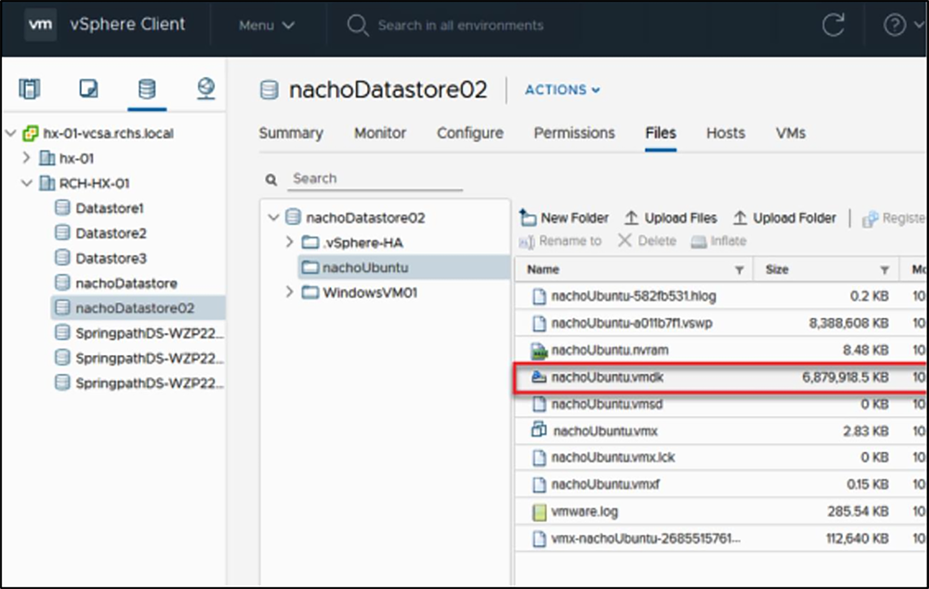
VMDK used size in vCenter.
To reclaim the space, enter the following command:
| /$ sudo rm zero [sudo] password for user: <---Enter password for user |
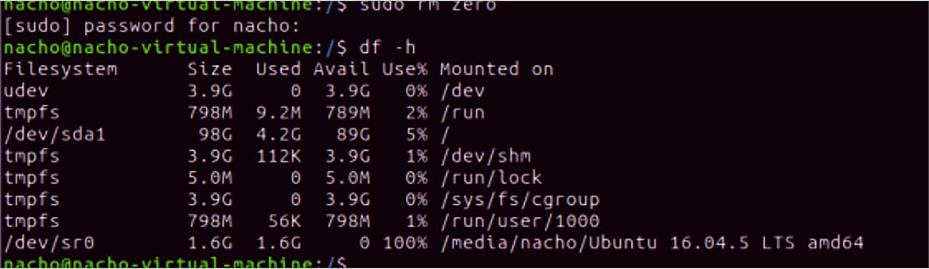
Reclaim space on Linux VM.
The VM VMDK size in vCenter after deletion of the zero files is circled below:
View at vCenter after removing the zero space of the Linux VM.
Capacity utilization threshold
The best practice for used storage cluster capacity is not to exceed 76 percent at the HX Connect capacity view. Beyond 76 percent, usage at the HX Connect capacity view results in:
● Performance degradation
● Poor resiliency status. Resiliency status is the ability of the storage clusters to tolerate node failures within the storage cluster, and it describes how well the storage cluster can handle disruptions.
HyperFlex Connect dashboard view.
If you experience any drive/node failures (cluster resiliency degrades), maintaining the 76-percent capacity utilization helps the cluster resiliency return to a normal state by recreating the copies (stored on the failed drive) onto the other drives. It can only do this refill/recreation if free space is left in the cluster. Maintaining capacity utilization at 76 percent provides better performance, availability, rebalancing benefits, and future headroom for growth.
Note: The automatic healing time for any drive failure is one minute, and the wait time for any node failure is two hours. It is a fixed setting, and it cannot be changed.
Cluster resiliency views at different cluster-space utilizations
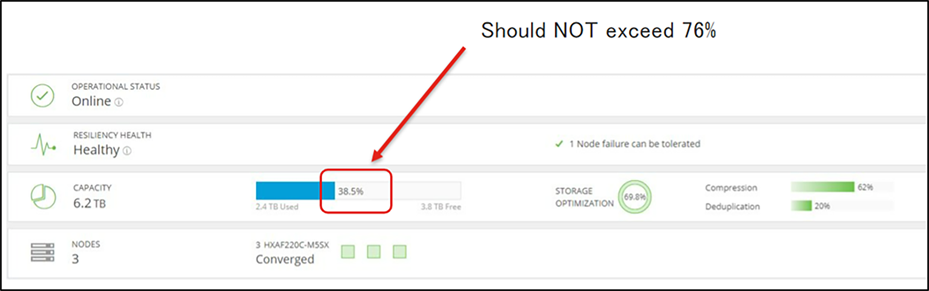
Normal space usage
If the cluster space utilization is less than 76 percent at the HX Connect capacity view, then the storage cluster space usage is expected.
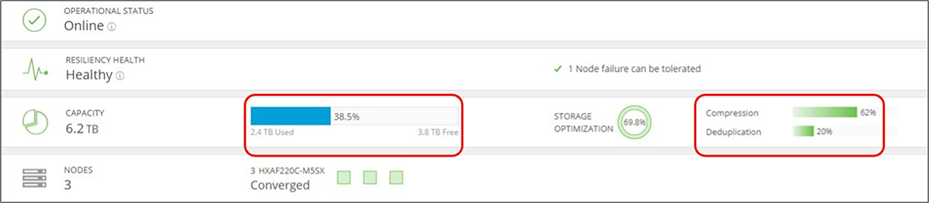
Here are screenshots of the Capacity view with a normal healthy status below 76 percent of used capacity.
HyperFlex Connect Dashboard view.
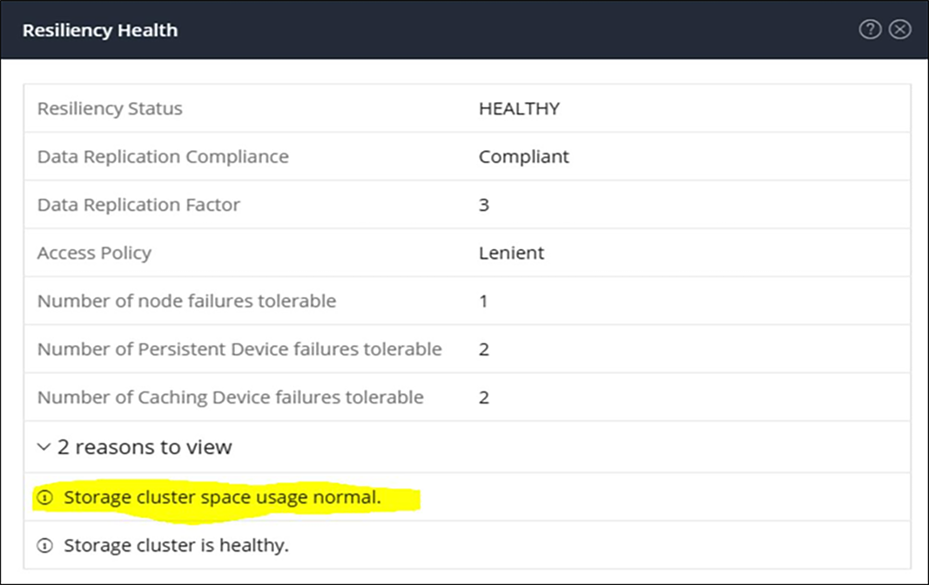
HyperFlex Connect Operational Resiliency Health details.
Warning state
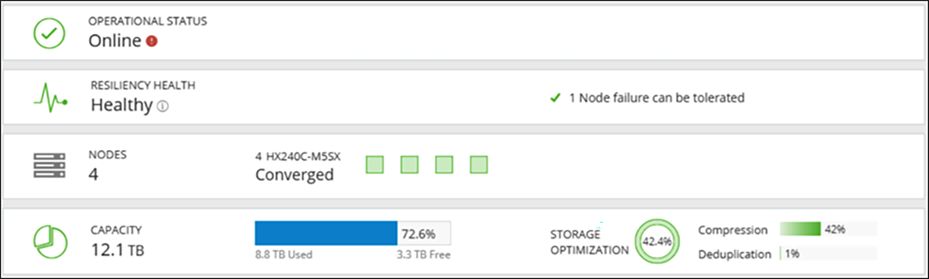
If the cluster space utilization is above 76 percent at the HX Connect capacity view, then the storage cluster capacity utilization is above the warning threshold. The screen capture below shows what you can expect to see when the resiliency health status is at 80 percent in the HX Connect capacity view.
Capacity view of the resiliency normal health status at 80 percent in HX Connect:
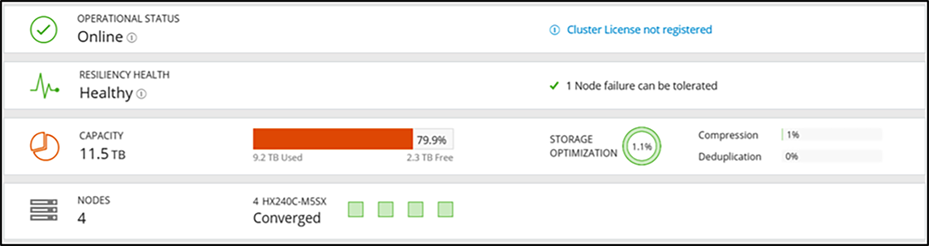
HyperFlex cluster is over 76 percent capacity used.
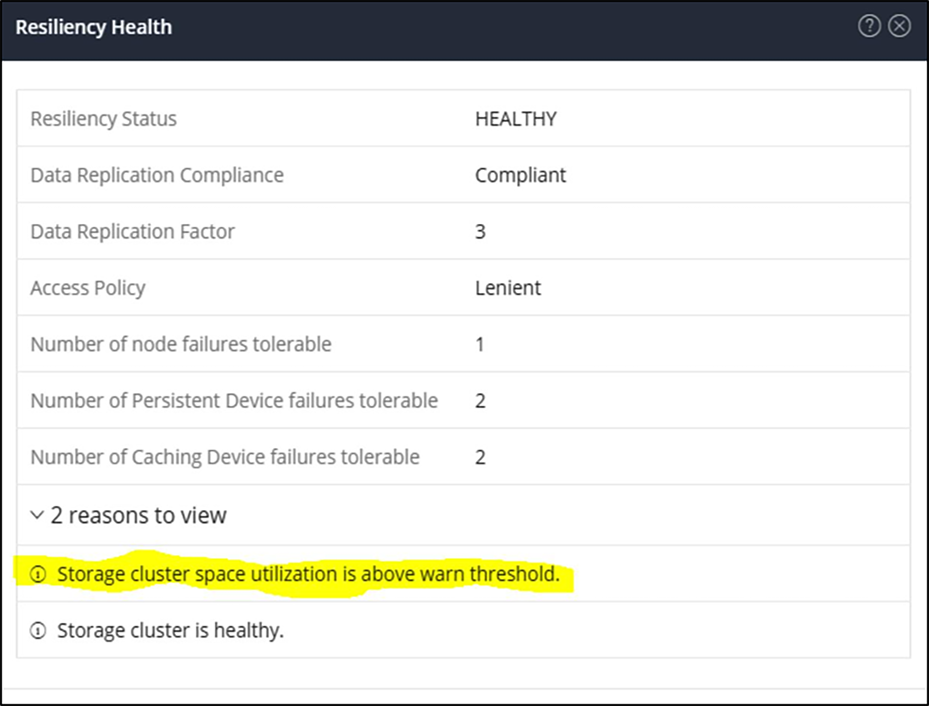
HyperFlex Connect Resiliency Health when over 76 percent capacity is used.
HX Connect Alarms view when storage capacity is above the warning state (higher than 76 percent):
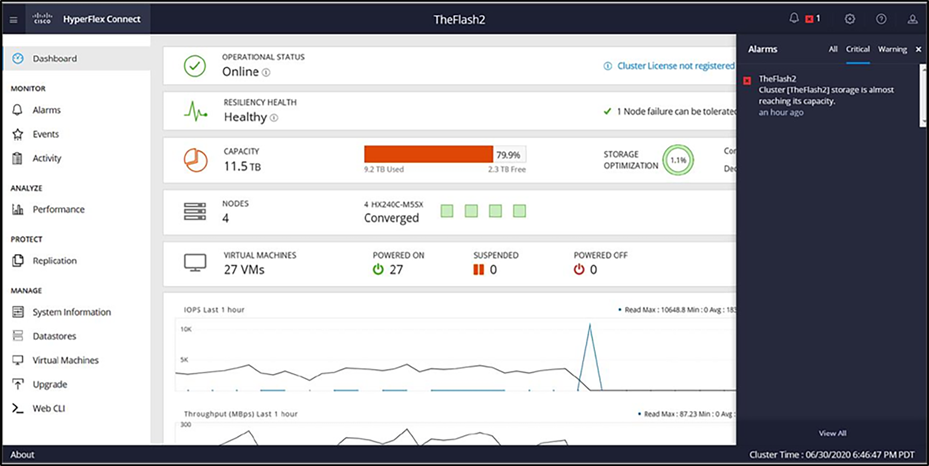
HyperFlex Connect Alarms.
Intersight Alarms view when storage capacity is above the warning state (higher than 76 percent):
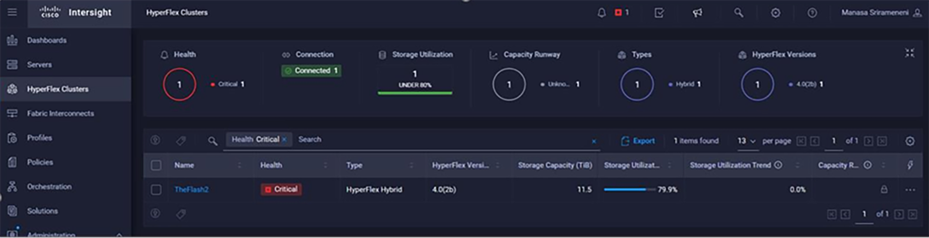
Intersight Alarms when HyperFlex cluster exceeds 76 percent capacity used.
Intersight Alarm of the HyperFlex cluster.
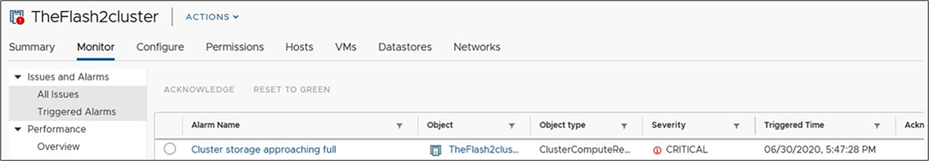
vCenter Alarms view when storage capacity is above the warning state (higher than 76 percent):
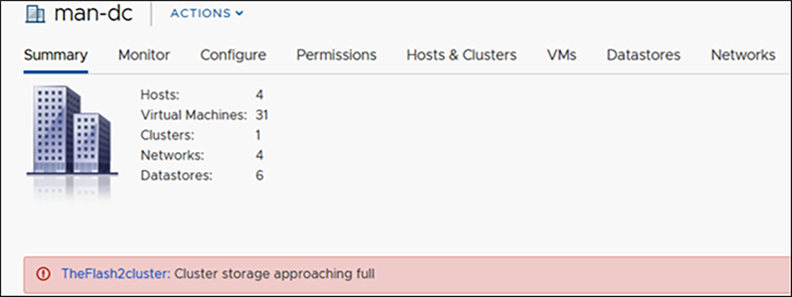
vCenter alarms when HyperFlex cluster exceeds 76 percent capacity used.
vCenter datastore view with severity of critical.
Read-only state
A cluster above 99 percent of capacity usage reverts to a read-only operational state. In this state, the cluster doesn't accept further writes until you free up some space. Being in this phase leads to poor resiliency. If there are disk or node failures, there is no additional space to recreate the copies on other nodes.
Capacity view of the resiliency health status at 99 percent or greater in HX Connect:
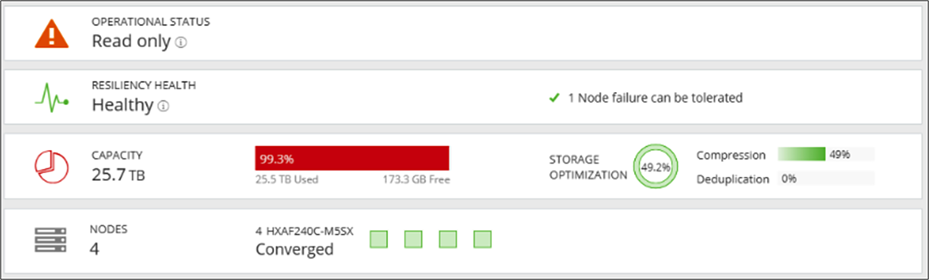
HyperFlex cluster is almost 100 percent capacity used.
Intersight Alarms view when a cluster is in a "read-only state" (higher than 99 percent capacity):
Intersigth Alarms when HyperFlex cluster goes into “read-only state”.
vCenter Alarms view when a cluster is in a "read-only state" (higher than 99 percent capacity):
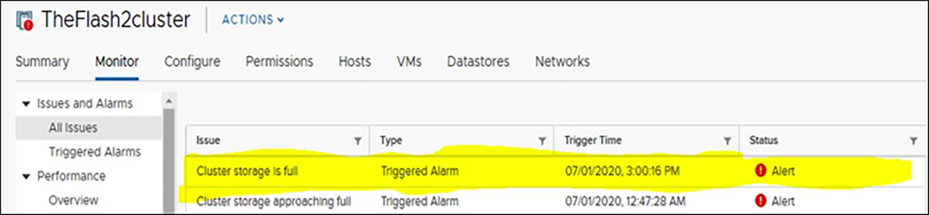
vCenter alarm during a HyperFlex “read-only state"
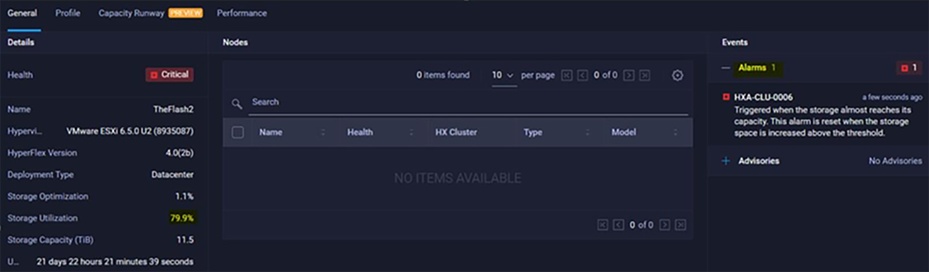
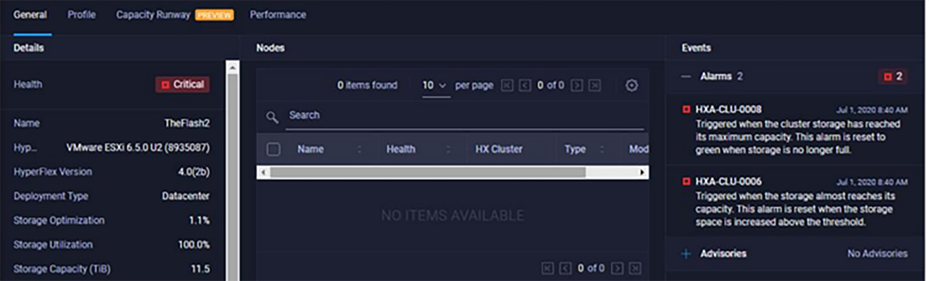
HX Connect System overview view when a cluster is in a "read-only state" (higher than 99 percent capacity):
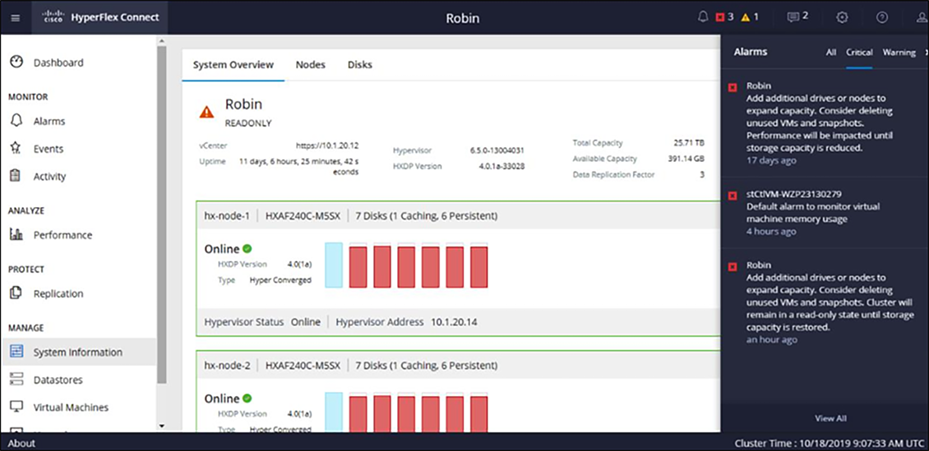
HyperFlex Connect view when it is in a “read-only state”.
At 92 percent of a cluster's space usage, the cluster returns to an operational state. The operational status changes from read-only mode to online, but the resiliency status is still in a warning state, as shown below.
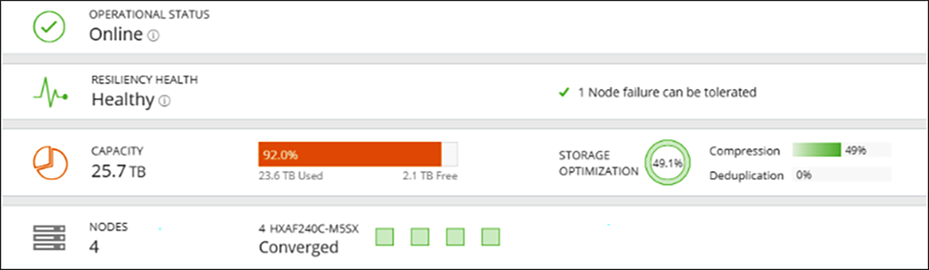
HyperFlex Connect dashboard view when a cluster returns to an operational state but is still in a warning state.
Capacity accounting for snapshots
Within a VMware vSphere environment, a virtual machine snapshot preserves the state and data of a virtual machine at a specific point in time. The Cisco HyperFlex Data Platform (HXDP) supports three different snapshot types. It's important to understand that all supported HXDP snapshot types are virtual machine–centric in that snapshots are created at a virtual machine level of granularity. Several general use cases dictate what type of snapshots are used at a high level.
Snapshot types
The three types of snapshots supported by HXDP are VMware snapshots, HyperFlex-native snapshots, and HyperFlex Data Protection snapshots.
VMware snapshot
This refers to a generic VMware snapshot documented in VMware knowledge-base article 1015180. This snapshot type depends on VMware vSphere and is not specific to the Cisco HyperFlex product.
HyperFlex-native snapshot
This refers to a VAAI offloaded snapshot implemented within the Cisco HyperFlex Data Platform. From an end-user perspective, HyperFlex-native snapshots appear similar to VMware snapshots. HyperFlex-native snapshots can be managed from the vSphere client "Snapshots" tab. The Cisco HyperFlex vSphere client plug-in facilitates the ability to schedule snapshot creation and create on-demand ad-hoc HyperFlex-native snapshots within the vSphere client user interface. HyperFlex-native snapshots typically incur reduced virtual-machine stunning at snapshot creation and deletion times compared to VMware snapshots.
There are two different implementations of HyperFlex-native snapshots. The original VAAI offloading implementation involves automatically creating a HyperFlex "Sentinel" snapshot. The purpose of the HyperFlex Sentinel snapshot is to automatically invoke a workflow that creates a HyperFlex-native snapshot when a snapshot-create action occurs. The original implementation of VAAI offloading is supported with HXDP versions before Release 4.5(2a). An enhanced VAAI offloading implementation is supported, beginning with HXDP Release 4.5(2a) when used in conjunction with vSphere versions 7.0 U2 and higher. This implementation uses the virtual-machine advanced setting configuration parameter "snapshot. Always Allow Native." When the parameter is set to a value equal to "TRUE," it automatically invokes a workflow that creates a HyperFlex-native snapshot when a snapshot-create action occurs. A HyperFlex Sentinel snapshot is no longer used (or required) to invoke the automatic creation of HyperFlex-native snapshots.
Use cases:
The VMware snapshot and HyperFlex-native snapshot types may be used for various purposes. One everyday use case is a temporary snapshot from which to perform a backup. Third-party backup applications supporting VMware vSphere Storage APIs – Data Protection (VADP) can create a VMware snapshot that can be used to perform a virtual machine backup. After the backup process, the application deletes the snapshot. Similarly, third-party backup applications integrated with Cisco HyperFlex can use HyperFlex APIs to create, manage, and delete HyperFlex-native snapshots to perform a backup. Capacity accounting for snapshots used in this way should be relatively simple, as the lifespan of a given virtual machine snapshot is limited to the duration of the backup process for the virtual machine.
Another potential use of these snapshot types includes the manual ad-hoc creation of a point-in-time snapshot before performing a host-operating system update or applying application updates. In the event of an update failure, the updated virtual machine can be reverted to a known good point in time. Snapshots used for this purpose are deleted when the update process has been completed successfully, and there is no need to retain the snapshot any longer. Capacity accounting for snapshots used in this way should be simple in that the snapshot is not retained for an extended period. This stated capacity accounting can become skewed when ad-hoc created snapshots are not manually deleted post facto.
Additionally, HyperFlex-native snapshots can be scheduled to be created on an hourly, daily, and weekly cadence. Each category of a scheduled snapshot (hourly, daily, and weekly) includes a retention parameter that dictates the number of retained snapshots. Capacity accounting for this use case involves a calculated number of retained HyperFlex-native snapshots and the anticipated data change rate over the period during which the snapshots are retained.
HyperFlex data protection snapshot
This type of snapshot is used in conjunction with the asynchronous replication of virtual machine data. HyperFlex data protection snapshots are not linked to vSphere and cannot be managed or scheduled using the vSphere client. HyperFlex data protection snapshots incorporate the use of differencing-based technology to increase the efficiency of asynchronous replication. When possible, the first or initial data protection snapshot of a virtual machine equals the total size of the virtual machine, and subsequent data protection snapshots consist of only new and changed blocks.
Use cases:
Asynchronous replication can be used for disaster recovery and the planned migration of virtual machines. There are two supported replication topologies, 1:1 and Many:1. The first topology (1:1) may be referred to as Native Replication and Disaster Recovery (NRDR) and is administered through the HyperFlex Connect user interfaces on two HyperFlex clusters that have been "paired." The second topology (Many:1) may be referred to as N:1 Disaster Recovery (N:1 DR) and is administered utilizing the Cisco Intersight user interface.
Capacity accounting differs based on the number of retained-data-protection snapshots. When the 1:1 asynchronous replication topology is deployed, only the most recent data-protection snapshot is retained at both the source and destination HyperFlex cluster. This stated the prior data protection snapshot is not deleted until the most recent data protection snapshot has been completely replicated. Capacity accounting should include two data protection snapshots for each protected virtual machine at both the source and destination HyperFlex cluster.
When the N:1 asynchronous replication topology is deployed, the user configures data-protection snapshot retention parameters for the HyperFlex source clusters and the backup target HyperFlex cluster. These parameters are stored within a backup configuration policy. A unique backup configuration policy can be applied to each source HyperFlex cluster, or a common backup configuration policy can be applied to a collection of HyperFlex source clusters. Capacity accounting should include the number of retained-data-protection snapshots on the HyperFlex backup target cluster and the number of retained-data-protection snapshots on each HyperFlex source cluster.
It is always possible to have hardware that is failing. What is the behavior of the HyperFlex cluster when this happens?
In this section, three different failure modes are explained.
Case 1: Node failure
The behavior of a Cisco HyperFlex cluster during a node failure depends on three factors:
● The overall HyperFlex cluster's size (number of nodes) during healthy operation
● The configured replication factor (RF) for the cluster
● The number of (additional) nodes that have failed simultaneously
There is a noticeable impact on the cluster due to a latency spike for workloads when node failure occurs. The surviving nodes may be impacted as the VMs from the failed node are restarted. Capacity utilization, in general, rises by 1/n per node once the rebuild completes (n=total number of original nodes). After a particular time, depending on the available storage resources, the cluster starts rebalancing the RF2/RF3 protection. The time for a node failure to heal itself is a fixed parameter of two hours. If the nodes return online within this time, the cluster starts updating the storage layer, depending on the number of updates written to the other copies of the data.
A storage cluster healing timeout is the length of time the HyperFlex Connect or the Cisco HyperFlex Data Platform (HXDP) plug-in waits before automatically healing the storage cluster. If a disk fails, the healing timeout is one minute; if a node fails, the healing timeout is two hours.
When the cluster resiliency status is "Warning," the HXDP system supports the storage cluster failures and responses for RF3 outlined in the bullet list below. Optionally, click the associated Cluster Status/Operational Status or Resiliency Status/Resiliency Health in HyperFlex Connect or the HXDP plug-in to display messages that explain what is contributing to the current state.
Three-node cluster with one simultaneous failure – The storage cluster does not automatically heal. However, a Cisco Technical Assistance Center (TAC) procedure can replace the failed node to restore storage-cluster health.
A cluster of four or more nodes with one simultaneous failure – If the node does not recover in two hours, the storage cluster starts healing by rebalancing data on the remaining nodes. To recover the failed node immediately and fully restore the storage cluster, check that the node is powered on and restart it if possible. You might need to replace the node.
Various impacts during a node failure:
● Potential impacts on the VM (including all components) located on the failing node – Depending on the cluster configuration's VMware settings of high availability and DRS, the running VMs on the failing node need to be, or are, automatically restarted on another node. In a typical production environment, the cluster has an N+1 configuration. This means that one node has additional resources (spare) in case one fails. Data is still available since there is no data locality. Data storage VMotion is not needed. This is due to the usage of the replication factor of the data platform.
● Potential impacts on the VM (including all components) located on a different node – The VMs running on the failing node can restart on the remaining nodes; however, this depends on the requirements settings of high availability and DRS. It also depends on how many resources are available on the remaining running nodes. At the design time, it must consider how many resources are available for failover in case of failures. In a typical production environment, the cluster has an N+1 configuration, which means that one node has additional (spare) resources in case one fails.
● System stabilization – After the failing nodes are replaced or repaired, the system is rebalanced back to its original state. This means the VMs can be transferred online to the previously failing nodes without interrupting operation. In the background, the data is balanced between the nodes. The rebalancing time depends on the size of the underlying storage layer, the number of updates of the data, the CPU type, and memory size.
Case 2: Cache disk failure
After a cache drive fails, the cluster remains highly available. The VMs keep on running since the HyperFlex storage controller VM is still running and gets the data from and to the Cisco HyperFlex Data Platform in conjunction with the other nodes and the residing HyperFlex storage controller VMs on those nodes. Data is always accessible.
Various impacts during a cache disk failure:
● Potential impacts on the VM (including all components) hosted on the node where the cache disk failed – Expect a slight impact on latency for that specific node as the aggregate read cache diminishes until the cache drive is replaced and rebalanced. There is no read cache for the all-flash and all-NVMe clusters, and there is no impact on latency. The write cache remains online since the HyperFlex storage controller VM will “talk” to the other HyperFlex storage controller VMs residing on the other nodes.
● Potential impacts on VMs (including all components) hosted on other node where the cache disk failed: No impact.
● System stabilization – The cluster rebalances the cache data after replacing the cache disk.
Case 3: Capacity disk failure
A failure of a capacity disk on a node causes the disk to go offline and be marked as blocked. Multiple disks in the same node can fail without impact to the node and cluster with the appropriate RF setting:
● A cluster of three or more nodes with one simultaneous disk failure – If the disk does not recover in one minute, the storage cluster starts healing by rebalancing data on the remaining nodes.
● A cluster of three or more nodes with two simultaneous disk failures – If the disk does not recover in one minute, the storage cluster starts healing by rebalancing data. If the system is not restored, replace the faulty disks and restore the system by rebalancing the cluster.
● A cluster of four or more nodes with two simultaneous disk failures – If the disk does not recover in one minute, the storage cluster starts healing by rebalancing data on the remaining nodes (where the disk failure didn't happen).
● A cluster of five or more nodes with two simultaneous disk failures – The system automatically triggers a rebalance to restore storage -cluster health after one minute.
Note: For disk failures, with RF3, you can lose as many disks as you want in each node, as long as you do not lose disks in three separate nodes simultaneously. So, you can lose five disks in node 1 and eight in node 2 and stay online. This assumes the nodes are still available and you are experiencing only disk losses. The cluster quickly heals so that you can continue sustaining losses indefinitely (if free cluster space remains)
Various impacts during capacity drive failure:
● Potential impacts on the VM (including all components) hosted on the node where the capacity disk failed – A rebalance after a disk failure can take several minutes, depending on the failed disk size and the amount of space consumed. Small additional latencies may be observable during this time.
● Potential impacts on VMs (including all components) hosted on other nodes – A slight latency increase might be measured, although, if observed, the impact is meager.
● System stabilization – After one or more disk failures, the system starts rebalancing. After the rebalance, the system is marked as healthy. After the system is healthy again, the failing disk(s) can be replaced.
Capacity usage's effect on performance
Application-level performance impact is possible when cluster capacity is 70 percent or higher (before entering a warning state). The best practice is always to be below the 70 percent capacity used on a HyperFlex cluster.
When there is a need for additional storage in a cluster, the Cisco HyperFlex Data Platform supports an expansion feature to increase storage capacity. You can add disks to the existing nodes or add new converge nodes to the existing cluster.
Pause replication before performing a cluster expansion; resume it after completing the expansion.
Use only administrator credentials for the controller VM during the expansion workflow. Using any other credentials other than administrator may cause the expansion to fail.
Handling "Out of Space” errors
If the system displays an "Out of Space" error, such as the cluster is entering "Read-only mode," you can either add a node to increase free capacity or delete existing unused VMs to release space. When there is an "Out of Space" condition, the VMs are unresponsive.
Note: Do not delete storage controller VMs. Storage controller VM names have the prefix stCtlVM.
Following are the steps to take to handle "Out of Space" issues:
1. To add a node, use the Expand Cluster feature of the Cisco HyperFlex Data Platform Installer.
2. To delete unused VMs:
a. Determine which guest VMs you can delete. You can consider factors such as disk space used by the VM or naming conventions.
b. Go to vCenter > Virtual Machines to display the virtual machines in the inventory.
c. Double-click a VM that you want to delete.
d. Power off the VM.
e. Delete the VM.
3. After the "Out of Space" condition is cleared:
a. Go to vCenter > Virtual Machines to display the VM in the inventory.
b. Double-click a VM that you want to use.
c. Power on the VM.
To expand the cluster with storage capacity, two different methods are available. The easiest way is to expand the HyperFlex cluster with new HyperFlex nodes, increasing the whole cluster's capacity, memory, and CPU power.
If there is enough room to expand each current HyperFlex node with capacity drives, only capacity is added to the cluster (and not memory or CPU power).
Capacity drive expansion
When a cluster runs out of space, another way to increase storage capacity is by adding more data drives to the existing nodes in the cluster. Add data drives dynamically to all nodes without waiting for rebalancing. All data drives need to be of the same capacity in the cluster.
Scenario: Adding additional drives to existing clusters
1. Add data drives dynamically – add drives to all nodes without waiting for rebalancing
2. Clusters need to be homogenous:
a. All nodes need to have the same number.
b. All data drives need to be the same capacity.
c. All data drives need to be the same type (for example, you cannot mix SED and non-SED or NVMe and SATA drives).
3. M4 and M5/M6 nodes have a different drive sled; they don't fit into other nodes.
4. Adding more drives is not applicable for cache drives (we support only one cache drive per node)
5. The additional capacity is immediately available (rebalancing may not kick off immediately).
Cluster node expansion
A converged node can be added to a HyperFlex cluster after cluster creation. The storage on a converged node is automatically added to the cluster's storage capacity. Multiple nodes can be added without waiting for rebalancing. After adding a new node, the new storage capacity is immediately available for use. Rebalancing may not start immediately every time after adding the node. The rebalancing initiation depends upon the cluster storage capacity usage.
Scenario: Adding new hyperconverged nodes (cluster node expansion)
1. The storage cluster should be healthy.
2. Check the node's interoperability rules (for example, an M4 node can be expanded with M5, but not vice versa).
3. Clusters need to be homogenous:
a. All nodes need to have the same number. An M5/M6 node has additional slots. For a mixed cluster, you can take advantage of additional slots.
b. All converged nodes should have the same configuration regarding capacity drives.
4. Ensure that the new node uses the same configuration as the other nodes in the storage cluster. This includes VLAN IDs, switch types, VLAN tagging with external switch VLAN tagging (EST), VLAN tagging with virtual switch tagging (VST), or a virtual distributed switch.
5. Ensure that the node you add is of the same model (HX220 or HX240), type (hybrid, all-flash, or all-NVMe), and disk configuration (SED or non-SED). In addition, ensure that the number of capacity disks matches the existing cluster nodes.
6. Ensure that the software version on the node matches the Cisco HyperFlex Data Platform (HXDP) version, the ESXi version, and the vCenter version. To identify the software version, go to the Storage Cluster Summary tab in vCenter and check the Cisco HyperFlex Data Platform version in the top section. Upgrade if necessary.
a. (Suppose you upgraded the cluster, and Cisco Intersight is not used for the upgrade process. In that case, you must download and install a new installer VM that matches the current version of HXDP running on the cluster.)
7. Ensure the new node has at least one valid DNS and Network Time Protocol (NTP) server configured.
8. If you use single sign-on (SSO) or auto-support, ensure that the node is configured for SSO and Simple Mail Transfer Protocol (SMTP) services.
9. Allow Internet Control Message Protocol (ICMP) for pinging between the HXDP installer and the existing cluster's management IP address.
10. You can add multiple nodes without waiting for a rebalance.
11. New capacity is available immediately. (The rebalance may not kick off immediately, and another read performance is available post-rebalance.)
See the Cisco HyperFlex Data Platform Administration Guide for expanding the HyperFlex cluster with HyperFlex nodes: Cisco HyperFlex Data Platform Administration Guide, Release 5.0 - Expand Cisco HyperFlex System Clusters [Cisco HyperFlex HX Data Platform] - Cisco
Cisco Intersight HyperFlex storage capacity forecast and trending
The Capacity Runway feature in Cisco Intersight enables you to predict the storage utilization for HyperFlex clusters. The Capacity Runway Details view displays the storage runway and utilization trend. The details on this page enable you to monitor storage utilization to manage capacity planning. If the storage utilization exceeds 76 percent, add additional drives or nodes to expand capacity. Consider removing unused virtual machines and deleting files. On the Capacity Runway Details page, you can view the following information:
● Storage runway – Displays the number of days predicted for the storage capacity to exceed the recommended capacity of 76 percent in the next full year
● Storage capacity (TiB) – Displays the amount of storage capacity available in the cluster
● Storage utilization – Displays the amount of storage capacity utilized by the cluster as a percentage. The storage utilization percentage is computed based on the total capacity and the current capacity utilization.
● Storage utilization trend – Displays the percentage increase or decrease in storage utilization in the last six months
● Storage optimization – Provides a percentage representation of the efficient usage of the storage infrastructure
● Utilization trend graph – Displays the current and forecast trends for storage utilization. The graph is color-coded to indicate the alarms raised for the thresholds. You can select utilization thresholds of 76 percent or 100 percent to view the predicted storage utilization on the graph.
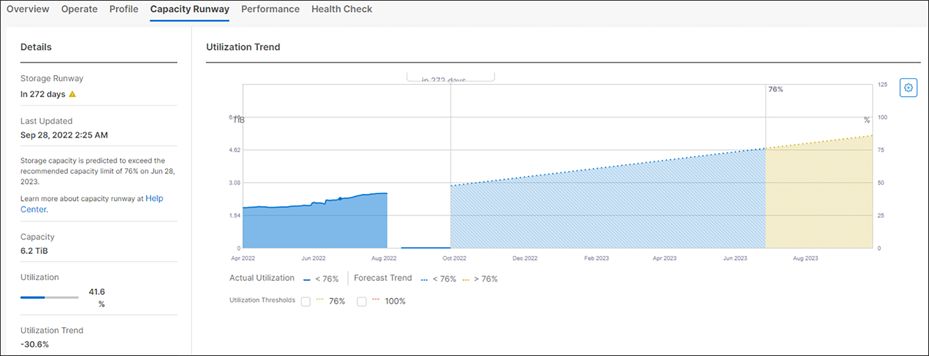
Capacity Runway in Intersight.
HyperFlex cluster capacity planning
Cisco Intersight enables you to predict the storage utilization for HyperFlex clusters. Using the historical data of used storage capacity and the predicted storage utilization per HyperFlex cluster, you can proactively scale the storage utilization on the HyperFlex clusters.
Following is a list of some essential factors to consider:
● The Capacity Runway is calculated only for HyperFlex clusters claimed and connected to Cisco Intersight.
● Claim all the servers in the HyperFlex cluster with the proper license to enable the Capacity Runway.
● After a new HyperFlex cluster installation, it may take up to five minutes for the claimed cluster's licensing details to refresh. The HyperFlex Capacity Runway tab may temporarily show that that license is unavailable.
● Capacity Runway is computed daily at 6:00 a.m. UTC, and the computation uses historical data from the last six months.
● A minimum of 14 days of data is required to begin predicting storage utilization.
● The accuracy of the predicted storage utilization increases as more recent historical data is collected.
Alarms are raised six months in advance, depending on the storage capacity utilization. Storage utilization predicts to exceed the recommended capacity limit of 76 percent in 60 days, or if the capacity may exceed 100 percent in 90 days, it raises the alarm. If the storage utilization exceeds the recommended capacity limit of 76 percent in 180 days, it raises the alarm.
Note: Capacity Runway requires a Cisco Intersight Essentials license. The Cisco Intersight Virtual Appliance does not support HyperFlex cluster capacity planning.
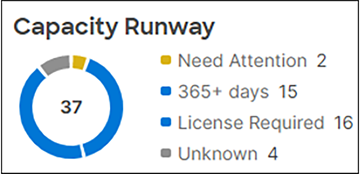
Capacity Runway overview.
The capacity values displayed in various HyperFlex views, including Dashboard, Datastore, and VM View, are not measured in real time and depend on several factors. The table below shows various "Used capacity" views in Cisco Intersight or HyperFlex Connect and several factors that play an essential role in the measurement.
Table 1. Capacity used view matrix.
| Capacity used view in Cisco intersight and HyperFlex Connect |
Deduplication/Compression |
Overhead |
In real time? |
| Dashboard |
Yes |
Yes |
No |
| Datastore |
Yes |
No |
No |
| VM view |
No |
No |
No |
This document explains the difference between TB and TiB. Where do you see the numbers in Cisco Intersight, HyperFlex Connect, and vCenter, and what do they mean?
Key takeaways:
● ∑ (Thin or thick) virtual machines ≠ Used Datastore capacity
● ∑ Datastores ≠ Total used capacity
● ∑ Virtual machines ≠ Total used capacity
The capacity values are different than expected at various times because of garbage collection (cleaning process) and ESXi “lazy updates.”
Delays in capacity number updates result in a different view of the capacity numbers and the expectation of what kind of numbers you thought to see in those views.